
Abstract
It has been suggested that tacit knowledge may be a good predictor of performance in college. The purpose of this study was to investigate the extent to which a situational judgment test developed to measure tacit knowledge correlates with predictors and indicators of college performance. This situational judgment test includes eight situations relevant to the life of college (undergraduate) students and is comprised of 211 behavioral strategies. Four hundred forty-eight college students participated in the study. The results of this study suggest that tacit knowledge has small, statistically nonsignificant correlations with cumulative grade point average (GPA), the percentage of the academic requirements passed on the first attempt, cognitive abilities, achievement motivation, and attention. However, tacit knowledge was found to correlate moderately with the personality factor of agreeableness. The findings do not support claims about the importance of tacit knowledge in academic settings and question what tacit knowledge really is and if it is a useful construct for performance prediction.
Keywords
The prediction and explanation of undergraduate student success is an important area of research in educational psychology (Breen & Lindsay, 2002). The decision to attend college is an important milestone in the pursuit of a professional career. Many universities try to predict students’ academic success. Such predictions may allow universities to identify talented students as well as students likely to experience problems assimilating into the college environment and at risk of academic failure.
Some studies of college environments (e.g., Insch, McIntyre, & Dawley, 2008; N. Leonard & Insch, 2005; Somech & Bogler, 1999) suggest that tacit knowledge may predict performance and success in college. However, further research is needed to establish the effects of this ability on student performance in college. One reason for this lacuna is that tacit knowledge is difficult to measure and compare with other determinants of college success. Nevertheless, some research studies have focused on tacit knowledge and its measurement. Such research asks, for example, if tests of tacit knowledge correlate with conventional tests of intelligence (Gottfredson, 2003; Sternberg, 2003). This research also explores the predictive validities of tacit knowledge tests (Edwards & Schleicher, 2004; McDaniel & Whetzel, 2005).
Generally, we can find in existing publications at least two basic approaches to measuring college students’ tacit knowledge. Somech and Bogler (1999) and N. Leonard and Insch (2005) focused on how often an individual behaves in a way that manifests ownership of tacit knowledge. However, Wagner (1985) used a situational judgment test (SJT). The idea of using a SJT to measure tacit knowledge is intriguing, especially because there are very few other tacit knowledge measurement instruments described in the literature. In addition, SJTs are reported to be valid predictors of job performance (Chan & Schmitt, 2002; Weekley & Jones, 1997) or a useful component of a selection battery to predict task performance (O’Connell, Hartman, McDaniel, Grubb, & Lawrence, 2007). They are also well suited to measuring behaviors elicited by complex interpersonal and administrative situations (Christian, Edwards, & Bradley, 2010). However, some studies have appeared too, which are skeptical about the usefulness of SJTs in the college admission process because of its coachability (e.g., Cullen, Sackett, & Lievens, 2006).
Tacit Knowledge
Tacit knowledge can be defined as practical abilities and skills acquired through habits and the experiences associated with these abilities and skills (Brockmann & Anthony, 2002; Gerrans, 2005). Tacit knowledge exists in the background of our thinking (Bradley, Paul, & Seeman, 2006; Gertler, 2003; Matošková et al., 2013). It is projected onto an individual’s thinking (Peterson & Walker, 2005), behavior (Gourlay, 2002), and emotions (Zhang & Han, 2009), often without conscious awareness. In the case of college students, tacit knowledge is demonstrated, for example, through the completion of academic requirements, social interactions, or participation in group activities (Insch et al., 2008; Sternberg, Wagner, & Okagaki, 1993).
The first usage of the term tacit knowledge is usually attributed to Polanyi (1966), but the more frequently used definitions of tacit knowledge are related to Ryle’s (2009) concept of knowing-how, as explained by Oguz and Sengün (2011). Ryle distinguishes between knowing-how (how to play an instrument, how to prune trees) and knowing that (finding out that the Romans had a camp in a certain place, or that German word for “knife” is “Messer”). He says that knowing-how includes that a person is ready to detect and correct lapses in his operations, to repeat and improve upon successes, to profit from the examples of others and so forth.
The concept of “tacit knowledge” has given rise to an extensive literature and is discussed in several scientific fields, including psychology. For example, Sternberg (1999) connects tacit knowledge with his concept of practical intelligence and considers tacit knowledge to be an aspect of practical intelligence; it is experience-based knowledge relevant to solving practical problems. However, according to the findings of Gottfredson (2003), tacit knowledge is connected to a motivated and sensitive application of general intelligence that we possess individually. It indicates a form of experience and knowledge that supports the gradual development of an understanding of the probabilities and possibilities of human behavior (and of individual persons) that we generally develop only by experiencing and observing them firsthand over the course of our lives (Gottfredson, 2003). Perhaps this is why tacit knowledge is often linked to one’s level of professional expertise (see, for example, D. Leonard & Sensiper, 1998; Swap, Leonard, Shields, & Abrams, 2001).
According to Eraut (2000) and D. Leonard and Sensiper (1998), the majority of tacit knowledge lies in the ability to recognize what strategy or type of behavior is suitable in certain situations. Tacit knowledge also entails rejecting certain approaches that previously proved incorrect. The molding of tacit knowledge is likely to be connected to the process of personal development, which, as Švarcová, Chochoľáková, and Dobeš (2011) have stated, is neither short nor easy. Whereas neophytes have a tendency to follow the rules and instructions they have been taught, experts can quickly decide on their next steps without necessarily considering the whole range of possible strategies. From this point of view, tacit knowledge might be connected to job knowledge, and as Kuncel, Hezlett, and Ones (2001) observe, even without any additional training, students with greater job knowledge perform better in classes and on comprehensive exams; they write better dissertations, perform better as teaching or research assistants, and generate better research than students with lower levels of job knowledge.
According to a number of authors (e.g., Jones, Failla, & Miller, 2007; Sternberg, 1997; Wagner, 1985), tacit knowledge is one of the determinants that influences success in life, as it empowers people to achieve goals that are important to them. Baumard (1996) claims that tacit knowledge plays a key role in decoding ambiguous situations. According to Sternberg (1995), tacit knowledge helps people adapt to their environment. In the case of college students, tacit knowledge should help them manage those situations that they regularly face, such as fulfilling academic requirements, learning, taking exams, solving problems, interacting with fellow students and lecturers, managing their free time, and working with information and communication technologies.
Measuring Tacit Knowledge
Although researching tacit knowledge is not easy, there have been attempts to measure it, or at least to identify individuals as having a larger or smaller amount of tacit knowledge. For example, Sternberg (1995) highlights the possibility of measuring tacit knowledge by monitoring performance in simulations. A different approach to measuring tacit knowledge is based on self-evaluating behavior—assessing whether a respondent’s behavior corresponds (in their opinion) to the behavior of successful individuals. Such tools were developed, for example, by Somech and Bogler (1999) and N. Leonard and Insch (2005).
The method of presenting scenarios—the so-called SJTs—is also often used to measure tacit knowledge (Choi, 2001; Colonia-Willner, 1999; Edwards & Schleicher, 2004; Sternberg & Wagner, 1992; Wagner, 1985). A SJT usually consists of situations that are hypothetical work-related scenarios that require either judging the appropriateness of an action or choosing the best action from among a range of options (McDaniel & Whetzel, 2005). The process of developing SJTs is presented, for example, by Sternberg (1995), Motowidlo, Crook, Kell, and Naemi (2009), Bledow and Frese (2009), and Ployhart and Ehrhart (2003).
Although SJTs have been used for several decades, their popularity has grown only in recent years. Some authors claim that this growing popularity is because SJTs have a relatively high criterion-related validity and are therefore suitable for predicting performance in employment domains (Campion, Ployhart, & MacKenzie, 2014; Chan & Schmitt, 1997; Christian et al., 2010; Motowidlo, Hanson, & Crafts, 1997). The criterion-related validity of SJTs was found to be .32 for predicting job performance across 84 studies using 11,809 individuals (McDaniel & Whetzel, 2005), which means the estimated criterion-related validity of SJTs is nearly the same as the estimated criterion-related validity of cognitive ability tests (McDaniel & Whetzel, 2005). In addition, Lievens and Patterson (2011) note that SJTs are cost-effective compared with other methods used for predicting performance, for which trained assessors are needed, such as assessment centers.
Goals of the Current Study
The aim of this study was to investigate tacit knowledge as measured by SJTs and to compare respondents’ SJT scores with their scores on other psychological tests as well as their college performance. Therefore, this article explores the contribution of tacit knowledge to the prediction of college students’ performance in college. It describes the development of an SJT intended to evaluate students’ levels of tacit knowledge. The development of the SJT was inspired by the approach presented by Sternberg (1995). However, Sternberg’s approach did not sufficiently account for the fact that it is difficult to infer tacit knowledge from interviewees’ responses to direct questions asked by interviewers. Projective techniques might be more appropriate when attempting to infer tacit knowledge. This is why we used, in addition to other methods, projective techniques in our inventory development. In contrast to Wagner’s (1985) test, the new inventory focuses on situations relevant to the lives of undergraduate students (e.g., stress related to exams or a lack of money) and tacit knowledge relating to such situations.
The goal of the present study was to investigate whether this newly developed inventory can be used to predict two measures of academic success: cumulative grade point average (GPA) and the percentage of course credits and exams passed on the first attempt. Of course, other outcome measures exist for measuring success in college, but these two outcomes have the following advantages: (a) They are easily and cheaply available in the form of quantified data, and (b) they might be at least partly independent of the investigation if they are obtained from the college’s archival records.
Our analysis is guided by the following research questions:
Research Question 1: Do SJT scores correlate with scores of other standardized psychological tests that can be used to predict college student success?
We employ tests focused on intellectual abilities, achievement motivation, attention, and personality traits. Traditionally, SJTs are reported to correlate with cognitive abilities and personality traits such as emotional stability, conscientiousness, and agreeableness (McDaniel, Hartman, Whetzel, & Grubb, 2007), which is why we expected to find negative correlations in these cases. Kuncel et al. (2001) claim that motivation influences performance on SJTs. Therefore, we hypothesized that we would find a negative correlation between students’ SJT scores and their scores on achievement motivation tests. We have not found a study comparing attention and tacit knowledge, but, on the basis of our research team’s discussions, we suppose that attention might be important for college student success as well as for gaining tacit knowledge. Thus, we predicted that we would find a negative correlation between the SJT score and the score on an attention test. The tested hypotheses associated with the first research question are as follows:
Research Question 2: What is the relationship between scores on the SJT, cumulative GPAs, and percentages of academic requirements passed on the first attempt? Could the SJT be used as a predictor of college student performance?
The following procedure was used to set a numerical value of GPA in our country: A = 1 grade point, B = 1.5 grade points, C = 2 grade points, D = 2.5 grade points, E = 3 grade points. Total grade points (from all semesters) were divided by the total course credits to get the cumulative GPA. We expected to find a positive correlation between SJT scores and cumulative GPAs. A higher score on the SJT should indicate a lower level of tacit knowledge because the SJT score is based on a standard deviation calculated by comparing the results with the average scores given by members of an expert group. A lower level of tacit knowledge should lead to a higher (worse) cumulative GPA. However, we expected to find a negative correlation between SJT scores and percentages of academic requirements passed on the first attempt. A higher score on the SJT should indicate a lower level of tacit knowledge, and this should then lead to a lower (worse) percentage of academic requirements passed on the first attempt. The tested hypotheses associated with the second research question are as follows:
If evidence that supports the interpretation and the use of the SJT scores is found, the SJT examined in this study could serve as an additional tool for identifying talented students or predicting students’ levels of adaptation to the university environment and their academic achievement. Relative to other methods of student selection (e.g., letters of recommendation, lists of extracurricular activities, essays, interviews, and references), SJTs might be less time-consuming, less expensive, and more objective (Oswald, Schmitt, Kim, Ramsay, & Gillespie, 2004).
Method
Participants
A sample of 82 undergraduate students from one school participated in the paper-and-pencil testing. Of these participants, 67.1% were female. The most common age of the respondents was 22. In addition, 73.17% of the informants were students who studied the third year of the bachelor’s degree program, the rest were students who were in the second (final) year of their master’s degree program. The test results of these 82 students were used to verify Hypotheses 1 to 4.
In addition, 366 other college students (from several institutions) participated in the electronic version of the test. It means 448 students participated in total. Of all respondents, 71.4% (320) were female. The most common age of the respondents was 22 years, and 81.2% (344) of the respondents were undergraduate students of bachelor’s degree program. A total of 94.4% of the respondents stated that they were full-time students. The majority of the respondents were economics students (336 students, or 75%). Respondents were from 15 universities, but the majority (183) were from our university. The test results of all 448 students were used to verify Hypotheses 5 and 6.
Measures
The process of developing a SJT for measuring academic tacit knowledge
The following data were used in developing the SJT:
Secondary data—articles and papers addressing topics such as tacit knowledge, life success, and student behavior at college.
Two papers written by college students on the topic of critical situations in their life and the strategies they used to manage these situations.
Transcriptions of four recorded discussions (with five full-time students, three full-time post-graduate students, three graduates, and six academic employees) that focused on outlining criteria for evaluating student success and examples of tacit knowledge important for student success.
A transcript of a recorded discussion (with six representatives from various companies) focused on outlining criteria for evaluating student success and setting examples of tacit knowledge important for success.
A transcript of a workshop recording (with 26 students), using the method of collage, on the topic “The Life of a Successful University Student.” Students were divided into teams, and each team had to make a collage on the given topic. After they finished, they presented their work to others and discussed about it.
A transcript of a workshop recording (with 12 students) about critical situations in the life of a college student.
Answers from 985 college students to a questionnaire on the characteristics of successful college students, recommendations for freshmen students, and the importance of tacit knowledge.
Transcripts of 28 individual semi-structured interviews with college students considered to be successful by their fellow students (interviews focused on students’ characteristics, critical situations in college student life, the importance of tacit knowledge in the life of a college student, and recommendations for a friendly alien who intends to study successfully and graduate from a college).
As part of the data analyses, the answer to this question was sought: “Which critical situations in a student’s life, and which behavioral strategies, are mentioned in the texts?” This topic was then discussed by team members. Finally, 51 situations were defined, and these situations were presented to eight academics and six PhD students. Based on the answers, 13 situations were chosen for further research.
Characteristics of the developed SJT
The main approaches utilized in the development of scenarios and responses were critical incidents. Continuous scoring was used (7-point Likert-type scale), and respondents were asked to rate all presented responses/strategies. The media with which the scenarios and behavioral strategies were presented were as follows: written form (for 82 participants) and on computer (for 366 participants). The study could be classified as a field study because the scenarios were linked to student life, and the respondents were real college undergraduate students.
Pre-testing the SJT for measuring academic tacit knowledge
The objective of the pre-test of the SJT was to reduce the chances of redundant data in the main study and to ensure consistent interpretation. In this pilot phase, 18 undergraduate students participated along with two PhD students and three academics. The questionnaire for the pre-test consisted of two parts. In the first part, a list of 13 scenarios was presented, and respondents were asked to circle the eight that they considered the most important. In the second part, several strategies/responses were suggested for each of the given situations. In total, there were 428 behavioral strategies listed in the test. The respondents evaluated the strategies according to how suitable each response was for managing given situations, on a scale from 1 to 7 (1 = very bad and 7 = very good). Based on participants’ answers, eight scenarios were retained for further research.
Because the number of behavioral strategies (308) was still relatively high, the responses with a median equal to 4 were omitted. Such strategies did not sufficiently distinguish between successful and unsuccessful behaviors in given situations. This step corresponds to the procedure suggested by McDaniel, Psotka, Legree, Yost, and Weekley (2011). After a team discussion, we decided to also omit responses with a median lower than 2 because most of the respondents evaluated those strategies as very bad/unusable. We supposed that such strategies would not sufficiently distinguish between the behaviors of successful and unsuccessful students—they would be viewed as unsuitable by all. After the elimination, 263 strategies remained. Finally, responses in which the expert group’s standard deviation was equal to or higher than 1.5 were omitted. The final test consisted of 211 questions.
The final structure of the SJT
Cronbach’s alpha for the prepared test was .97. The final structure of the SJT was as follows:
Scenario: Lack of finances—11 responses
Scenario: Reconciliation between personal and student life—42 responses
Scenario: Self-development in the field of expertise—28 responses
Scenario: Choice of free-time activities—seven responses
Scenario: Goal setting and maintaining the motivation to achieve goals—20 responses
Scenario: Choice of university—18 responses
Scenario: Loss of motivation to study—10 responses
Scenario: Exams, tests (this scenario was divided into several subsections: exam preparation during term time, planning the date of an exam, exam preparation during the exam period, learning itself, going to an exam, strategies related to sitting written and oral exams)—75 responses
The first scenario is presented in Figure 1.
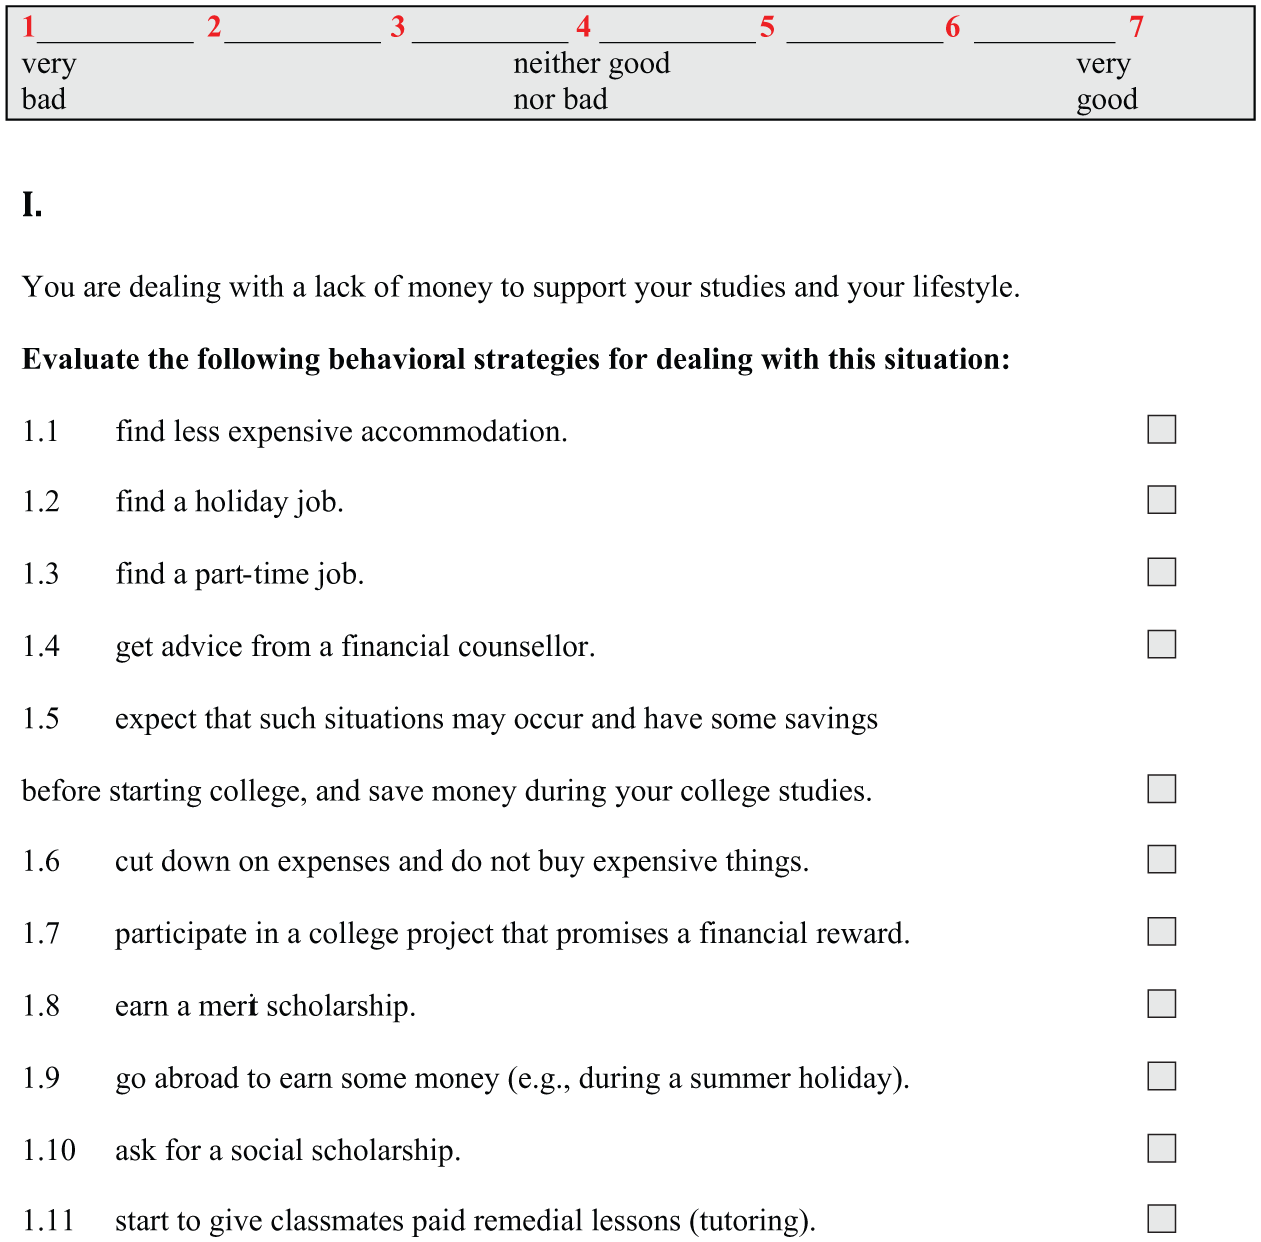
Scenario 1 in the developed SJT.
Instruments chosen to compare results
Several measuring tools were used to determine exactly what is measured by the developed inventory.
Test úrovně rozumových schopností (TURS)
The TURS is a Czech test used to measure intellectual abilities (Vonkomer, 1993). This test consists of 16 subtests, characterized by five factors—planar, spatial, verbal, numerical, and verbal-numerical. Each subtest has 20 items, and it is marked with a letter. Subtests contain tasks such as word identification, numbers in a row, the addition of dies, filling of area shapes, and identification of figures. Usually 10 subtests are used. The test has two equivalent versions—the correlation between subtests compared in these two versions is high, r(118) = .89 to .96 (Vonkomer, 1993). Test–retest reliability of the subtests after 3 to 4 days is high, r(198) = .90 to .95, and remains high after 1 year, r(138) = .77 to .90 (Vonkomer, 1993). Correlations between TURS subtest scores and GPA range from r(638) = .20 to .33 (Vonkomer, 1993). Vonkomer (1993) found correlations with components of the Intelligence Structure Test (Liepmann, Beauducel, Brocke, & Amthauer, 2007) that range from .37 to .70, and a correlation of .71 with the Advanced Progressive Matrices (Raven, 1994). We have used both versions of the TURS test plus the following 10 subtests: A—identification of words; B—identification of letters; C—numerical thinking operations; D—verbal numeric tasks; F—fulfilling of squares; G—choice of terms; H—cube counting; L—identification of sentences; T—fulfilling of surface shapes; S—identification of figures.
Leistungsmotivationsinventar (LMI)
The LMI is a German test used to measure achievement motivation in a professional context (Schuler & Prochaska, 2011). This test consists of 17 scales (endurance, compensatory effort, dominance, pride, commitment, eagerness to learn, confidence in success, level of preference for difficult tasks, flexibility, independence, flow, self-control, fearlessness, status orientation, internality, competitiveness, sense of purpose). The test outcome is the overall value for motivation achieved. Each scale is represented by 10 items, and the test has 170 items in total. Cronbach’s alpha of the total test is α = .89, the test–retest correlation after 3 months is r(203) = .86 (Schuler & Prochaska, 2011). The average correlation between scales is .34 (Schuler & Prochaska, 2011).
D2: An attention test
This is an attention test (Brickenkamp & Zillmer, 2000) focused on assessing one’s performance and concentration levels by measuring the speed and thoroughness of task performance. The test form contains the letters “d” and “p.” In front of these letters, regardless of their location, there are zero, one, or two strokes. The test has 14 rows; each of them has 47 signs. Research suggests that the D2 has adequate internal reliability, as indicated by alpha values greater than .90 (Brickenkamp & Zillmer, 2000). Among adults, the test–retest correlation after 5 hr was .92, and among students, the test–retest correlation was .86 after 6 months (Brickenkamp & Zillmer, 2000).
NEO-PI-R: Revised NEO Personality Inventory
This test (Hřebíčková, Costa, & McCrae, 2004) is based on the five-factor personality model (Big Five) and measures five general personality traits: neuroticism, extraversion, openness to experience, agreeableness, and conscientiousness. Each dimension has six partial characteristics, each of which contains eight items. The inventory is, according to Hřebíčková et al. (2004), highly reliable (240 items; α = .88-.91). The average reliability of the subscales is appropriate, α = .72 (Hřebíčková et al., 2004).
Procedure
Participation in the testing was voluntary. However, the respondents participating in the paper-and-pencil testing were promised a small financial reward because they also took several other psychological tests. The respondents participating in the computer testing gained no reward, and they did not take other psychological tests.
In partnership with the Student Affairs Office, information was obtained on the exact cumulative weighted grade average of the students who participated in the paper-and-pencil test verification. Information was also obtained about the number of academic requirements (exams, assessments) the students had passed on the first attempt. As we were not able to obtain such information about students who took part in the computer testing, we asked them, as well as students participating in the paper-and-pencil testing, to self-report these data. The correlation between self-reported GPA and student affair data about GPA was .79 for students who took tests in the paper-and-pencil format. The correlation between self-reported number of academic requirements and student affair data about it was .53 for students who took tests in the paper-and-pencil format.
It should be mentioned that the paper-and-pencil testing (particularly the D2 attention test) could have been influenced by the fact that it took place collectively in one of the lecture halls. Nonetheless, if there were a distortion of results, it is likely that it occurred similarly among all respondents. As the aim of the testing was not to analyze individual profiles but to compare test results, we view such distortions as acceptable.
The expert group
The evaluation of SJT is often based on a standard deviation calculated by comparing the results with the average marks given by members of an expert group. In this case, the members of the expert group were selected by means of a test evaluating the level to which their behavior corresponded with the behavior of a successful university student. Such a test was prepared by the research team (a similar test was used, for example, by N. Leonard & Insch, 2005; Somech & Bogler, 1999). During the expert selection process, the so-called Pareto principle (also known as the 80-20 rule) was applied. As asymmetry was apparent in results of the second test, the Johnson transformation was applied to transform data, so that we could use a normal capability analysis. Then, the 80th percentile was marked, and those respondents whose results were within this percentile or a higher percentile were included in the expert group. Then, the average marking by the expert group and the standard deviation were calculated for each response. The resulting Pearson correlation between these tests (the SJT and the test for evaluating student behavior) was −.2828, p < .001.
Data Analysis
IBM® SPSS® Statistics software was used for data analysis. The analysis focused on the reliability and predictive validity of the developed SJTs. Basic statistical characteristics of the tests employed in the survey were examined. Spearman’s and Pearson’s correlations among scores on the tests, cumulative GPAs, and percentages of academic requirements passed on the first attempt were used to test the hypotheses. In data analysis, we used student affair data on 82 students who took tests in the paper-and-pencil format; for the rest of the participants, we used their self-reported data.
Results
Table 1 shows results from respondents based on their self-reported cumulative GPA and their self-reported number of academic requirements passed on the first attempt.
Frequency of Respondents According to Their Cumulative GPA and Their Percentage of Academic Requirements Passed on the First Attempt.

Note. Self-reported cumulative GPA was used. GPA = grade point average.
The mean value of responses on the Likert-type scale was 6 for the whole group and also 6 for the expert group. The results of measuring tacit knowledge using the SJT are presented in Table 2. The SJT scores were based on a standard deviation calculated by comparing individual’s evaluation of each response with the average mark given by members of an expert group to the response. Taking into account the whole group of respondents, the difference between the best (lowest) and the worst (highest) result was 463 points.
Basic Characteristics of SJT Scores.
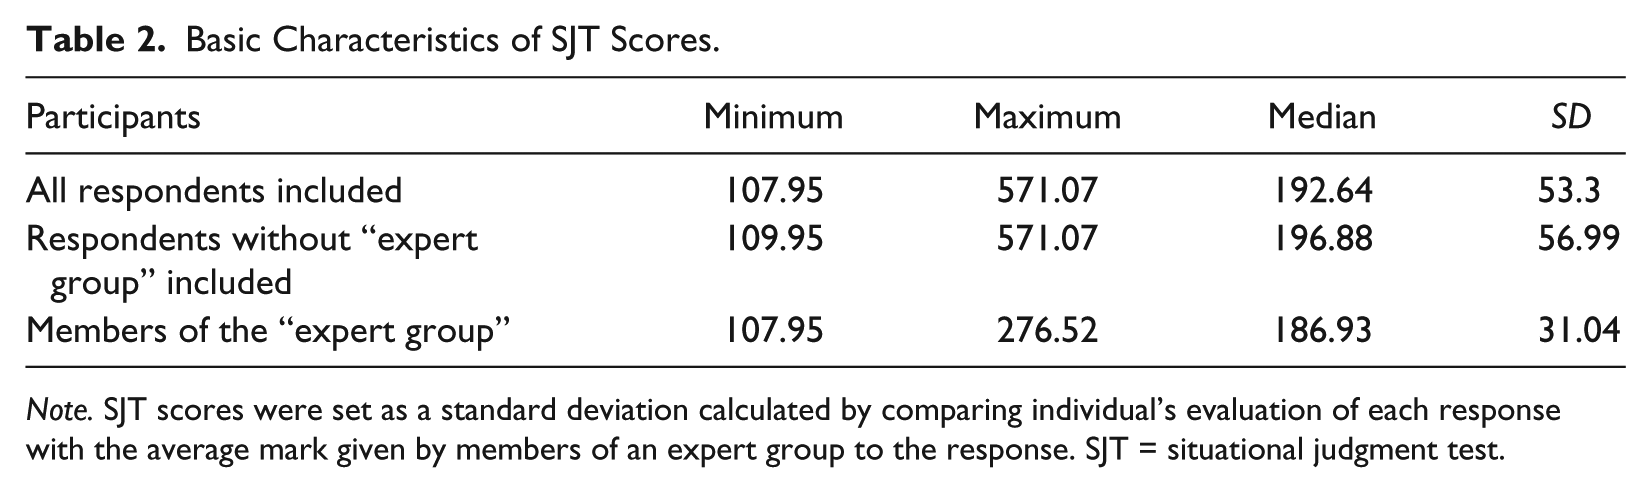
Note. SJT scores were set as a standard deviation calculated by comparing individual’s evaluation of each response with the average mark given by members of an expert group to the response. SJT = situational judgment test.
Comparing SJT Results With Results From Other Psychological Tests
To examine the external relations of the SJT with other tests, 82 participants completed the SJT and other tests in a paper-and-pencil form. A summary of the basic statistical characteristics of the results of the paper-and-pencil form tests is presented in Table 3.
Basic Statistical Characteristics of the Tests Employed in the Survey.

Note. TURS = a test of the level of intellectual ability; LMI = a test of achievement motivation; D2 = an attention test; NEO-PI-R = revised NEO Personality Inventory; SJT = the developed Situational Judgment Test.
The Spearman’s rank correlation coefficient method was used to examine the correlation between the sum of points earned on the created test, and the results of the other tests (Table 4).
Spearman’s Correlations Among Tests, Cumulative GPA and the Percentage of Academic Requirements Passed on the First Attempt.
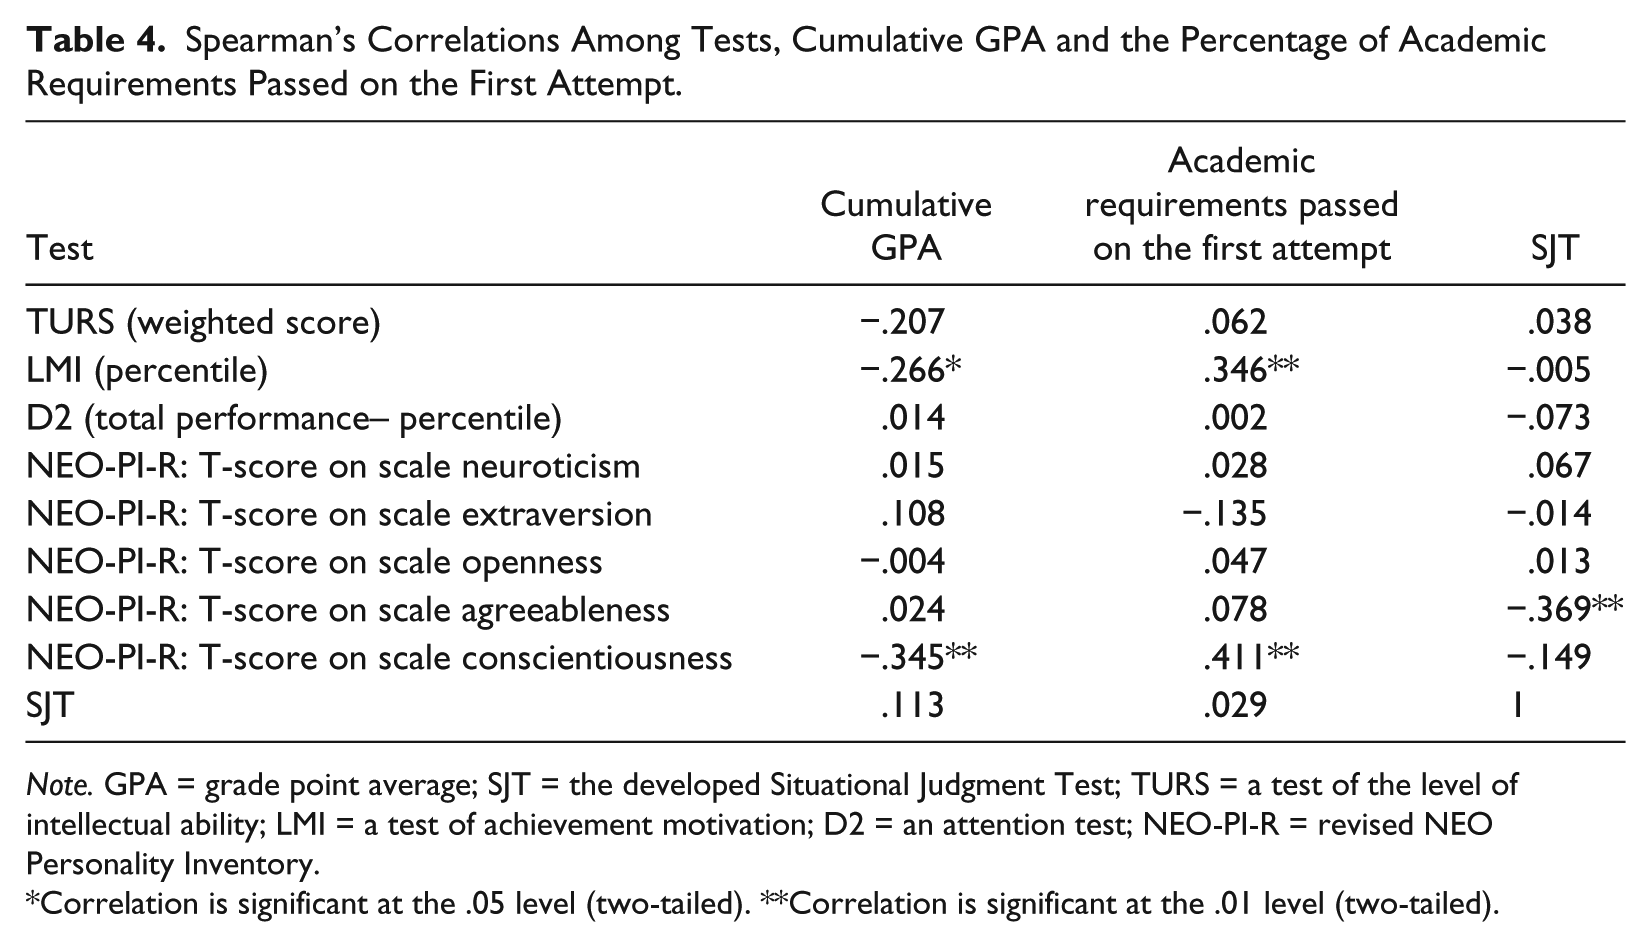
Note. GPA = grade point average; SJT = the developed Situational Judgment Test; TURS = a test of the level of intellectual ability; LMI = a test of achievement motivation; D2 = an attention test; NEO-PI-R = revised NEO Personality Inventory.
Correlation is significant at the .05 level (two-tailed). **Correlation is significant at the .01 level (two-tailed).
Four hypotheses were tested with the following results:
Hypothesis 1
SJT scores have a negative correlation with intellectual ability. No statistically significant correlation was identified, rs(80) = .038, p = .732.
Hypothesis 2
SJT scores have negative correlations with conscientiousness, agreeableness, and neuroticism. A medium negative correlation was found between SJT scores and agreeableness, rs(80) = −.369, p = .001. No statistically significant correlation was found between SJT scores and conscientiousness, rs(80) = −.149, p = .182. Similarly, no statistically significant correlation was found between SJT scores and neuroticism, rs(80) = .067, p = .550.
Hypothesis 3
SJT scores have a negative correlation with achievement motivation. No statistically significant correlation was identified, rs (80) = −.005, p = .964.
Hypothesis 4
SJT scores have a negative correlation with attention. No statistically significant correlation was identified, rs (80) = −.073, p = .516.
The Use of the SJT as a Predictor of College Performance
Two hypotheses were used for testing the suitability of the SJT for predicting college performance:
Hypothesis 5
There is a positive correlation between SJT scores and cumulative GPAs. A statistically significant correlation was not found in relation to student affair data about cumulative GPA in the case of respondents who took paper-and-pencil tests, r(80) = .10, p = .362. Similarly, this relation was not confirmed in a larger sample, and there was no statistically significant correlation identified between cumulative GPA and SJT scores, r(446) = .08, p = .09.
Hypothesis 6
There is a negative correlation between SJT scores and the percentage of academic requirements passed on the first attempt. A statistically significant correlation was not found in relation to student affair data about the percentage of academic requirements passed on the first attempt in the case of respondents who took paper-and-pencil tests, r(80) = −.05, p = .69. There was only a small negative correlation identified between the number of academic requirements passed on the first attempt and SJT scores in the case of the whole sample, r(446) = −.10, p = .03.
Discussion and Conclusion
Tacit knowledge (and the ability to quickly acquire such knowledge) is often presented as one of the factors influencing students’ success (N. Leonard & Insch, 2005; Wagner, 1985). This study contributes to professional publications focused on measuring tacit knowledge. The main research questions in this article concern the relationship between levels of tacit knowledge and college student performance, and the relationship between levels of tacit knowledge and other personal characteristics. To closely examine the relative influences of these constructs, we developed a new SJT that measures tacit knowledge. Respondents evaluated responses according to their suitability in given scenarios on a 7-point Likert-type scale. This article has detailed both the development of the SJT and external relations that the developed SJT has with some external variables such as intellectual abilities, agreeableness, conscientiousness, achievement motivation, and attention.
The number of scenarios included in an SJT ranges from 4 to 93 (Campion et al., 2014). In our case, we used eight scenarios that related to the life of a college student, which consisted of 211 responses in total. Sample sizes of SJTs in the published literature range from 21 to 20,880 (Campion et al., 2014). In our case, the sample size was 82 (paper-and-pencil tests) plus 366 (online tests).
Correlations Among the Employed Tests
Empirical evidence indicates that the constructs typically assessed by SJTs are general mental ability, conscientiousness, agreeableness, and neuroticism (McDaniel & Whetzel, 2005). Although McDaniel and Nguyen (2001) mention that it would be unlikely that a SJT can be entirely unrelated to general cognitive ability, we did not find a statistically significant correlation between intellectual ability and SJT scores. This finding might support Sternberg’s and Hedlund’s (2002) claim that tacit knowledge tests measure abilities that are distinct from those assessed by traditional intelligence tests. However, an alternative explanation related to the way SJTs are constructed and used is discussed by McDaniel, Morgeson, Finnegan, Campion, and Braverman (2001), especially that many of the validation studies of tacit knowledge tests have used samples with a restricted range of mental abilities, which attenuate the relationship between tacit knowledge and general cognitive ability, or that there is no standardized answer key.
Some relations between the SJT score and general personality traits were identified. According to McDaniel and Nguyen (2001), neuroticism was found to have the highest correlation with SJTs within the Big Five personality dimensions (r = .31), but we did not find such a correlation in our case. However, a negative correlation was found between the result achieved by a respondent on the SJT and the level of agreeableness, rs(80) = −.369, p = .001. Thus, the ratings of responses made by college students with high levels of agreeableness were closer to the ratings of responses made by members of the expert group. This might indicate that a higher level of tacit knowledge is associated with a higher level of agreeableness (and traits such as being courteous, trusting, straightforward, and soft-hearted). This finding is consistent with the findings of Oswald et al. (2004). However, it contradicts the findings of Fang and Zhang (2014) and Sloan (2004), who found a statistically significant negative correlation between the amount of tacit knowledge and the level of agreeableness.
A moderate negative correlation was identified in relation to the level of conscientiousness. That is, tacit knowledge test ratings scored by college students with higher levels of conscientiousness are probably closer to the ratings of members of the expert group. This might indicate that a higher level of tacit knowledge is connected with a higher level of conscientiousness (and traits such as a strong sense of purpose, obligation, and persistence). This finding supports the findings of Oswald et al. (2004) and contradicts the prior research of Fang and Zhang (2014).
Sloan (2004) identified a negative correlation between the level of openness and the score achieved on a tacit knowledge test. Therefore, a higher degree of openness leads to a better result when measuring tacit knowledge (i.e., a smaller deviation from the expert evaluation). However, we did not find a statistically significant correlation in this case, and Oswald et al. (2004) identified a positive correlation. Furthermore, we predicted finding a negative correlation between SJT scores and achievement motivation, and between SJT scores and attention. However, no statistically significant correlations were identified in these cases.
In sum, we can assume that some general personality traits might influence the acquisition of tacit knowledge, or vice versa, but further research is needed to better understand the nature of these effects.
The Use of SJT as a Predictor of College Student Success
McDaniel et al. (2001) say that SJTs are good predictors of job performance. Similarly, a few studies which used SJTs for tacit knowledge measurement have shown reasonable support for tacit knowledge as a valid predictor of performance (Edwards & Schleicher, 2004). In addition, Oswald et al. (2004) stated that their SJT provided incremental validity when considered in combination with standardized college-entrance tests (i.e., SAT/ACT), biographical data, and a measure of Big Five personality constructs. They also found a small positive correlation (r = .16) between SJT scores and cumulative GPA (Oswald et al., 2004). Moreover, similar results were presented in the study by Edwards and Schleicher (2004). Therefore, we expected to find a positive correlation between SJT scores and cumulative GPAs. We also anticipated a negative correlation between SJT scores and percentages of academic requirements passed on the first attempt. However, we did not find a significant relationship between SJT scores and cumulative GPAs, and only a small correlation with academic requirements passed on the first attempt.
A reason for the fact that no statistically significant relationship was observed between SJT scores and cumulative GPAs could be the way in which the SJT was developed. The SJT’s pre-test responses with a median lower than 2 were discarded, which could mean that some predictive items were also discarded. It might be useful to reanalyze the relevance of the items/responses included in the pre-test as a function of their mean and variance, as mentioned by McDaniel et al. (2011). Furthermore, we concentrated on tacit knowledge in the SJT development, which influenced the choice of the expert group too. Different expert groups might develop different answer keys, as stated by McDaniel et al. (2001), and this can have an impact on final correlations. To improve the predictive validity of the SJT, we might try to choose members of the expert group in a different way—to select students who have great academic results. Another suggestion to improve the predictive validity of the developed SJT is to change the Likert-type scale used. No response in the SJT was evaluated as “very bad” by respondents in the pre-test. This means that it is probably not necessary to have a “negative part” (from 1 = very bad to 4 neither good nor bad) on the Likert-type scale. The scale could be changed to the following: 1 = only slightly useful, 7 = very useful. The finding that there is a statistically significant correlation with the level of agreeableness and no correlation with indicators of college success is not so surprising, as Barrick and Mount (1991) found that agreeableness does not predict job performance, even in those jobs containing a large social component.
In sum, our findings do not support the use of SJTs for predicting academic outcomes in college. In addition, our results do not support claims (i.e., Cianciolo et al., 2006; Somech & Bogler, 1999; Sternberg & Wagner, 1992) regarding the importance of tacit knowledge in academic settings.
Limitations of the Study
It is important to bear in mind the limitations of the present study. The study was restricted to a particular sample of students, from a particular set of disciplines in a particular setting. In addition, the testing was voluntary, which can influence the representativeness of the sample. Furthermore, only a relatively small group of students (82) participated in the above-mentioned paper-and-pencil testing, which compared SJT with other psychological tests, and this testing was undertaken in relatively unconventional conditions (i.e., tests were administered in a group format). Moreover, as we were not able to obtain the actual data on students’ academic results from university records in the case of the computer testing, we had to rely on their self-reports. It is known that self-reported data are prone to errors of memory and response bias due to social desirability. In addition, the study used a questionnaire measure of tacit knowledge that was developed for this investigation and has not been used elsewhere. It is clear that great caution should be exercised in not overgeneralizing the findings.
Perspective on Future Research
Future research could focus on the relation between personality traits (intellectual ability, agreeableness, conscientiousness, openness to experience) and tacit knowledge, because the results of such studies are not consistent. In addition, it could help decide what tacit knowledge really is and if it is a useful construct for performance prediction. Furthermore, future research might analyze the relation between the amount of tacit knowledge and other dimensions of college student success. It might also be appropriate to compare the academic results of students with high SJT scores with those with low SJT scores over long-term periods. Although the SJT may be useful for identifying gifted students or for admissions decisions, evidence should be found before potential test users utilize the SJT for such purposes. Indeed, further research is needed to determine whether SJTs are appropriate for use in academic settings.
Footnotes
Declaration of Conflicting Interests
The author(s) declared no potential conflicts of interest with respect to the research, authorship, and/or publication of this article.
Funding
The author(s) disclosed receipt of the following financial support for the research, authorship, and/or publication of this article: This contribution was written within the framework of the GA ČR (Czech Science Foundation) grant-maintained project: Reg. No. 407/12/0821, Creating a Czech Instrument for Measuring Academic Tacit Knowledge, and with the financial support of GA ČR.