
Abstract
This article presents results from two studies that included ethnically and socioeconomically diverse samples totaling 4,462 children in kindergarten through third grade. Each study examined the psychometric properties of a web-based, self-administered battery of assessments of social-emotional comprehension called “SELweb.” Assessment modules measured children’s ability to read facial expressions, infer others’ perspectives, solve social problems, delay gratification, and tolerate frustration. Both studies provided evidence that (a) individual assessment modules exhibited moderate to high internal consistency and low to moderate test–retest reliability; (b) composite assessment scores exhibited high reliability; (c) together, assessment modules demonstrated a theoretically coherent factor structure; (d) factor scores demonstrated convergent and discriminant validity; and (e) controlling for IQ and demographic characteristics, performance on the assessment modules was positively related to peer acceptance, teacher report of social skills, and multiple indicators of academic achievement, and negatively related to teacher report of problem behaviors.
Keywords
Many cognitive, affective, and behavioral processes influence children’s ability to succeed in school and with peers. Among those processes, we define social-emotional comprehension as mental skills involved in understanding others’ emotions and intentions and solving social problems. Our definition also includes cognitive and affective dimensions of self-control. These components of social-emotional comprehension have been identified as both theoretically and practically important (Crick & Dodge, 1994; Halberstadt, Denham, & Dunsmore, 2001; Lipton & Nowicki, 2009). Past work, reviewed below, suggests that children’s social-emotional comprehension is associated with social, behavioral, and academic outcomes.
The Need for Direct Assessment of Social-Emotional Comprehension
Despite its clinical and educational importance, few tools are available for educators and other professionals to assess children’s social-emotional comprehension. Most existing social-emotional assessments measure child behavior (Crowe, Beauchamp, Catroppa, & Anderson, 2011; Denham, Ji, & Hamre, 2010). Yet rigorous assessment of social-emotional comprehension is critical so that clinicians and educators can fully evaluate children’s strengths and needs in ways that inform practice. For example, if a child performs poorly on a social problem-solving test, teachers can use evidence-based instructional strategies to improve social problem-solving skills (Durlak, Weissberg, Dymnicki, Taylor, & Schellinger, 2011; Kazdin, Siegel, & Bass, 1992).
As defined here, social-emotional comprehension comprises mental skills that may not have straightforward behavioral correlates. An important issue concerns the optimal method to assess these skills. Although teacher report is widely used, because social-emotional comprehension involves mental processes, observers must make a high level of inference, potentially attenuating validity. Furthermore, self-report is only modestly correlated with skill level (Shrauger & Osberg, 1981) and vulnerable to social desirability response bias (Crowne & Marlowe, 1960). An alternative that addresses these limitations is direct assessment, defined here as a method of measuring social-emotional comprehension through performance on items that demonstrate mastery of skills (McKown, 2015).
Optimal direct assessments, we believe, have four characteristics. First, to ensure that they measure relevant skills completely, they should adequately sample the content domain (Nunnally & Bernstein, 1994). Second, to ensure that barriers to use are as low as possible, they should be easy for educators and other professionals to use. Third, to increase their ability to reach as many children and educators as possible, they should permit group administration (Murphy & Davidshofer, 2004). Fourth, to reach the broadest range of children, they should be appropriate for a broad population of typically developing and atypical children. Finally, because social-emotional learning is a priority in early elementary school (Thompson & Goodman, 2009), its assessment is particularly important in the early grades.
Some existing direct assessments have some of these characteristics, but none has all. For example, the Diagnostic Analysis of Nonverbal Accuracy (DANVA; Nowicki & Duke, 1994) assesses emotion recognition, which is one dimension of social-emotional comprehension. Others, like the Mayer–Salovey–Caruso Emotional Intelligence Test–Youth Version (Mayer, Caruso, & Salovey, 2005), measure more broadly, but require advanced training to administer and cannot be administered to groups. Still others, like the Social Information Processing Application (SIP-AP; Kupersmidt, Stelter, & Dodge, 2011), are web-delivered, and therefore scalable, but are designed for a specific purpose, in this case to assess social-cognitive correlates of aggression in boys 8 to 12 years old (Kupersmidt et al., 2011).
A System to Assess Social-Emotional Comprehension
To address the need for social-emotional comprehension assessments with these characteristics, we developed a web-based system called SELweb. SELweb assesses four dimensions of social-emotional comprehension, three of which are adapted from Lipton and Nowicki’s (2009) model. “Social Awareness,” the ability to understand others’ emotions, draws on research on nonverbal communication (Nowicki & Duke, 1994). “Social Meaning,” the ability to interpret others’ mental states, draws on research on theory of mind and perspective-taking (Happé, 1994; Wellman & Liu, 2004). “Social Reasoning,” the ability to reason about social problems, draws on social information-processing research (Bauminger, Edelsztein, & Morash, 2005; Crick & Dodge, 1994). Extending the Lipton and Nowicki (2009) model of social-emotional comprehension, we include “Self-Control,” which includes mental processes involved in delaying gratification and controlling emotions to achieve a goal (Duckworth, 2011)
In addition to their prominence in theory, prior research using direct assessment has shown that each dimension of social-emotional comprehension is associated with academic, social, behavioral, health, and economic outcomes (Blair & Razza, 2007; Crick & Dodge, 1994; Izard et al., 2001; Moffitt et al., 2011; Nowicki & Duke, 1994; Ziv, 2013). Accordingly, SELweb is designed to assess these four components of social-emotional comprehension.
For ease of use, SELweb assessment modules, each measuring a distinct dimension of social-emotional comprehension, incorporate voice-over narration, developmentally appropriate language, and pictorial items that children can navigate independently. To maximize scalability, SELweb was built in Flash and is suitable for group administration on computers with Internet connections and a web browser. School staff upload a student roster and at the time of testing, administrators log children into the assessment, and children sit at a computer with headphones to complete the assessment. Responses are saved to a secure database.
Hypotheses
This article presents findings from two studies of the psychometric properties of SELweb. The first included 1,239 children. Findings from Study 1 guided modifications to SELweb. A second study included 3,223 children. We hypothesized the following:
Study 1 Methods
Recruitment
Participants were recruited during 2012-2013 from seven schools in four school districts near a large Midwestern city. In six schools, school staff use SELweb to guide instruction. In those schools, all students in kindergarten through third grade completed SELweb and the University’s institutional review board (IRB) granted a waiver of informed consent to use deidentified SELweb and academic data. In the seventh school, at the request of administrators, SELweb was only administered to children whose parents consented. In that school, IRB-approved consent forms were sent home with students.
In the schools with whom we had a waiver of consent for SELweb administration, parents of all children in kindergarten through third grade were invited to consent to their child’s participation in an “add-on” study. From add-on study students and their teachers, we collected additional measures of social-emotional comprehension and teacher rating scales. In the seventh school, all children whose parents consented completed SELweb and validation measures. Sample characteristics are described in Table 1.
Sample Characteristics.
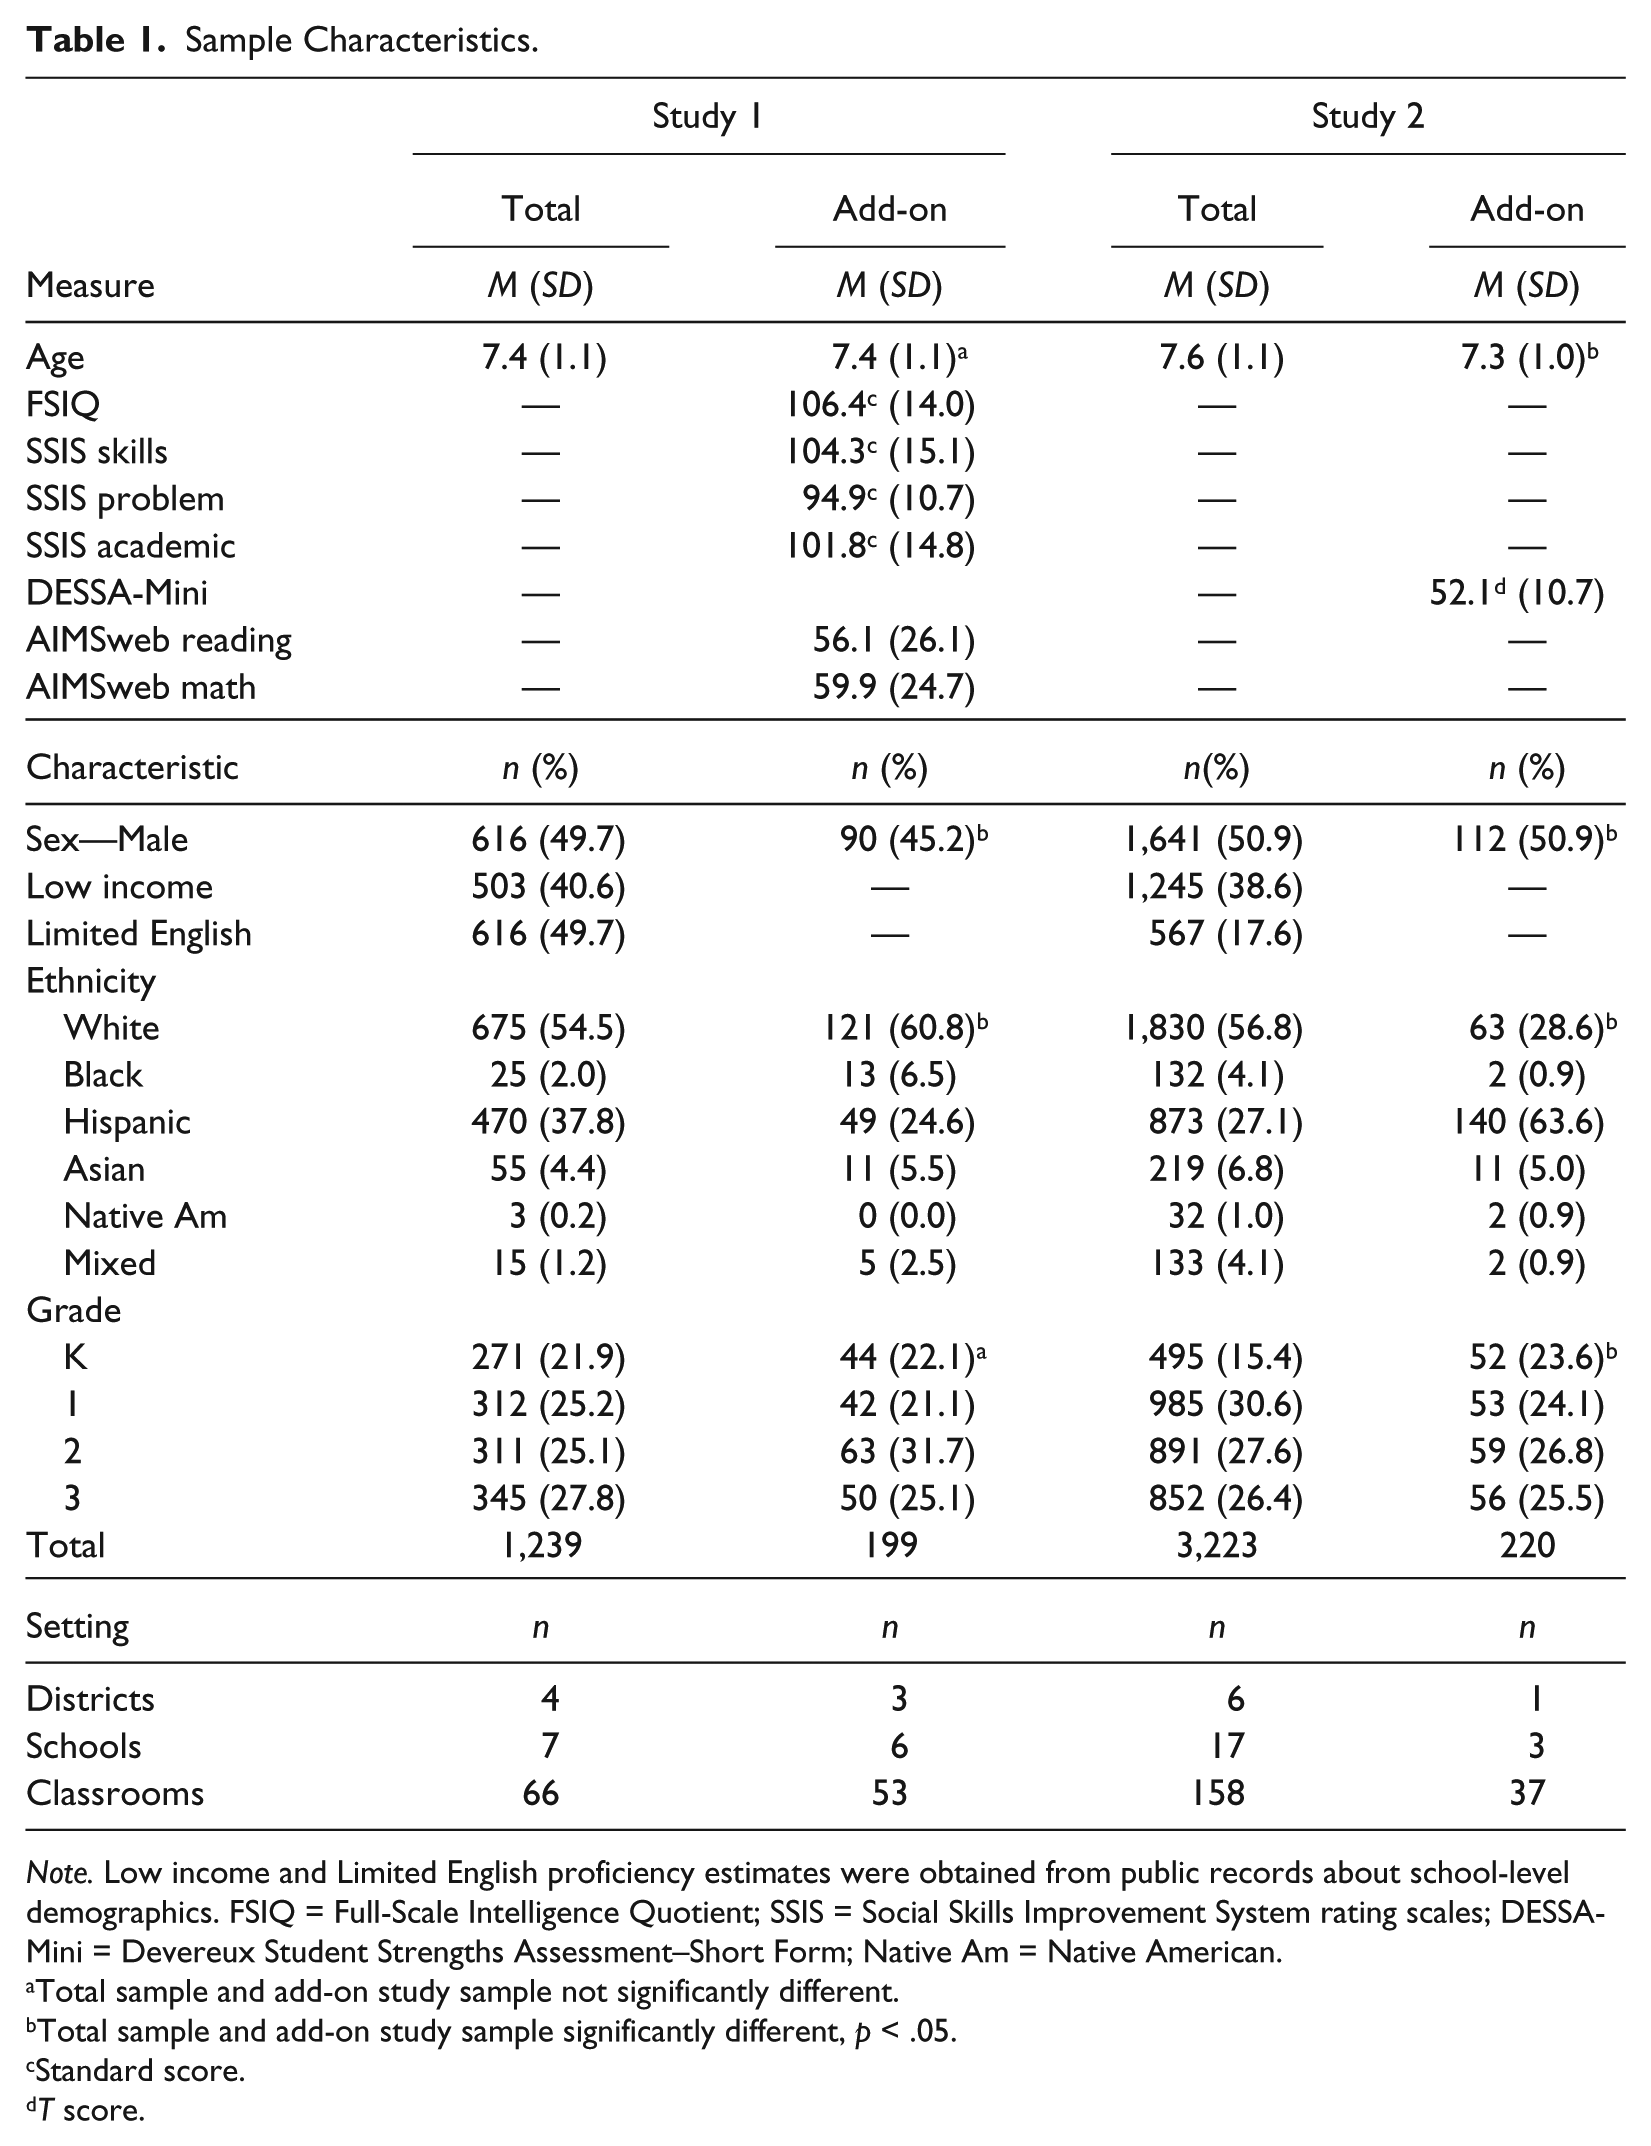
Note. Low income and Limited English proficiency estimates were obtained from public records about school-level demographics. FSIQ = Full-Scale Intelligence Quotient; SSIS = Social Skills Improvement System rating scales; DESSA-Mini = Devereux Student Strengths Assessment–Short Form; Native Am = Native American.
Total sample and add-on study sample not significantly different.
Total sample and add-on study sample significantly different, p < .05.
Standard score.
T score.
Procedures
In schools using SELweb to guide instruction, school personnel administered SELweb in one or two group sessions totaling approximately 45 min. In those schools, study staff collected validation measures, described below, from children whose parents consented to the add-on study. In the remaining school, study staff administered SELweb and validation measures individually to students in two 45-min sessions.
One district with three schools opted to administer SELweb in both the fall and spring. Mean time between administrations was 165 days (range = 133-202). Data collected from these two time points were then used to estimate temporal stability.
Measures
SELweb overview, response options, and scoring
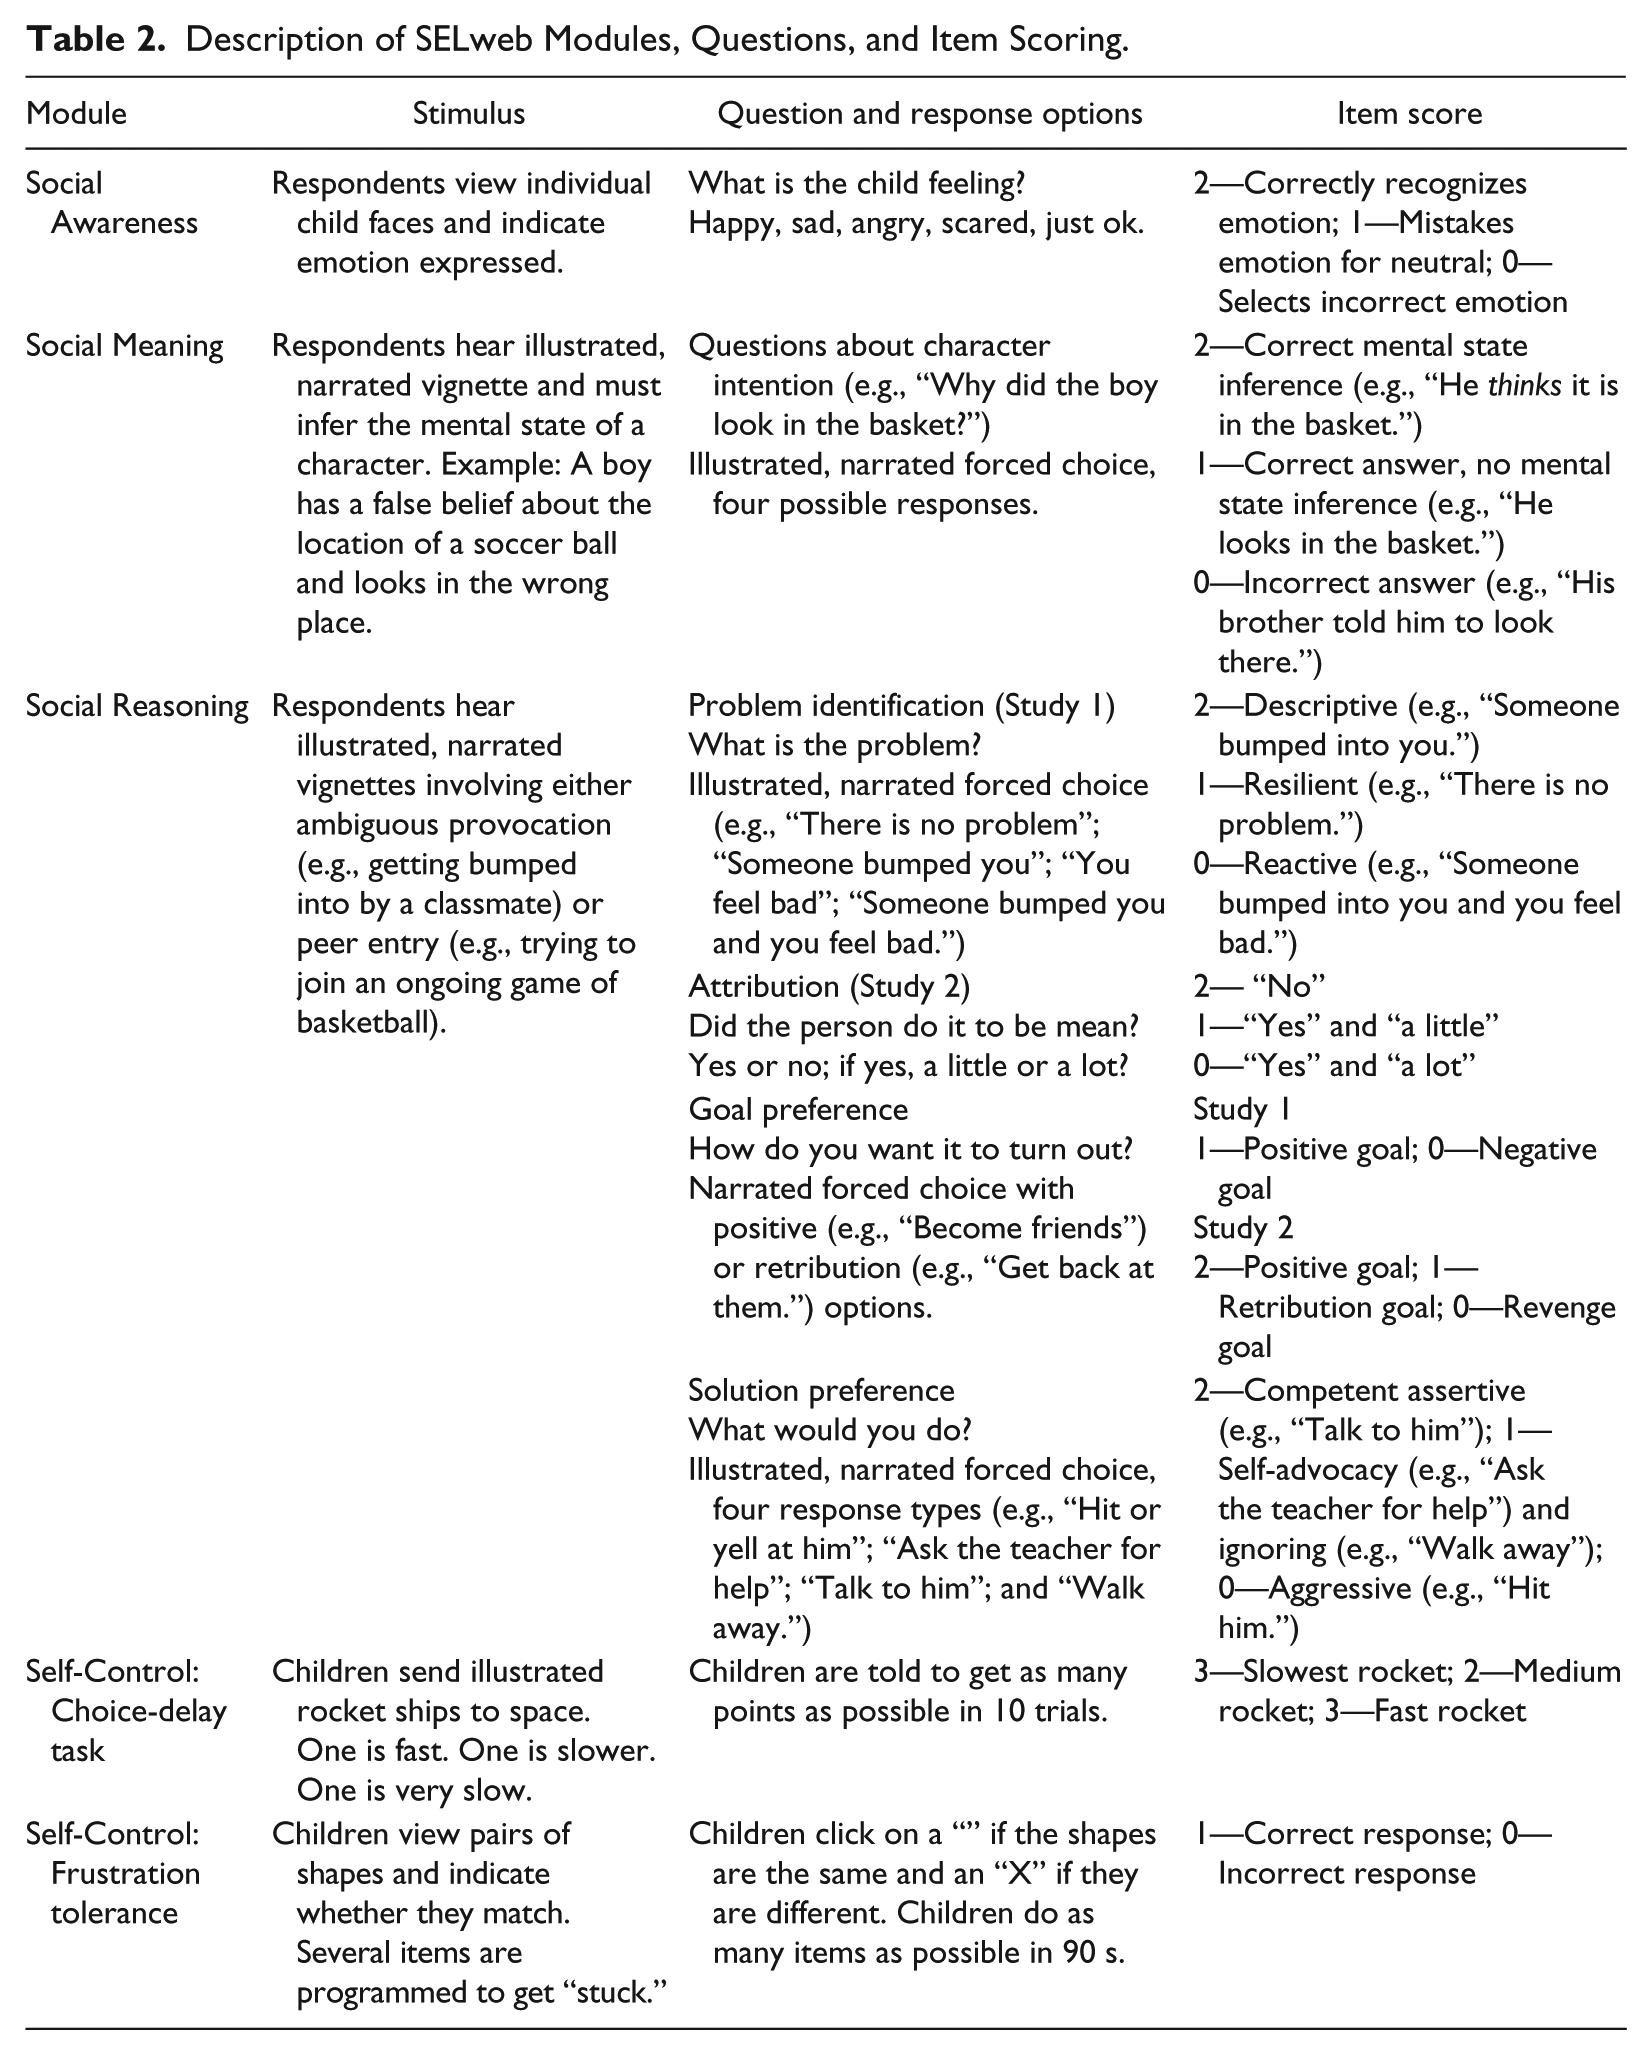
SELweb modules measure facial emotion recognition (Social Awareness), social perspective-taking (Social Meaning), social problem-solving (Social Reasoning), and delay of gratification and frustration tolerance (Self-Control). Description of stimuli, response options, and scoring for all modules is in Table 2. Reliability statistics for SELweb are in Table 3.
Description of SELweb Modules, Questions, and Item Scoring.
Score Reliabilities.

Note. Correlations available on request. SE Comprehension = social-emotional comprehension; DANVA = Diagnostic Analysis of Nonverbal Awareness; UCDSEE = U.C. Davis Set of Emotion Expressions; SIP-AP = Social Information Processing Application; Prob ID = problem identification; KiTAP = Test of Attentional Performance for Children; SSIS = Social Skills Improvement System rating scales; DESSA-Mini = Devereux Student Strengths Assessment–Short Form.
Split-half reliabilities from KiTAP manual (Zimmerman et al., 2005).
Reliabilities from AIMSweb manual (Pearson Education, 2012).
Social Awareness
Six photographs of child faces with neutral facial expressions, including three girls and two ethnic minorities, were used to create the Social Awareness module. With FaceGen software (Singular Inversions, 2005), the photographs were digitized and altered into high-intensity displays of happy, sad, angry, and frightened. We depicted basic emotions because children’s ability to recognize these emotions varies and is associated with important outcomes (Nowicki & Duke, 1994). For each face and emotion, we created a set of 10 faces ranging from low- to high-intensity affect displays, forming a pool of 246 images or items. From this item pool, seven different test forms were created, each with 44 or 45 items. Faces were assigned to test forms to ensure a balance of emotions, intensities, and child faces within a given form. Sixteen to 20 items on each test form were included on more than one form.
After each face was presented, children clicked to indicate whether the face reflected happy, sad, angry, scared, or just okay. Item scoring is described in Table 2. To adjust for differences in test form difficulties and thereby equate scores, item scores were summed and standardized within form.
Social Meaning
Consistent with existing measures (Happé, 1994; Wellman & Liu, 2004), we created 12 illustrated and narrated vignettes in which a character is disappointed, scared, sarcastic, lying, hiding feelings, or harboring a false belief. After each story, children were asked a question whose correct answer required accurate inferences about the story character’s mental state. Item scoring is described in Table 2. Item scores were summed across vignettes.
Social Reasoning
We created five illustrated and narrated vignettes involving ambiguous provocation and five involving peer entry. After each vignette, children selected (a) a description of the problem, (b) a social goal, and (c) solution preference. Each question was scored as described in Table 2. Scores for each question were summed across vignettes and standardized within test form to equate scores. To reduce respondent fatigue, we created five test forms with six vignettes each. Each form included three ambiguous provocation vignettes and three peer entry vignettes. Each vignette was included on three forms.
Self-Control
We developed a choice-delay task (Kuntsi, Stevenson, Oosterlaan, & Sonuga-Barke, 2001) and a frustration-tolerance task (Bitsakou, Antrop, Wiersema, & Sonuga-Barke, 2006). Scoring is described in Table 2.
Add-On Study Validation Measures of Social-Emotional Comprehension
Here we describe criterion measures completed by add-on study participants. Reliability statistics for these measures are reported in Table 3.
Social Awareness
Children viewed 24 child faces from the DANVA2 (Nowicki & Duke, 1994) and clicked whether each was happy, sad, angry, or scared. Final score was the number of correct items.
Social Meaning
Children completed six vignettes from the Strange Stories (Happé, 1994). In each vignette, a character states one thing but intends something else. Children were asked why the character said what he or she said. Children received one point for inferring the speaker’s intention. Final score on Strange Stories was the summed item scores.
Social Reasoning
Children completed four vignettes from the SIP-AP (Kupersmidt et al., 2011), a video-based measure of social information processing. Following each vignette, children answered questions assessing problem identification, goals, and solution preference. Total score for each question was the sum of scores across vignettes.
Self-Control
Children completed the Distractibility and Go/No Go subtests from the Test of Attentional Performance for Children (KiTAP; Zimmermann, Gondan, & Fimm, 2005). Each test yielded the number of items correct.
Add-On Study Criterion Measures
Behavior
Teachers completed the Social Skills Improvement System rating scale (SSIS; Gresham & Elliott, 2008). Scores were computed for social skills and problem behaviors.
Achievement
The SSIS academic competence scale indexed achievement. In addition, children in the add-on study completed AIMSweb reading and math tests (Pearson Education, 2012). AIMSweb national percentile scores were used in all analyses.
Peer acceptance
SELweb includes a peer nomination module. Children viewed buttons that appear sequentially, each with the name of a classmate. A synthesized voice read each child’s name as it appeared. Respondents clicked on classmates who they liked or who they liked to spend time with. The number of nominations was unlimited. Each child’s within-class standardized number of nominations indexed peer acceptance.
Add-On Study Covariate
We wished to determine the relationship between social-emotional comprehension and academic achievement, controlling for overall cognitive ability. Accordingly, to estimate IQ as a covariate, we administered the Information and Matrix Reasoning subtests of the Wechsler Intelligence Scale for Children, 4th edition (WISC-IV; Sattler, 2008; Wechsler, 2003).
Missing Data
There were no missing data within completed modules. Of 1,239 participants, 1,187 completed all SELweb modules (96.7%). A small number of modules were not completed because of student absences.
Study 1 Results
Reliability
Internal consistency
To test reliability hypotheses, we calculated the internal consistency of scores. For Social Meaning, a single score measure, we computed Cronbach’s alpha. One item demonstrated low item-total correlation and was dropped from the measure. Social Awareness, Social Reasoning, and Self-Control scores were derived from multiple forms and scores. Internal consistency coefficients for each score were calculated and averaged across forms. Factor score reliabilities were estimated using procedures described by Nunnally and Bernstein (1994, p. 271):
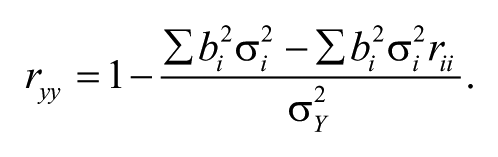
Score reliabilities are summarized in Table 3.
Six-month stability
Next, we tested 6-month measurement stability, presented in Table 3. Because children were randomly assigned to Social Awareness and Social Reasoning test forms, for those assessment modules, temporal-stability estimates reflected a mix of alternate forms and test–retest reliability.
Validity
Factor structure
We hypothesized that SELweb scores would fit a four-factor model of social-emotional comprehension in which Social Awareness, Social Meaning, Social Reasoning, and Self-Control reflect correlated latent variables. To test this hypothesis, we used the complex sample facility in MPlus (Muthén & Muthén, 2012) to run confirmatory factor analyses (CFAs) that accounted for the nesting of students in classrooms. When models included a single indicator for a latent variable, the error variance was modeled as 1 minus the internal consistency of the indicator variable score (Kline, 2005). We compared our hypothesized model to three plausible alternatives to evaluate the extent to which our hypothesized model was superior to those alternatives. Because simpler CFA models were nested within more complex models, the change in χ2 goodness of fit was used to compare the fit of the models to one another (Kline, 2005).
The fit of a one-factor model, in which all scores loaded on a single factor, was marginal (CFI = .86, RMSEA = .075, 90% confidence interval [CI] = [.067, .083]). Because emotion recognition and perspective-taking both reflect understanding others, we next tested the fit of a two-factor model with emotion recognition and perspective-taking scores loading on one factor, and the social problem-solving and self-control scores on a second factor. Model fit was marginal (CFI = .86, RMSEA = .076, 90% CI = [.068, .084]). Because problem-solving and self-control may be distinct from one another, we next tested a three-factor model, with emotion recognition and perspective-taking scores loading on one factor, self-control scores on a second factor, and social problem-solving scores on a third factor, and the fit was marginal (CFI = .88, RMSEA = .072, 90% CI = [.063, .080]). The fit of the four-factor model was excellent (CFI = .95, RMSEA = .046, 90% CI = [.037, .056]). That model, depicted in Figure 1, was a significantly better fit to the data than the alternatives (all comparisons to the four-factor model, Δχ2/df > 30, p < .05).

Confirmatory factor analysis.
Social Awareness, Social Meaning, Social Reasoning, and Self-Control loaded on a second-order Social-Emotional Comprehension latent variable (CFI = .96, RMSEA = .044, 90% CI = [.035, .053]). The Social-Emotional Comprehension factor score from this analysis (“SE composite”) was computed as a weighted sum, with factor loadings as the weighting value. This score was used in criterion-related validity analyses. We opted to use SE composite as our overall indicator of social-emotional comprehension to reduce the number of analyses when evaluating criterion-related validity.
Criterion-related validity
To test criterion-related validity hypotheses, we ran two-level Hierarchical Linear Models (HLMs; Raudenbush, Bryk, & Congdon, 2004) evaluating the relationship between SE composite and criterion measures, controlling for age, sex, ethnicity, and raw IQ score. We used HLM to account for the nesting of students in classrooms. Findings are summarized in Table 4.
Criterion-Related Validity of Social-Emotional Comprehension.

Note. Coefficients are standardized. SSIS = Social Skills Improvement System rating scale; DESSA-Mini = Devereux Student Strengths Assessment–Short Form; SE Comprehension = social-emotional comprehension.
Study 1.
Study 2.
p < .10. *p < .05.
Convergent and discriminant validity
We hypothesized that Social Awareness, Social Meaning, Social Reasoning, and Self-Control latent variables, reflected in the final CFA above, would demonstrate convergent and discriminant validity. Structural equation modeling (SEM) was used to evaluate the extent to which latent variables from the four-factor model tested above, reflecting Social Awareness, Social Meaning, Social Reasoning, and Self-Control, created with SELweb scores, were each more related to parallel latent variables created with alternate assessments than they were related to other latent variables created with alternate assessments. For these analyses, the degrees of freedom in the models exceeded the number of clusters, precluding the use of MPlus complex samples (Muthén & Muthén, 2012). Instead, we used Amos (17.0.2; Arbuckle, 2008) and did not account for the nesting of students in classrooms.
Convergent and discriminant validity were tested in a series of SEM models. First, a model was constructed in which the four latent factors created from SELweb indicators were modeled as predictors of four parallel factors reflecting Social Awareness, Social Meaning, Social Reasoning, and Self-Control, created from alternative indicators. We refer to paths between factors representing the same construct with different indicators as “convergent” paths and paths between factors representing different constructs as “discriminant” paths.
The base model for all tests was an unconstrained model in which convergent and discriminant paths were modeled as free parameters. The fit of this model to the data was adequate (CFI = .90, RMSEA = .058, 90% CI = [.044, .072]). Inspection of the standardized convergent and discriminant path coefficients revealed that the convergent paths were in the expected direction and were larger in magnitude than the discriminant paths.
Next, convergent and discriminant validity were formally evaluated by comparing the base model with a series of nested models with equality constraints. To evaluate convergent validity, we compared the base model to four models, one for each of the four dimensions of social-emotional comprehension. In each model, one convergent path was constrained to zero. If the change in χ2 for each one degree of freedom change in the model was significant and indicated a worsening of model fit, we interpreted this as evidence of the convergent validity of the latent variable being tested. As shown in Table 5, removing the convergent paths for Social Meaning, Social Reasoning, and Self-Control each led to a significant decline in model fit. Eliminating the convergent path for Social Awareness did not significantly reduce model fit.
Model Fit for Tests of Convergent and Discriminant Validity.

p < .05.
To evaluate discriminant validity, we compared the base model to four models, one for each dimension of social-emotional comprehension. In each model, we constrained the three discriminant paths to zero. If the change in χ2 for each three degree of freedom change in the model was not significant, indicating no change in model fit, we interpreted this as evidence of discriminant validity. For each of the four dimensions of social-emotional comprehension, constraining the discriminant paths to zero led to no significant changes in model fit, as summarized in Table 5. The final model is presented in Figure 2.
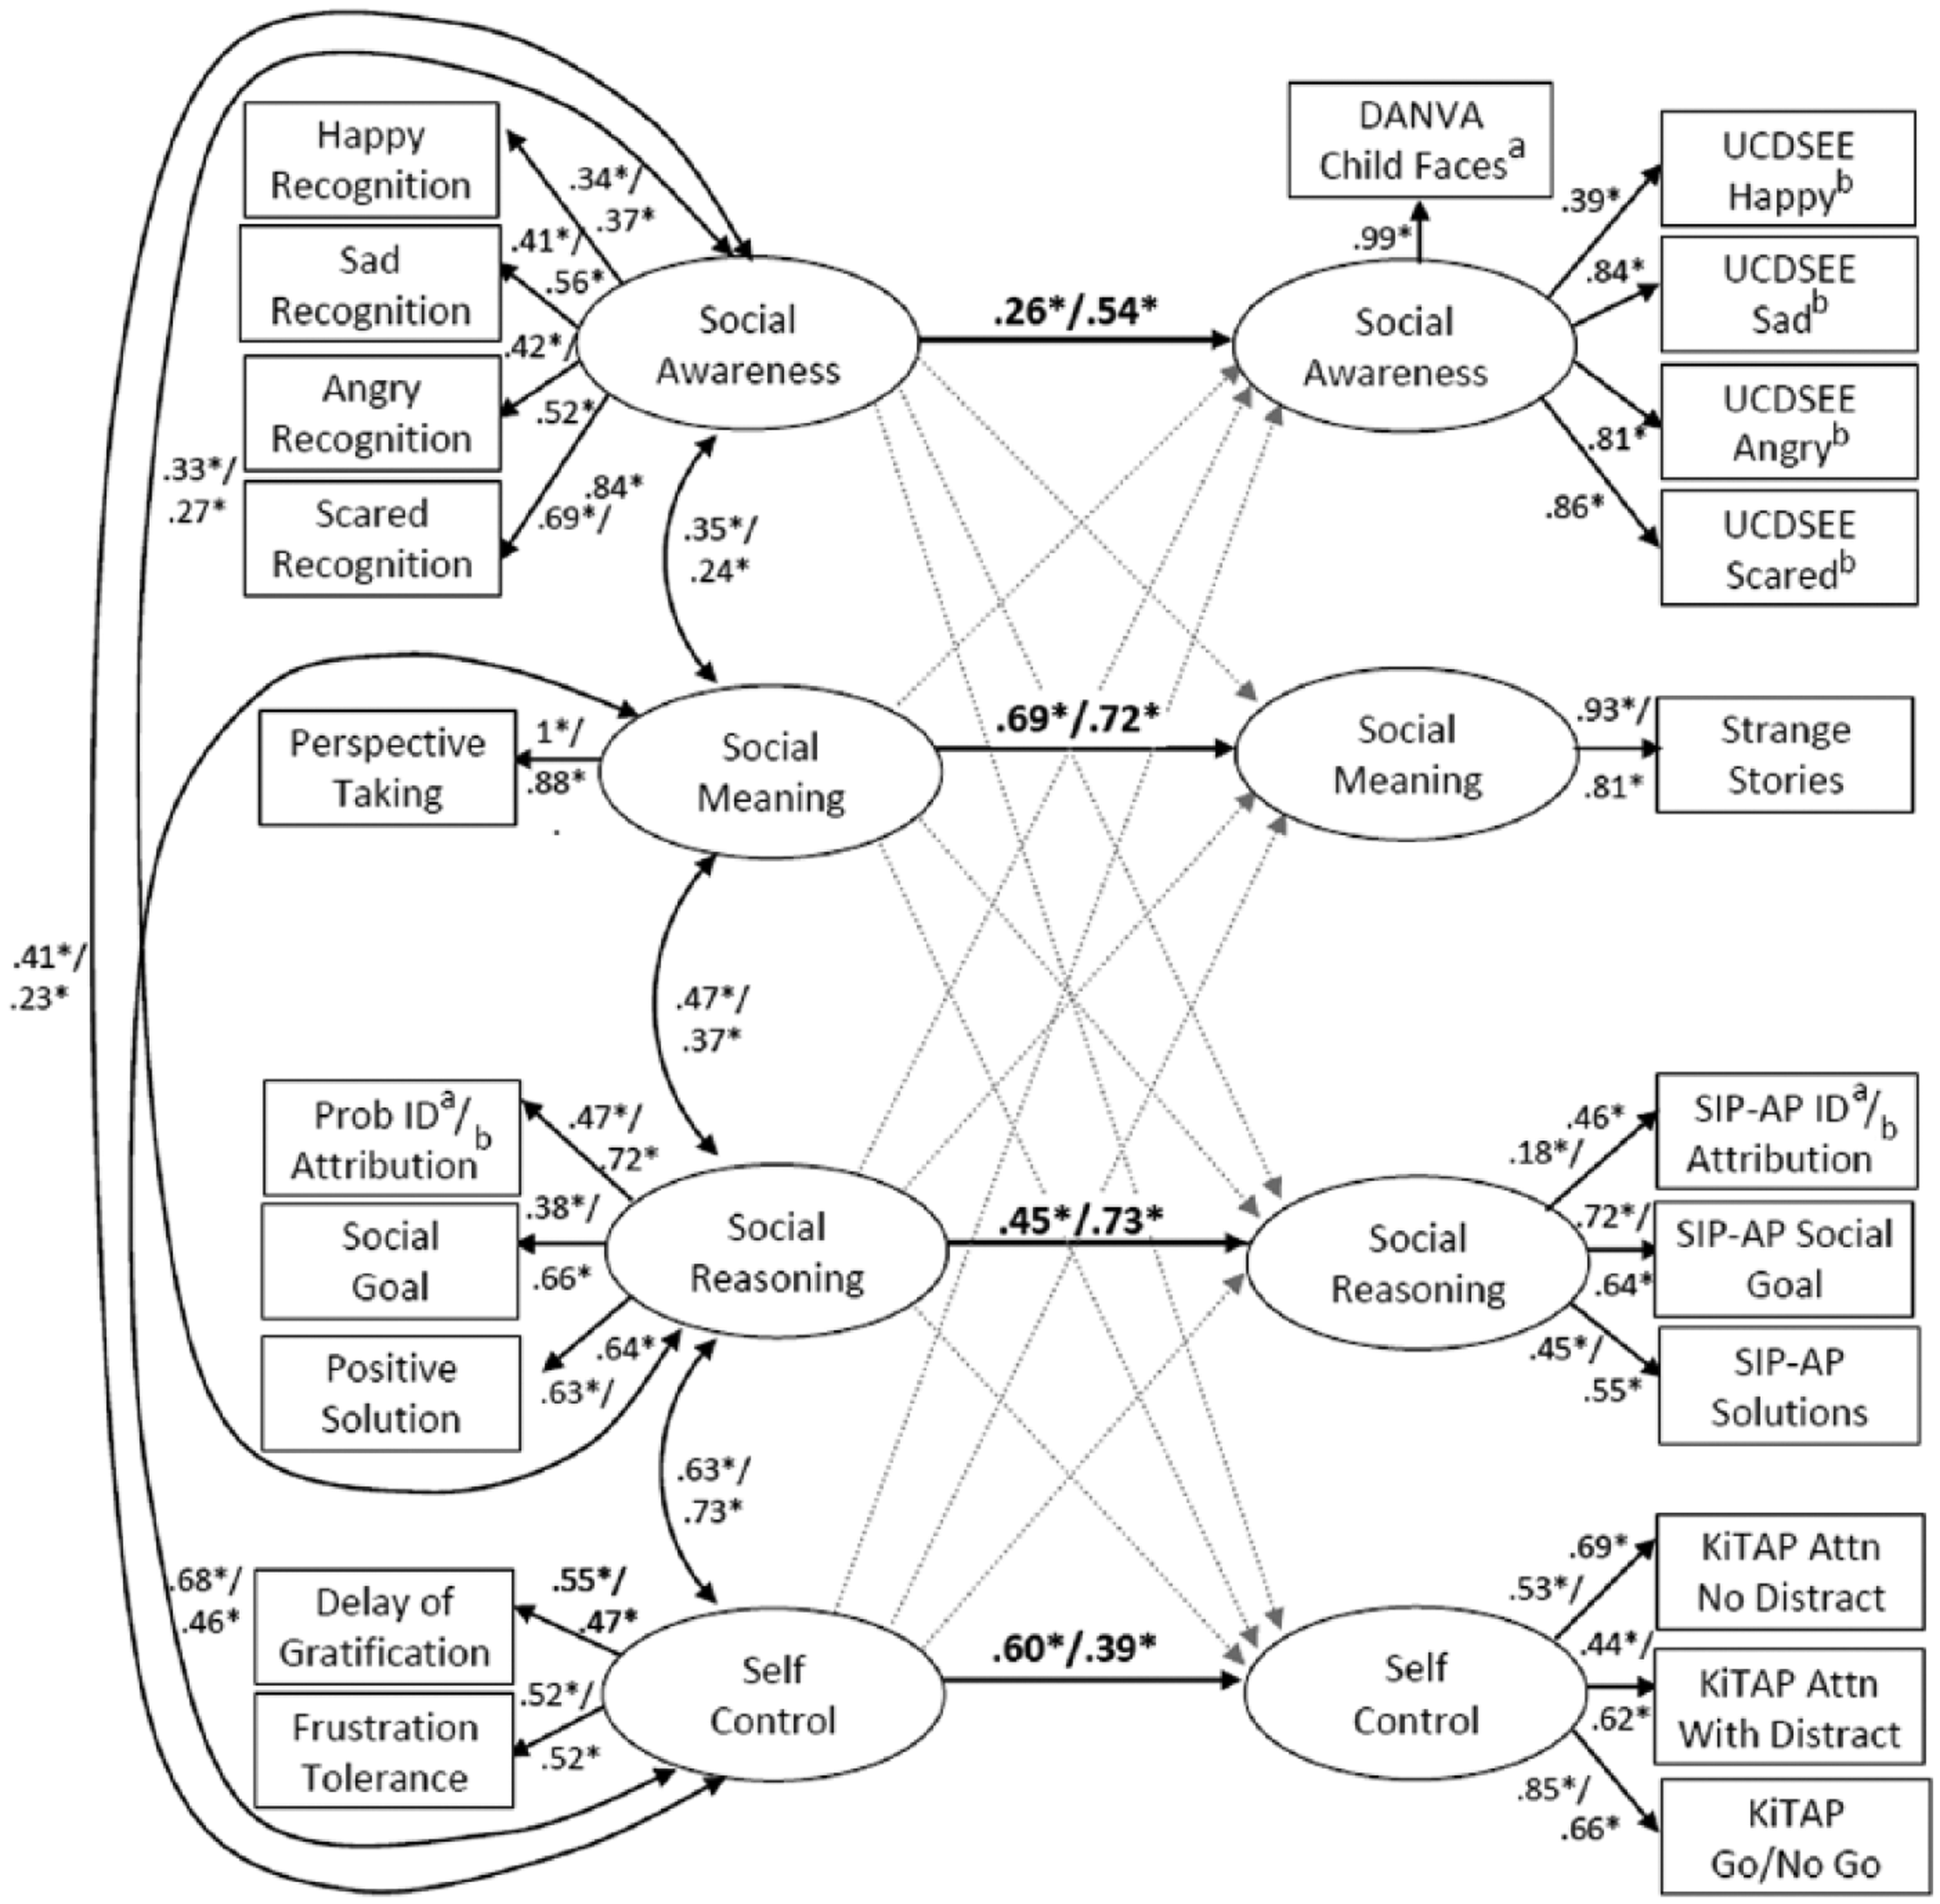
Convergent and discriminant validity.
Study 1 Discussion
As described in the general discussion, Study 1 findings largely supported study hypotheses. Findings also informed assessment revisions. First, to reduce test burden, we decreased the number of Social Awareness items and created four test forms. To do so, we ranked items by difficulty. Within each decile and emotion, an item was selected for a test form. Two items within each decile and emotion were common across at least two test forms. The resulting test forms each included 40 items, 10 of each emotion, varying by difficulty. For the Social Meaning module, 1 item exhibited a low item-total correlation. We revised the wording of response options for clarity. For the Social Reasoning module, the problem identification score yielded a low factor loading. For Study 2, instead of problem identification, we measured hostile attributions by asking after each vignette whether a character intended to be mean, and if so, whether the character was “a little mean” or “very mean.” In Study 1, for the social goal question, “How would you like it to turn out?” response variability was limited. Accordingly, we revised social goal response options to increase variability by adding a retribution goal (“Get them in trouble”). Revised scoring is presented in Table 2.
Study 2 Method
Recruitment
Participants were recruited during 2013-2014 from 17 schools in six urban and suburban school districts in two states. In all schools, school staff administered SELweb to students in kindergarten through third grade. In one district with three schools, parents of children in kindergarten through third grades were invited to have their children participate in an add-on study, as in Study 1. In that district, SELweb was also administered in fall and spring to estimate temporal stability. Mean time between administrations was 175 days (range = 171-186).
Procedures
Study 1 administration procedures were followed.
Measures: SELweb
We administered SELweb with revisions described previously.
Add-On Study Measures of Social-Emotional Comprehension
Except as noted next, we administered the same alternate measures of social-emotional comprehension. For Social Awareness, we used U.C. Davis Set of Emotion Expressions (Tracy & Robins, 2004). Children viewed photographs of people and indicated whether the emotion expressed in each photograph matched a target emotion. Eighteen photographs were presented in random order for each target emotion. Children received one point for correctly indicating whether a photograph reflected the target emotion. For the SIP-AP, the problem identification question was replaced with a hostile attribution question. Scores were keyed such that a higher score reflected more positive attribution. Neither the WISC-IV nor AIMSweb was administered.
Other Add-On Study Criterion Measures
Behavior
Teachers completed the Devereux Student Strengths Assessment–Short Form (DESSA-Mini; Naglieri, LeBuffe, & Shapiro, 2011), an eight-item questionnaire in which teachers rate the frequency of behaviors reflecting social-emotional learning (SEL) skills.
Peer acceptance
We used Study 1 procedures to measure peer acceptance.
Missing Data
SELweb
Of 3,223 children who participated, 3,033 children completed all SELweb measures (94.1%). Missing data were because of student absence during SELweb administration.
Study 2 Results
Reliability
Reliabilities were computed as described in the Study 1 Results. Score internal consistencies and 6-month measurement stabilities are summarized in Table 3.
Validity
Factor structure
Study 1 procedures were followed to test factor structure. The fit of one-, two-, and three-factor models was poor to marginal (one-factor CFI = .82, RMSEA = .100, 90% CI = [.100, .105]; two-factor CFI = .83, RMSEA = .100, 90% CI = [.094, .105]; three-factor CFI = .88, RMSEA = .084, 90% CI = [.079, .090]). The fit of a four-factor model was excellent (CFI = .96, RMSEA = .049, 90% CI = [.044, .055]; see Figure 1). That model was a significantly better fit to the data than the alternatives (all comparisons to the four-factor model, Δχ2/df > 160, p < .05). Using Study 1 procedures, we again created an SE composite.
Criterion-related validity
Two-level HLMs evaluated the relationship between SE composite and criterion measures, controlling for age, sex, and ethnicity. Results are in Table 4.
Convergent and discriminant validity
We used Study 1 procedures to test convergent and discriminant validity. As shown in Table 4, removing each convergent path led to a significant decline in model fit. In addition, for each latent variable, constraining discriminant paths to zero led to no significant changes in model fit. The final model is presented in Figure 2.
General Discussion
Findings generally supported our hypotheses: (a) Four of five composite score reliabilities were greater than or equal to .80 and 8 of 10 composite temporal stabilities were greater than or equal to .60; (b) assessments fit the hypothesized four-factor model; (c) except for Nonverbal Awareness in Study 1, all latent variables demonstrated convergent validity; (d) in both studies, all four latent variables demonstrated discriminant validity; and (e) performance on the assessments was positively associated with teacher report of social skills, social acceptance, and academic competence, and negatively associated with teacher report of problem behavior.
SELweb incorporated useful characteristics. First, SELweb modules assessed a theoretically based broad range of social-emotional learning skills appropriate for typically developing and atypical children in kindergarten to third grade. Next, SELweb was designed for ease of use, and in fact, school staff consistently reported that it was easy to use and that assessment findings were easy to interpret and helpful for instructional planning. Third, the system was designed and successfully deployed for group administration.
Limitations and Future Directions
Indicator scores exhibited internal consistencies below .70; most factor scores demonstrated reliability at or above .80. The usefulness and interpretability of factor scores is therefore greater than that of indicator scores. Similarly, 6-month stability estimates were variable, particularly among indicator scores. This may reflect low to moderate test–retest reliability or the malleability of the skills (Durlak et al., 2011; Nunnally & Bernstein, 1994) over 6 months.
It is important to note that validity evidence presented in this article pertain to the validity of SELweb factor scores, not necessarily the observed scores used to create them. Furthermore, some factor loadings were relatively low, so observed scores include variance not shared by the factor they represent. Thus, although factor scores demonstrated good evidence of validity, the validity of each test score is less clear. Because of this, and because individual test scores exhibited modest internal consistency reliability and temporal stability, from a practice perspective, it is therefore most prudent to interpret higher order SELweb summary scores.
In both studies, add-on study and temporal stability participants differed from the samples from which they were drawn. Because of this, the generalizability of findings from subsamples to the samples from which they were drawn is limited. Despite these differences, findings were similar across samples, lending greater confidence in study findings.
Reliabilities of some validation measures, particularly the SIP-AP scores, were quite low. Low reliability generally reduces power to detect associations. That we nevertheless found expected patterns of associations with these criterion measures despite their low reliability suggests that the findings are robust.
In both studies, the covariations between Social Meaning and Self-Control were very high. Recognizing this, we tested a three-factor model to the data, with Social Meaning and Self-Control scores loading onto one factor. The fit of the data to this model was equivalent to the four-factor solution. We opted to retain the four-factor solution for two reasons. First, Social Meaning is conceptually distinct from Self-Control. Second, whereas the four-factor solution demonstrated good evidence of convergent and discriminant validity, the three-factor solution did not. For conceptual and empirical reasons, therefore, we felt the four-factor solution yielded a more readily interpretable factor structure. Future research is needed to clarify the nature of the relationship between Social Meaning and Self-Control.
Conclusion
These findings support the psychometric strengths and potential usefulness of SELweb in applied settings. They also support and extend existing theories of social-emotional comprehension and related constructs (Crick & Dodge, 1994; Halberstadt et al., 2001; Lipton & Nowicki, 2009). As social-emotional learning standards and curricula become more widely adopted, SELweb may prove a useful tool for researchers and practitioners interested in measuring student skill acquisition.
Footnotes
Authors’ Note
The opinions expressed are those of the authors and do not represent views of the Institute of Education Sciences or the U.S. Department of Education.
Declaration of Conflicting Interests
The author(s) declared no potential conflicts of interest with respect to the research, authorship, and/or publication of this article.
Funding
The author(s) disclosed receipt of the following financial support for the research, authorship, and/or publication of this article: This research reported here was supported by Institute of Education Sciences through Grant R305A110143 to Rush University Medical Center.