
Abstract
General cognitive diagnostic models (CDM) such as the generalized deterministic input, noisy, “and” gate (G-DINA) model are flexible in that they allow for both compensatory and noncompensatory relationships among the subskills within the same test. Most of the previous CDM applications in the literature have been add-ons to simulation studies. Although there are some applications of CDMs such as the Fusion Model and the Rule Space Model to educational assessment data in general and second-language data in particular, there are few studies applying general models such as the G-DINA. The purpose of the present study was to demonstrate the application of the G-DINA to the reading comprehension data of a high-stakes test. To this end, an initial Q-matrix was developed, validated, and cross-validated. The skill profiles of the test takers were estimated using the “CDM” package in R. Throughout, the process of constructing and validating a Q-matrix was elaborated on, the benefits of general models were emphasized, and implications for research investigating inter-skill relationships were discussed. Finally, suggestions for further research, to better take advantage of the flexibilities of general diagnostic models, were presented.
Cognitive diagnostic models (CDMs) can maximize opportunities to learn by “pinpointing why students perform as they do” (Leighton & Gierl, 2007, p. 5). They decompose test tasks into strategies, processes, and knowledge required to perform successfully in each task, thereby help teachers to replace student’s faulty strategies (Embretson, 1983). Unlike conventional educational psychometric models such as item response theory (IRT), which are based on an investigator’s expectations of what cognitive processes test takers follow to solve problems in test-taking situations, CDMs are based on empirical evidence of the actual processes and strategies they follow in these situations. CDMs diagnose test takers’ competency along a set of multiple discrete/dichotomous skills. They predict probability of an observable categorical response from unobservable (i.e., latent) categorical variables. These discrete latent variables have been variously termed as skill, subskill, attribute, knowledge, ability, processes, and strategies. 1
Based on a comprehensive review of the literature, Rupp and Templin (2008) put forth a definition of CDMs which included the following defining characteristics: their multidimensionality, confirmatory nature, complex loading structure, and probabilistic nature. Just like factor analysis (FA) and IRT models, CDMs include multiple latent predictor variables. However, unlike conventional IRT and FA models, which assign to respondents a single score on a continuous scale representing a broadly defined ability, CDMs assign respondents to multidimensional skill profiles by classifying them as masters versus nonmasters of each skill involved in any given test. Moreover, CDMs are different from multidimensional IRT and FA models in that latent variables in CDMs are discrete or categorical (i.e., they indicate mastery/nonmastery), whereas ability estimates in multidimensional IRT models and factor scores in FA models are continuous. Because FA and IRT models typically operationalize broadly defined dimensions, they usually have a simple loading structure in the sense that each item loads on just one dimension. In contrast, in CDMs, where narrowly defined constructs are operationalized, each item typically requires multiple subskills leading to what is known as within-item multidimensionality (Adams, Wilson, & Wang, 1997; Baghaei, 2012). CDMs are also confirmatory in that the processes, strategies, or subskills required to perform successfully on items of any given test are specified in a Q-matrix (Tatsuoka, 1983) according to a substantive theory of a construct. Using an analogy from confirmatory factor analysis, a Q-matrix is the loading structure of a CDM wherein item-by-skill relationships are hypothesized. Then the theory-driven Q-matrix is tested against real data. CDMs are confirmatory in another sense which is rarely discussed. According to Rupp and Templin (2008), CDMs are also confirmatory in that how attributes interact in the response process should be specified a priori, that is, whether attributes combine in a compensatory or conjunctive relationship (see below for more explanation of the terms) to produce the correct answer should be specified in advance. The process of selecting the right model (i.e., either compensatory or conjunctive) should be informed by domain theories or extant literature. Finally, CDMs are probabilistic in two ways: They express (a) a given respondent’s performance level in terms of the probability of mastery of each one of the postulated attributes separately and (b) the probability of his or her having a specific skill mastery profile or belonging to each latent class. Take the present study, for example, where five subskills (k = 5) were postulated to underlie performance on the test under study. With five subskills, there are 25 = 32 skill mastery profiles 2 representing a latent class each. As the second row of Table 8 shows (see below), for Respondent 2, the chances are 43% and 16% that he belonged to the Latent classes 32 and 31, respectively The probabilities of belonging to the Latent Classes 11, 12, 15, 16, 25, 27, and 28 are about .03, .01, .08, .06, .08, .07, and .07, respectively, and 0 for the rest of the latent classes. Therefore, he is assigned to the latent class with the highest probability, that is, Latent Class 2. As Table 9 shows (see below), the probabilities that Respondent 14238, for example, with the skill profile of [01011] has mastered Attributes 1 to 5 are 0.58, 0.9, 0.74, 1.00, and .82, respectively.
Depending on whether CDMs specify inter-skill relationships a priori or not, they are classified into two groups: general and specific, as shown in Table 1. General CDMs allow for both compensatory and noncompensatory relationships within the same test. The strength of the general models is that they allow each item to pick the model that best fits it rather than to force-assign a single model to all the items. Specific CDMs, on the other hand, allow for either compensatory or non compensatory relationships in the same test. Most of the specific models are subsumed under the general models.
CDM Types.

In compensatory models, mastery of one or some of the attributes required to get an item right can compensate for nonmastery of the other attributes. On the contrary, in noncompensatory or conjunctive models, lack of mastery of one attribute cannot be completely compensated by other attributes in terms of item performance.
Review of the Literature
CDMs have been used in two ways: (a) retrofitting (post hoc analysis) of existing non-diagnostic tests to extract richer information and (b) designing a set of items or tasks from the beginning for diagnostic purposes. Most of the applications of CDMs in educational measurement in general and language testing in particular are cases of retrospective specification (post hoc analysis) of the knowledge and skills evaluated by existing non-diagnostic tests. CDM studies in the literature have focused mostly on psychometric modeling rather than the actual application of CDMs. Most of the few applications have involved math data and been add-ons to simulation studies (e.g., J. Chen & de la Torre, 2013; J. Chen, de la Torre, & Zhang, 2013; Cui, Gierl, & Chang, 2012; de la Torre, 2009; de la Torre & Douglas, 2004; Henson, Templin, & Willse, 2009; Hou, de la Torre, & Nandakumar, 2014; Templin & Bradshaw, 2013; von Davier, 2014). Henson (2009) argues,
Although this direction was necessary as a first step toward establishing a very basic set of statistical principles, the growing emphasis of the methodology for diagnostic classification models (DCMs) is now on providing evidence that these models, in application, can provide the information that has been promised. (p. 34)
Most of the applications of CDMs in educational assessment in general and language assessment in particular have involved the Rule Space Model (e.g., Buck & Tatsuoka, 1998; Buck, Tatsuoka, & Kostin, 1997; Buck, VanEssen, Tatsuoka, Kostin, Lutz, & Phelps, 1998; Kasai, 1997; Kasai & Saito, 1996; Scott, 1998) and the Fusion Model (e.g., Jang, 2009; A. Y. A. Kim, 2015; Y. H. Kim, 2011; Li, 2011; Li & Suen, 2013; Sawaki, Kim, & Gentile, 2009). However, other models have also been applied. von Davier (2005) applied the general diagnostic model (GDM) to the reading and listening sections of Test of English as a Foreign Language (TOEFL). Ravand, Barati, and Widhiarso (2012) applied the DINA model to second language (L2) reading data.
However, as DiBello, Roussos, and Stout (2007) note, both compensatory and noncompensatory models assumed by specific CDMs make simplifying assumptions about the relationships between attribute mastery and response probability. They further argue,
These types of [simplifying] assumptions reduce the number of item parameters to be estimated, thus reducing standard errors of estimation . . . this can be especially useful when the total number of items measuring a given attribute is small or if the number of examinees in the sample is small. But these kinds of parameter reduction may also introduce unwanted bias if the assumptions are not warranted. (DiBello et al., 2007, p. 985)
According to de la Torre and Lee (2013), employing general models is helpful in that “(a) CDMs need not be specified a priori, and (b) multiple, statistically determined CDMs can be used within a single assessment” (p.370).
There are few studies investigating the application of the general CDMs. von Davier (2005) applied the GDM to L2 data. Templin and Hoffman (2013) demonstrated the application of the log-linear CDM (LCDM) to the grammar section of the TOEFL. To the best knowledge of the author, few, if any, studies have demonstrated the application of the G-DINA. An advantage of the G-DINA is that, unlike GDM and LCDM, which are conducted with restricted research license and commercial software programs, respectively, G-DINA can be conducted through the free software program R and the Ox (Doornik, 2007) code prepared by de la Torre, available by contacting Jimmy de la Torre at
Therefore, the present study intends to demonstrate the application of the G-DINA to a high-stakes reading comprehension test. Throughout, the flexibilities of the model are demonstrated and focused upon, and the outputs are interpreted and issues related to the application of the model are discussed. Specifically, how the G-DINA can be used to inform inter-skill relationships in reading comprehension is discussed.
G-DINA Model
The G-DINA was proposed by de la Torre (2011), as a generalization of the DINA model. The DINA model is a noncompensatory model, which classifies test takers into two groups for each item: Those who have mastered all the subskills required by the item j (ξ ij = 1) and those who have not mastered at least one of the required attributes (ξ ij = 0). According to the DINA model, “lacking one required attribute for an item is the same as lacking all the required attributes for the item” (de la Torre, 2011, p. 179). de la Torre (2011) argues that this assumption might not hold for the group ξ ij = 0. Unlike the DINA model, the G-DINA does not assume equal probability of success for all those who have not mastered any, some, or all of the required attributes for an item.
The modeling approach adopted by the G-DINA is the same as ANOVA. In this model a set of main and interaction effects are used. Specific CDMs are derived from the G-DINA by removing the main and/or interaction effects. The probability in a G-DINA model that student i gets item j correct which requires two attributes
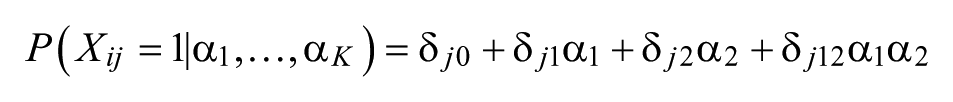
The parameter
Method
Data
The test analyzed in this study is the reading comprehension section of the Iranian National University Entrance Examination (INUEE), a four-option multiple-choice high-stakes test held annually to admit candidates to master’s programs in English studies. The test is an advanced assessment designed for candidates holding a bachelor’s degree who seek to pursue their studies for a master’s degree in state universities. The test is composed of two sections of content knowledge and general English (GE). The GE section is of four sections of grammar (10 items), vocabulary (20 items), cloze (10 items), and reading comprehension (20 items). The candidates are supposed to answer the test in 60 min. The 20 reading comprehension items and a sample of 10,000 candidates (69 % females and 31 % males) who took the test in 2012 were selected for this study. The participants mostly aged between 22 and 25 years.
For the purpose of the present study, the item response data were randomly divided into two groups: calibration group and validation group (terms borrowed form multigroup FA). First, the adequacy of the initially specified subskills was explored using the calibration sample; then, the final set of subskills was validated with the validation sample.
Q-Matrix Construction
Quality of a diagnostic assessment is affected by how correctly the subskills underlying performance on the item of any given test have been specified. To define attributes involved in a test, various sources such as test specifications, content domain theories, analysis of item content, think-aloud protocol analysis of examinees’ test-taking process, and the results obtained by the relevant research in the literature can be sought (Embretson, 1991; Leighton & Gierl, 2007; Leighton, Gierl, & Hunka, 2004). According to Lee and Sawaki (2009a), in CDMs retrofitted to existing non-diagnostic tests, where a detailed cognitive model of task performance is not available, “brainstorming about possible attributes that elaborate on an existing test specification might serve as a good point of departure” (p. 176). Because the test employed in the present study had not been developed for diagnostic purposes, the author took the following steps to ensure, as much as possible, that the subskills identified were valid: (a) The author invited two university instructors to brainstorm on the possible attributes measured by the test, (b) three other university instructors and three master students were invited to independently specify the attributes measured by each item, (c) the Q-matrix was empirically validated and revised, and (d) the final Q-matrix was cross-validated with the other half of the sample (i.e., validation group). Each one of the steps is explained in detail below.
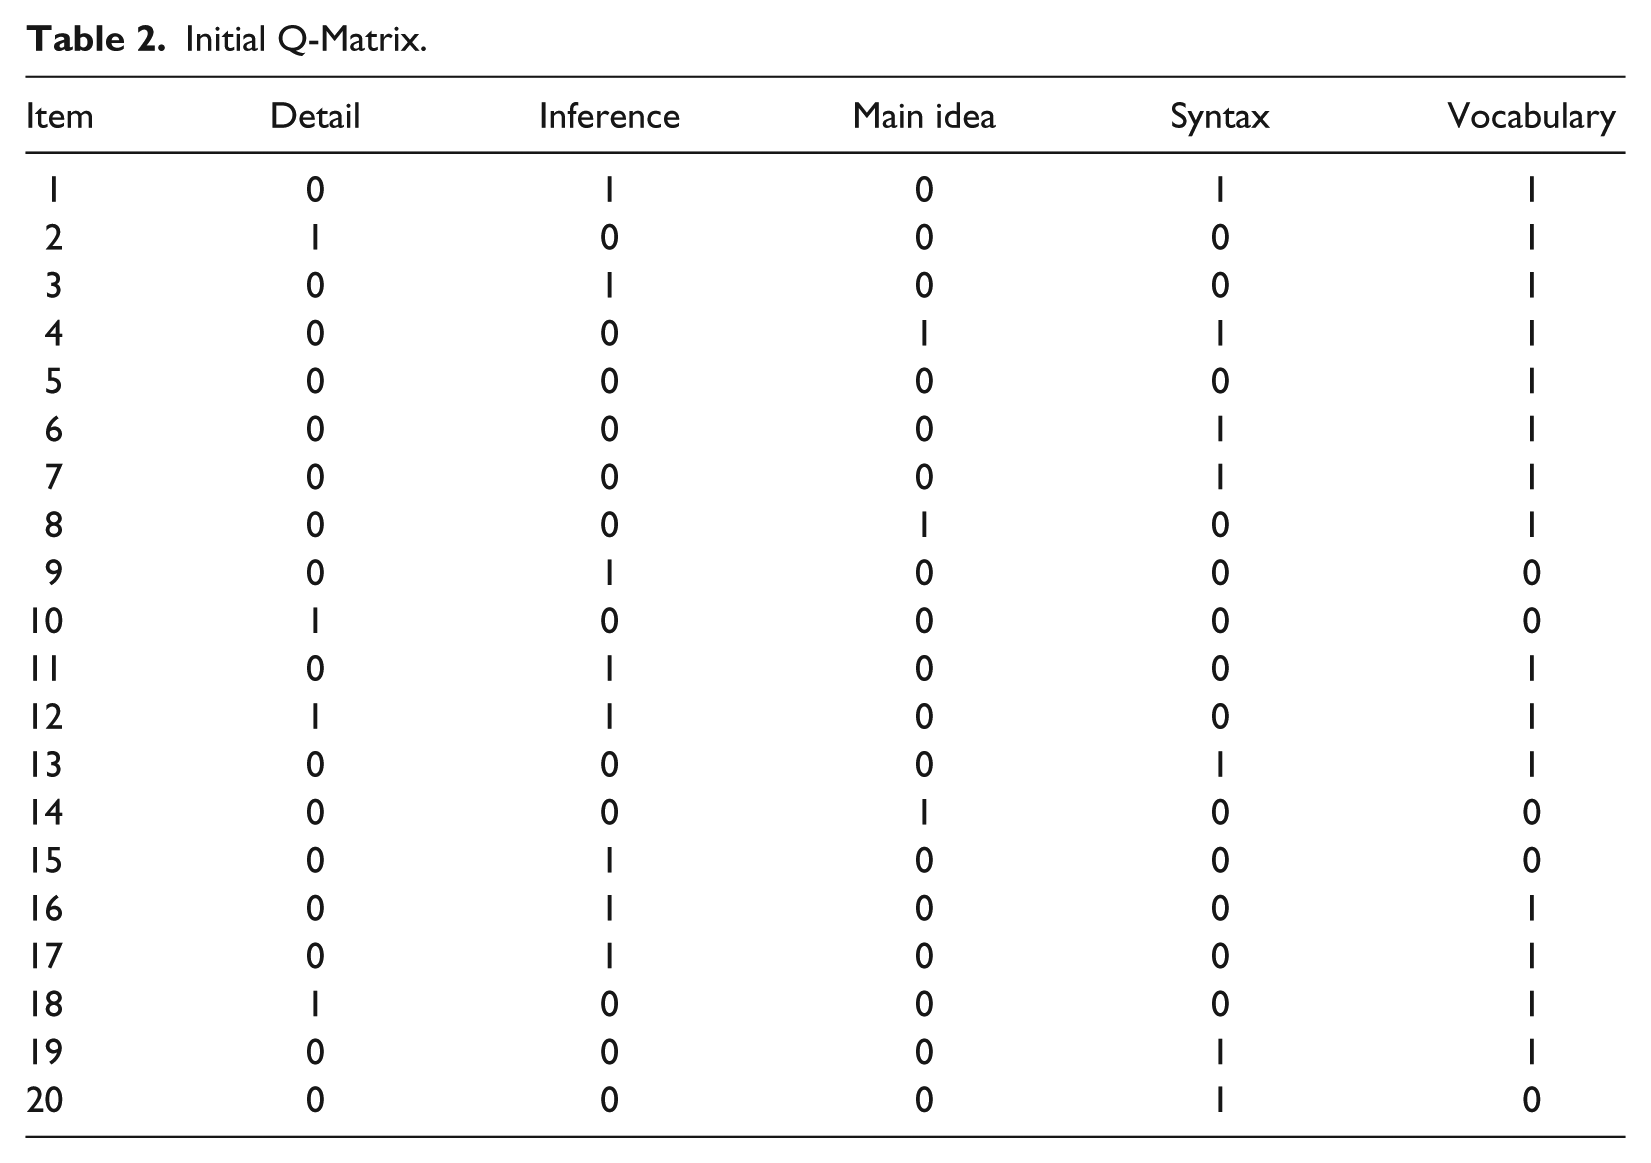
The author invited three university instructors, who had been teaching reading comprehension at BA level to English majors for at least 10 years, to identify the possible attributes measured by the test. They specified a set of five attributes: reading for details, reading for inference, reading for main idea (henceforth referred to as Detail, Inference, and Main idea), Syntax, and Vocabulary. Three other university instructors holding PhDs with more than 5 years of teaching reading comprehension experience and three master’s students studying English Language Teaching, who had taken the same test a year before to enter the master’s program, were invited to independently specify the attributes measured by each of the 20 reading comprehension items. They were trained for a session on how to code the attributes measured by each item. Then they read the passages and coded the items for the major attributes they utilized to respond to each item, independently. An initial Q-matrix (Tatsuoka, 1985) was developed. Attributes on which at least two thirds (i.e., four) of the coders agreed were included into the Q-matrix. A Fleiss Kappa agreement rate of .59 indicated a moderate agreement among the coders (Landis & Koch, 1977).
The disagreements mostly concerned whether, in addition to attributes such as Detail, Main idea, and Inference, Vocabulary and Syntax were also required for correctly answering some of the items. The reading passages were relatively long with a lot of difficult words and in some cases, complicated sentences, and the student judges perceived them very difficult. The author decided to resolve the disagreements in favor of the students’ codings for three reasons: (a) Student judges had the experience of taking the same test in a high-stakes context; it was thought their coding were more indicative of the real processes involved in reading comprehension hence more reliable; (b) as noted by Leighton and Gierl (2007), expert judges’ ability is usually well above that of the students and the students do not necessarily follow the same processes as specified by expert judges; and (c) the follow-up empirical validation of the Q-matrix would indicate whether the skill was consequential for correctly answering the item or not.
The “initial” Q-matrix is presented in Table 2. In this table, 1s indicate that the item requires the attribute whereas 0s indicate that the item does not require the attribute.
Initial Q-Matrix.
In the next step, the Q-matrix was empirically validated with half of the data (i.e., calibration sample). The adequacy of the Q-matrix was explored through the procedure suggested by de la Torre and Chiu (2010) using a code written in Ox (Doornik, 2007).
Q-Matrix Revision
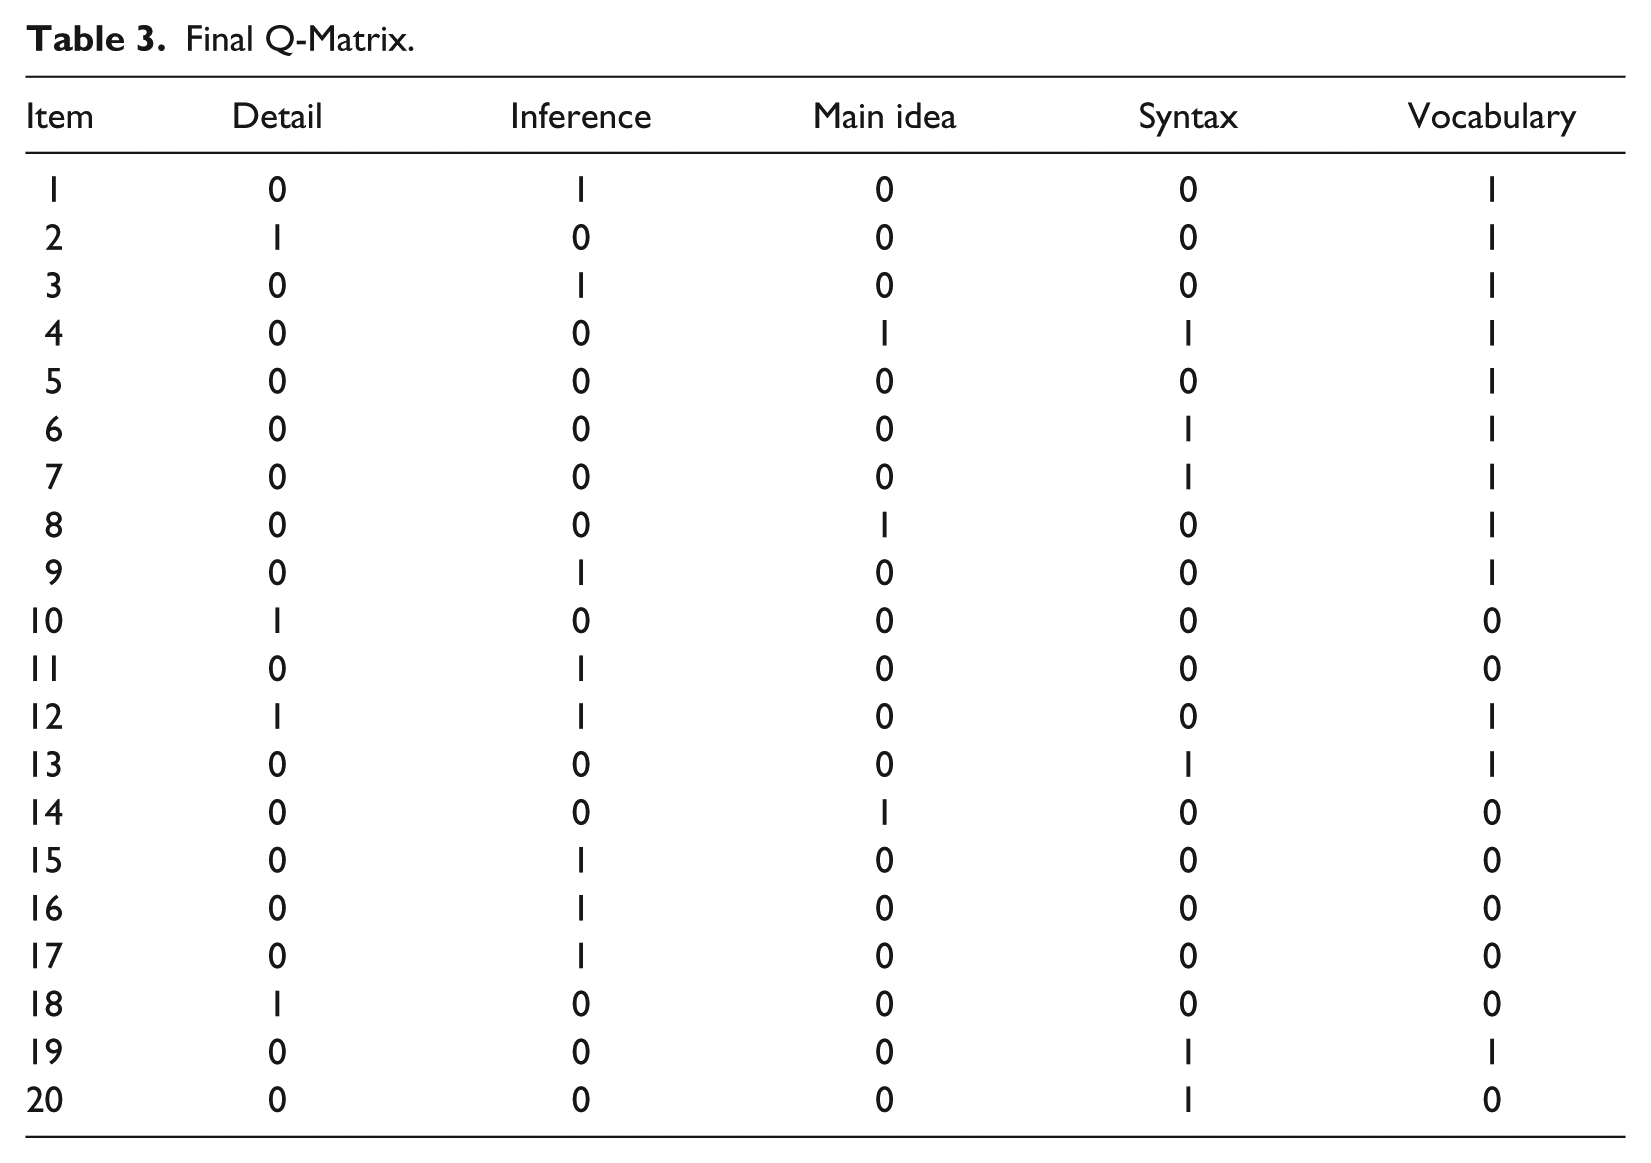
In the first run of the Ox, the following suggestions for the Q-matrix revision were provided: For Item 2, it was suggested that Detail, specified by judges as one of the requirements of the item, be removed from the Q-matrix. Had the attribute been removed, the only attribute remaining in the Q-matrix for Item 2 was Vocabulary. Believing that statistical analysis cannot be the only driving force for Q-matrix revision, both the author and the judges further inspected the content of the item. Therefore, the student and instructor judges and the author unanimously agreed that Detail was required for the item, hence kept in the Q-matrix. For Items 9 and 16, addition of Vocabulary was suggested. Inversely, for Items 11, 16, 17, and 18 for which initially both Detail and Vocabulary were specified, the suggestion was to remove Vocabulary from the Q-matrix. I did accordingly and rerun the Ox.
After several rounds of revisions and rerunning the Ox, I came up with the Q-matrix presented in Table 3. Four items were affiliated with Attribute 1 (Detail), eight items with Attribute 2 (Inference), three items with Attribute 3 (Main idea), six items with Attribute 4 (Syntax), and finally, 12 items were associated with Attribute 5 (Vocabulary).
Final Q-Matrix.
Purely relying on the items and the data to come up with the final Q-matrix is like an exploratory study that might capitalize on chances: It is almost always possible to come up with a set of subskills that fit the data. To ensure that the subskills are still meaningful in other contexts, I used the second half of the sample (i.e., validation sample) to explore meaningfulness of the Q-matrix. In the first run with the “initial” Q-matrix, the suggestions for revision were exactly the same as the ones suggested in the first run with the calibration sample. Therefore, in the next run, the “final” Q-matrix, obtained in the last run of the Ox with the calibration sample, was used. The suggestions were exactly the same as the ones suggested by Ox in the last run with the calibration sample. The conclusion was that the Q-matrix also held for the second half of the sample.
Model Fit
As with any statistical model, the results of a CDM are meaningless if the model fit the data poorly. Fit of a model can be ascertained in two ways: checking fit of the model to the data (i.e., absolute fit) and comparing the model with other rival models (i.e., relative fit). For the purpose of the present study, the absolute fit of the G-DINA was evaluated by comparing the observed and model-predicted statistics and inspecting the classification consistency and accuracy of the model.
The following fit indices were inspected to check the fit of the model:
Mx2 (W. H. Chen & Thissen, 1997) which is the test of global model fit, which uses test statistics of all item pairs. It is the mean difference between the model-predicted and observed response frequencies. Large differences are taken as evidence that there are dependencies between the items. Because respondents draw upon the same cognitive processes to respond to the items, dependencies are expected. But if CDM fits the data well, “the x 2 test statistic is expected to be 0 within each latent class as the attribute profile of the respondents would perfectly predict the observed response patterns” (Rupp, Templin, & Henson, 2010, p. 269).
The mean absolute difference for the item-pair correlations (MADcor) statistic (DiBello et al., 2007). It is the difference between the observed and the model-predicted item correlations.
Mean residual covariance (MADRESIDCOV). MADRESIDCOV (McDonald & Mok, 1995) is the mean difference between matrices of observed and reproduced item correlations.
Q3 (MADQ3) statistic (Yen, 1984). MADQ3 is calculated by subtracting the model-predicted from the observed responses of the respondents and computing the average of the pairwise correlation of these residuals.
The average root mean square error (RMSEA) for the item parameters.
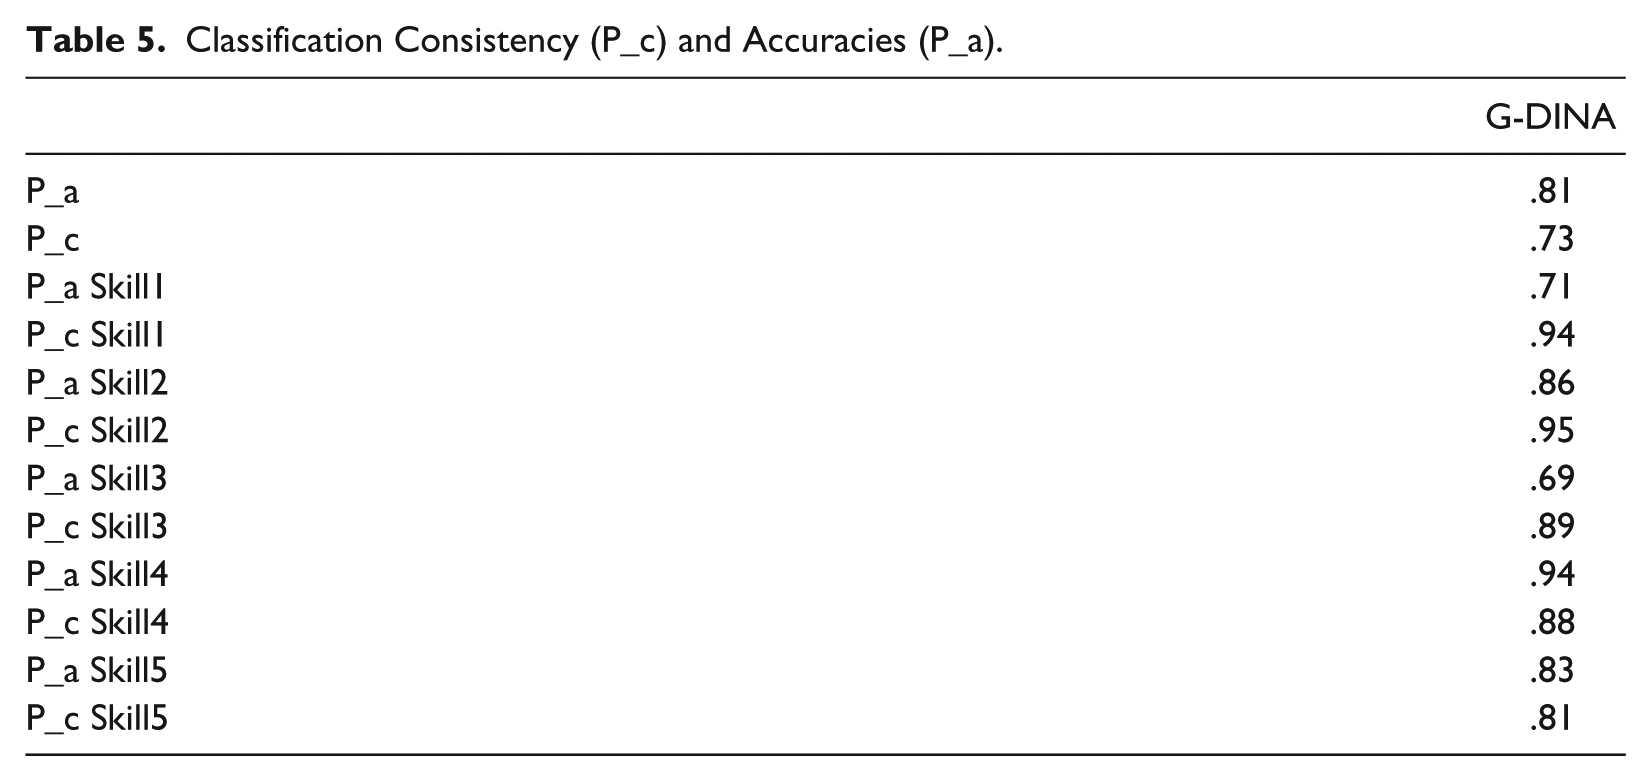
Classification consistency (P c ) and accuracy (P a ) (Cui et al., 2012). P c and P a refer to the reliability and validity of the examinees’ classification into the latent classes or master/nonmaster of each separate skill. P c is an indicator of the degree to which an examinee is consistently classified into the same latent class or will be indicated as master/nonmaster of the same attribute on re-administration of the same or a parallel form of the test while P a refers to the degree to which an examinee’s classification matches his true latent class or he is truly identified as master/nonmaster of any given attribute.
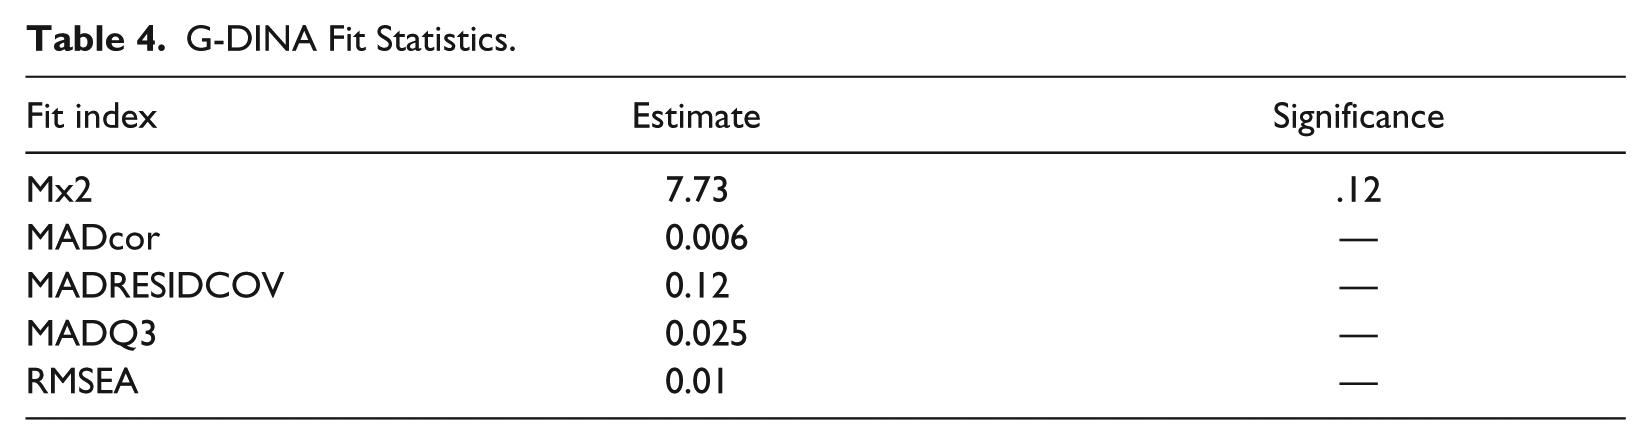
As Table 4 shows, the “CDM” package provides a test of significance for Mx2. A nonsignificant value (p > 0) indicates good fit. The value of Mx2 in the present study was 7.73, which is not significant (p = .12). There are no hard-and-fast rules as to most of the other model fit indices, which are based on observed and model-predicted statistics. For all these indices, the closer the value to zero, the better the model fits. The MADcor in the present study was 0.006. DiBello et al. (2007) considered a MADcor of 0.049 in Jang (2005) and Roussos et al. (Roussos, DiBello, Henson, Jang, & Templin, 2006; Roussos, DiBello, & Stout, 2006) as suggesting a good fit of the CDM to the data. For MADRESIDCOV, MADQ3, and RMSEA, values of below .05 show good fit. Except for the MADRESIDCOV value, which was .12, the other indices were well below .05, indicating good fit of the G-DINA to the data.
G-DINA Fit Statistics.
As the first row of Table 5 shows, the P a and P c values for the whole latent class pattern in the present study were .81 and .73, respectively. The other rows of Table 5 display the degree to which the test takers were consistently and accurately classified as masters and nonmasters of each separate skill. The values for all the skills were relatively high. There are no clear-cut criteria for P a and P c values. C. Ying (personal communication, November 12, 2013) suggested a value of .7 or .8 for the P a and P c as acceptable classification rates. In the light of the results obtained by Cui et al. (2012), .68 and .52 for P a and P c , respectively, for the fraction subtraction data (Tatsuoka, 2002), and also considering Ying’s suggestion, reliability and validity of the classifications in the present study are acceptable.
Classification Consistency (P_c) and Accuracies (P_a).
Data Analysis
Data were analyzed using R, “CDM” package Version 3.4-4 (Robitzsch, Kiefer, George, & Uenlue, 2014). The “CDM” package employs Marginal maximum likelihood using the Expectation-Maximization algorithm to do the estimations. The results showed that Syntax, mastered by about 73% of the test takers, was the easiest attribute followed by Vocabulary, Detail, Main Idea, and Inference mastered by 64%, 60%, 54% and 50% of the test takers, respectively. As it was explained above, CDMs group test takers into 2 K latent classes. In the present study, as Table 6 shows, test takers were classified into 25 = 32 latent classes. For space considerations, data for only the first and last three latent classes are presented in the table. The second column of the table shows the possible attribute profiles for the latent classes.
Class Probabilities.

As the third column of Table 6 reads, the attribute profile of α32 = [11111] had the highest class probability. Approximately 37% of the respondents (as shown in the last column, about 8073 respondents) in the present study were classified as belonging to this last latent class hence expected to have mastered all of the five attributes. Skill profile of α1 = [00000] had the second highest class probability of about .15 indicating that approximately 15% (about 3223 respondents) of the test takers were expected to have mastered none of the attributes.
To save space, the G-DINA parameter estimates for only the first two items of the reading comprehension test are displayed in Table 7. The second column represents the attributes required by any item, the third column displays the skill mastery patterns, and the fourth column represents the probability of success on each item due to mastery of the attributes required by any item on the test. The number of parameters estimated for each item is a function of the number of attributes required by that item. Because G-DINA is a saturated CDM, all the main effects for the attributes and their possible interactions are estimated. For example, for Items 1, 2, 3, 6, 7, 8, 9, 13, and 19, which required two attributes, four parameters were estimated each: one intercept, two main effects for the attributes, and one interaction effect. For Items 4 and 12, which required three attributes, eight parameters were estimated each: one intercept, three main effects, and four interaction effects. The intercept parameters show the probability of answering each item correctly when none of the attributes required by the item has been mastered. The main effects show the increase in the probability of correctly answering each item when any of the attributes has been mastered and the interaction effects show the increase in the probability when a combination of the attributes has been mastered.
G-DINA Parameters.
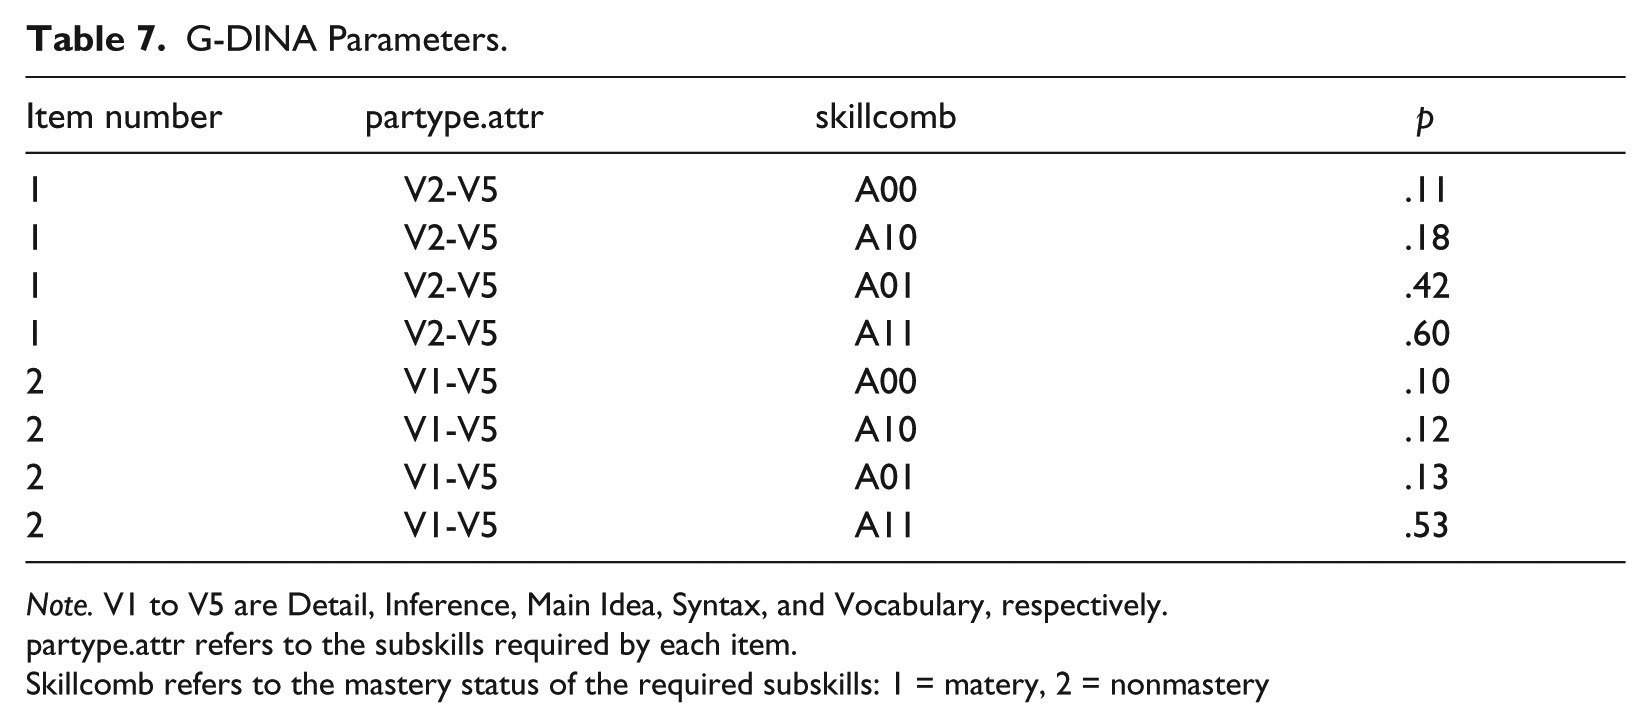
Note. V1 to V5 are Detail, Inference, Main Idea, Syntax, and Vocabulary, respectively.
partype.attr refers to the subskills required by each item.
Skillcomb refers to the mastery status of the required subskills: 1 = matery, 2 = nonmastery
As Table 7 shows, those who had not mastered any of the attributes required by Item 1, namely Inference and Vocabulary, had about 11% chance of guessing and getting the item right. Chances of success on Item 1 for those who had mastered only Inference were 18% higher compared with those who had not mastered any of the attributes. Therefore, masters of Inference had .11 + .18 = .29 probability of not slipping (success) on the item. Mastery of Vocabulary increased success on the item more than mastery of the Inference, indicating that Vocabulary discriminated more between its masters and nonmasters. Therefore, masters of vocabulary had .11 + .42 = .53 chance of getting the item right. Interaction of (mastery of both) Inference and Vocabulary added 60% to the probability of success on the item: For masters of both attributes, the probability of getting the item right was .11 + .60 = .71. A point worthy of note is that the probabilities for any given item should not add up to one because they are conditional probabilities.
Table 8 displays the probabilities that each person belonged to each one of the 32 latent classes for five respondents. In the table, values for each respondent with the given response pattern represent the posterior probability that he belongs to latent class c with the given skill profile. For example, for Respondent 2, the chances are 43% and 16% that he belonged to Latent classes 32 and 31, respectively. Put another way, there is 43% chance that he has mastered all the five attributes and 16% chance of having mastered Attributes of Inference, Main idea, Syntax, and Vocabulary.
Class Probabilities for Respondents.

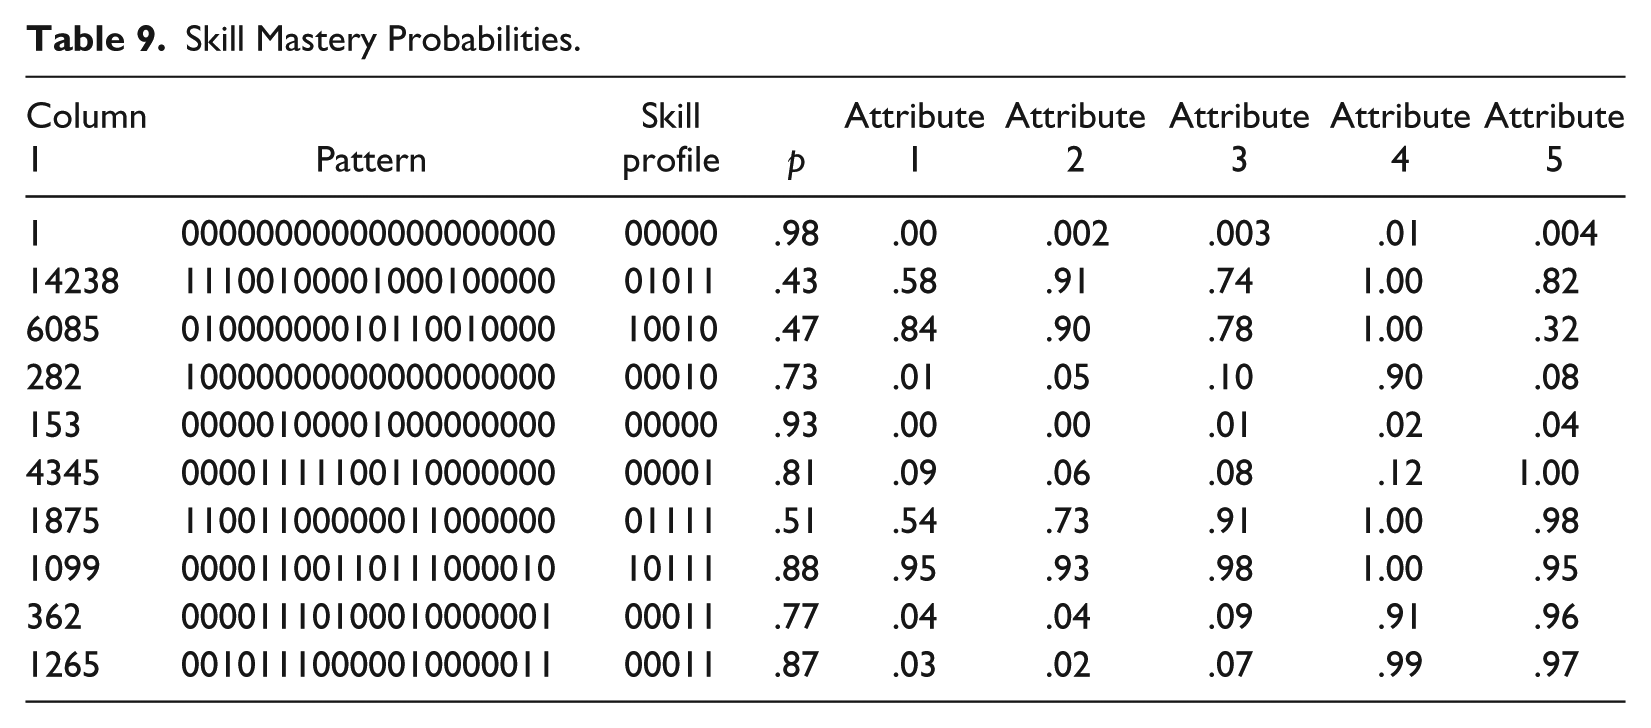
“CDM” Package also generates probability that each test taker has mastered any of the subskills involved in answering the items of any given test. To save space, only a slice of the output is presented in Table 9. It shows the probability that each respondent with the given ID, response pattern, and skill profile has mastered Attributes 1 to 5. As the table shows, the probabilities that Respondent 14238 with the skill profile of [01011] has mastered Attributes 1 to 5 are .58, .9, .74, 1.00, and .82, respectively.
Skill Mastery Probabilities.
As it was argued before, general models allow for different CDMs across the items on the same test. Recently, de la Torre and Lee (2013) used the Wald test to objectively choose the best-fitting model for each multi-attribute item. Specifically, the function developed by de la Torre and Lee evaluated the fit of the G-DINA, at item level, against that of the DINA, deterministic-input, noisy-or-gate (DINO), and additive CDM (ACDM). The results of the Wald test, using Ox, showed that from among the 11 items which required more than one subskills, DINO fit Items 6,7, 13, and 19, ACDM fit Items 1, 3, and 9, DINA fit Items 2 and 8 and for the other three multi-attribute items the G-DINA fit.
Discussion
The present study demonstrated the application of the G-DINA to the reading comprehension data of a high-stakes reading comprehension test. The results of the study showed that the two “flat” skill mastery profiles, namely “nonmaster of all skills” α1 = [00000] and “master of all skills” α32 = [11111], were the most prevalent skill profiles. This finding is in line with other CDM studies (e.g., Lee & Sawaki, 2009b; Li, 2011; Ravand et al., 2012). Prevalence of the flat skill profiles can be due to high positive correlations among the attributes (Rupp et al., 2010) or unidimensionality of the measure used, where a master of one skill tends to be a master of another skill, or vice versa (Lee & Sawaki, 2009b). High tetrachoric correlations between the attributes were observed in the present study. Except for the correlations between Vocabulary and the other four subskills, the other correlations ranged from .78 to .95. Correlations between Vocabulary and the other attributes ranged from .38 to 61.
As it was explained above, general CDMs such as G-DINA allow for checking model fit at two levels: macro or test level and micro or item level. At macro level when the G-DINA fits, the problem of model selection is solved. At this level when the G-DINA fits the data, the implication is that at least for some items the relationships between the subskills is compensatory, for some others it is noncompensatory, and still for some others the relationships are not yet known. For these items, the G-DINA fits.
At item level, specific CDMs such DINA, DINO, ACDM, and NC-RUM are more interpretable in terms of the relationships among the attributes, whereas general models are hard to interpret (Rojas, de la Torre, & Olea, 2012). The implication is that at test level, general models are more favored, but at item level specific models are to be preferred. At test level, general models do not see the relationships among the attributes in a test through the limited lens of any specific CDM and allow for multiple CDMs for different items within the same test. In other words, general CDMs allow the researcher to hypothesize varying relationships among the attributes across the items. It is more viable to hypothesize that this relationship might change depending on the difficulty of the attributes, the area of language tapped by the items, the cognitive load of the attributes (e.g., whether they tap higher or lower order thinking), and so on, rather than to assume the same relationship (either compensatory or noncompensatory) across all items of a test.
The results of item-level model selection showed that for some items which required more than one skill, variously the DINO, DINA, ACDM, and G-DINA held: DINO fit Items 6, 7, 13, and 19, ACDM fit Items 1, 3, and 9, DINA fit Items 2 and 8 and for the other three multi-attribute items G-DINA fit. The interpretation of the relationships among the attributes for items such as Item 4, for which the G-DINA fit, is difficult. However, using the G-DINA can open up new avenues of research regarding inter-skill relationships at item level. Items such as the ones for which the G-DINA fit can “direct a researcher’s attention to those problems where cognition may not be well understood” (Henson et al., 2009, p. 208).
As the results of the present study showed, Syntax was the easiest and Inference was the most difficult attribute. The second most difficult attribute was Main Idea, followed by Detail and Vocab. This hierarchy of difficulty of the L2 reading attributes concurs with the previous research (Grabe & Stoller, 2002; Lumley, 1993). The findings are in line with those of Baghaei and Ravand (2015) who apply the linear logistic test model (Fischer, 1973; see also Baghaei & Kubinger, 2015) to these data. Harding, Alderson, and Brunfaut (2015) argued that “it is probably reasonable to accept that both first language and L2 reading involve a number of different ‘levels’ of ability” (p. 4). According to Haring et al., syntax and vocabulary are lower level attributes and understanding main idea, making inferences, and understanding specific details are higher level L2 reading processes. Understanding the main idea of a reading passage involves knowledge of vocabulary, grammar, discourse, and employing different cognitive processes (Pressley, 2002). In a similar vein, inferencing is a complex attribute hence difficult to master (Long, Seely, Oppy, & Golding, 1996). Inferencing involves understanding both the literal and implied meanings of a text. Both Main Idea and Inferencing were identified as the most difficult subskills because they involved higher level processing of the information in the passages (Grabe, 2009).
Finally, the G-DINA can also provide insights as to some misspecifications in the Q-matrix. According to the attribute plot for Item 4 (shown in Figure 1), the main effect for the second attribute required for Item 4 (Syntax), the two- and three-way interactions of this attribute with the other attributes were all close to the intercept value; the increase in the probability of correct answer due to the mastery of Syntax was nearly zero. The two-way interaction of Syntax with Detail and Vocabulary also added relatively nothing to the probability of a correct answer. Although the Q-matrix validation through the general procedure suggested by de la torre and Chiu (2010) did not suggest any misspecification in the q-vector for Item 4, the G-DINA showed that the weight associated with this attribute was very low.
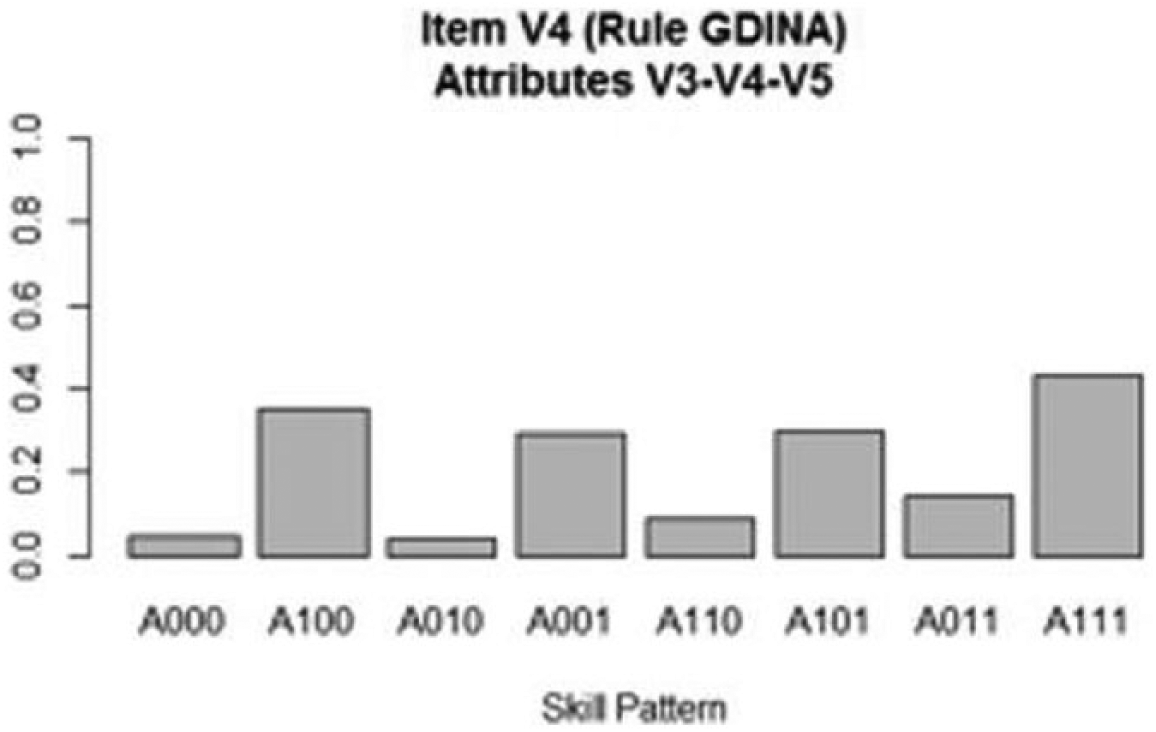
G-DINA attribute probability plot for Item 4.
According to Lee (2015), there are three components to diagnostic language assessment: diagnosis, feedback, and remedial learning. The first component, which is the core component, has to do with identifying test takers’ weaknesses and their root causes as well as their strengths, which can be carried out through CDM. Providing feedback for remedial learning through CDM can help secure consequential validity of language assessments (Messick, 1996). One interesting area for further research can be how learner characteristics (e.g., proficiency level, gender, learning style, etc.) and granularity of the attributes affect effectiveness of diagnostic feedback. However, there is one important caveat: As Lee (2015) argued, it should be noted that because competencies of most language learners are still in development, a distinction should be made among the undeveloped, partially developed, and fully developed competencies and for any of these stages of development it should be assessed whether competencies and their constituent components are malfunctioning, partially functioning, or highly functioning. In other words, when weaknesses or deficiencies are identified, it should be made clear whether the weakness reflects the stage of development (i.e., undeveloped, partially developed competencies) or it is due to the fact that the fully developed competency is malfunctioning or partially functioning due to factors affecting performance.
One more point should be made before wrapping up this section. CDM has been largely motivated by a call for more formative assessment by No Child Left Behind Act (2001). Formative assessment is carried out repeatedly in a course of instruction to monitor the learning process or change as a result of feedback and instruction. CDMs suit the purpose of formative assessment the best if they are used to identify the strengths and weaknesses of language learners over time rather than being applied to one-shot assessments. The intervention-induced changes over time can be modeled through a proper growth model. However, growth models have been proposed to model changes in continuous latent abilities over repeated measures. CDMs deal with binary mastery/nonmastery statuses. To measure change in binary mastery/nonmastery statuses, conventional growth models cannot be employed for the above mentioned reason. As a way around this problem, Li, Cohen, Bottge, and Templin (2015) integrated the DINA model with the latent transition analysis model to analyze change in binary continuous skills over time.
Limitations and Suggestions for Further Research
Regarding the process of Q-matrix development, there is as yet no standardized method of Q-matrix development. In this study, the Q-matrix was developed by having a group of students and content experts code the reading test while referring to the list of attributes previously specified by another group of experts. A think-aloud procedure would have resulted in more authentic determination of the attributes required to perform successfully on the test. Future studies can investigate relationships among attributes of varying difficulty. Challenging the findings of Alderson and Lukmani (1989) and corroborating the findings of Brutten, Perkins, and Upshur (1991) and Lumley (1993), the present study found a hierarchy of attribute difficulty. Future research can study stability of this hierarchy of difficulty across test takers of different proficiency levels (e.g., high, mid, and low).
Footnotes
Declaration of Conflicting Interests
The author(s) declared no potential conflicts of interest with respect to the research, authorship, and/or publication of this article.
Funding
The author(s) received no financial support for the research, authorship, and/or publication of this article.