



Abstract
The demand for diagnostic feedback has triggered extensive research on cognitive diagnostic models (CDMs), such as the deterministic input, noisy output “and” gate (DINA) model. This study explored two Q-matrix specifications with the DINA model in a statewide large-scale mathematics assessment. The first Q-matrix was developed based on five predefined content reporting categories, and the second was based on the post hoc coding of 15 attributes by test-development experts. Total raw scores correlated strongly with the number of skills mastered, using both Q-matrices. Correlations between the DINA-model item statistics and those from the item response theory analyses were moderate to strong, but were always lower for the 15-skill model. Results highlighted the trade-off between finer-grained modeling and less precise model estimation.
Large-scale assessments commonly employ unidimensional item response theory (IRT; Lord, 1980) models to report a single test score or latent ability. Such scores provide information about students’ general abilities in a subject domain, but do not give information on the various skills needed for successful performance. The demand for diagnostic feedback has triggered extensive research on cognitive diagnostic models (CDMs; for example, de la Torre, 2008; Huff & Goodman, 2007; Ravand, 2016; Tatsuoka, 1983). Along with the requirements for diagnostic reporting that are part of the No Child Left Behind Act of 2001 (No Child Left Behind, 2002) came interest in more detailed assessments that tap multiple examinee skill sets.
CDMs assess the mastery states of students on a set of knowledge, skills, or procedures called attributes. CDMs provide multidimensional diagnostic information indicating students’ mastery or nonmastery of the attributes. Research on the application of CDMs to large-scale IRT-based assessments has covered a variety of content domains and examinee groups, as well as technical topics. For example, Huebner, Wang, and Lee (2009) applied the deterministic input, noisy output “and” gate (DINA) model (Junker & Sijtsma, 2001; Macready & Dayton, 1977) to responses to the online diagnostic tool associated with the GMAT (Graduate Management Admission Test) quantitative assessment, and to a simulated sparse data set. Estimated parameters from the full and sparse data analyses matched very well. Lee and Sawaki (2009) applied three CDMs—the general diagnostic model, fusion model, and latent class analysis—to the listening and reading sections of two field-test forms of the TOEFL (Test of English as a Foreign Language). All three models’ findings were similar regarding examinee classification into mastery or nonmastery levels on most skills, suggesting that diagnostic models can extract sensible diagnostic information from assessments not originally designed for diagnostic purposes.
One important step in applying CDMs is the development of a Q-matrix (Tatsuoka, 1983). The Q-matrix determines the relationship between the test items and attributes. In practice, few assessments have been designed for providing diagnostic information. Attributes are thus usually identified after the test is developed, instead of being predetermined before item writing (e.g., Gorin, 2007). This creates difficulty in correctly defining the attributes needed for a test. Most of the time, the determination of attributes relies heavily on the knowledge of content experts, making post hoc coding of attributes subjective. Consequently, post hoc Q-matrices may not accurately represent all attributes required for a test, and different Q-matrices could provide varying diagnostic information. The motivation of this study was to explore the impact of using two different Q-matrices in a DINA model for assessing the fine-grained attributes in a large-scale mathematics test.
DINA Model
The DINA model provides interpretative and diagnostic information for further learning or classroom instruction (e.g., Haertel, 1989) by specifying whether a student has or has not mastered a set of skills. Application of the DINA model requires the specification of a Q-matrix. The elements of the Q-matrix, denoted
Let

Because
The DINA model provides information on whether the examinee masters each skill on a test. The DINA model is a latent variable model where the person latent trait can be understood as a set of categorical unobserved variables (i.e., mastery or nonmastery of an attribute/skill), in contrast to IRT where the latent trait is assumed to be a continuous unobserved variable. A common approach to estimating the DINA model is maximum likelihood estimation. Because the focus of this article is on an application of the DINA model, rather than on the DINA-model estimation per se, we refer interested readers to the didactic paper by de la Torre (2009) for more technical details regarding the estimation of the DINA model.
Q-Matrix
Relations between test items and attributes in CDMs are defined by the Q-matrix (Tatsuoka, 1983). Typically, multiple items measure each attribute, and multiple attributes or skills may be required by each item. The number of attributes influences the complexity of the Q-matrix and the attribute pattern. Given a fixed test length, as the number of attributes increases, the dimension of the Q-matrix also increases. Larger matrices can also yield different combinations of 0s (attribute k not required by item j) and 1s (attribute k required by item j), especially if many items tap multiple attributes. This provides for finer-grained diagnostic results. Thus, it is crucial to identify and assign to items the appropriate attributes when constructing a valid Q-matrix (Rupp & Templin, 2008).
Ideally, attributes should be specified during item development. The specification of the Q-matrix can then involve review of learning theories relevant to the tested constructs, exploration of items using think-aloud protocols, and expert knowledge (e.g., from content experts and educators). In most empirical studies of CDMs, however, attributes have been specified after the tests were created (Madison & Bradshaw, 2015), raising questions about Q-matrix adequacy. Simulation studies of Q-matrix misspecification (Rupp & Templin, 2008) show that both item and person results are affected when the Q-matrix is not correctly specified. Item-parameter estimates can be biased in a variety of ways. For example, item slip parameters may be overestimated for items with erroneous qjk values, whereas other well-specified items may not be affected. More critically, Rupp and Templin found that when certain attributes were omitted from an item’s specifications, up to 100% of students with a particular attribute pattern could be misclassified (either as having, or not having, particular attributes).
In practice, the “correct Q-matrix” will always be unknown, and one cannot determine definitively whether one matrix is more correct than another. Yet, clearly, if the Q-matrix analyzed is far different from the correct Q-matrix, inferences made from CDMs may be inappropriate. As captured by the famous quote, “Remember that all models are wrong; the practical question is how wrong do they have to be to not be useful” (Box & Draper, 1987, p. 74), the selection of the most appropriate model depends on several factors (e.g., model complexity, the degree of the model-estimation challenge, and the interpretability of the model-estimation results). Choosing the most appropriate model requires assessment of the cost caused by the magnitude of misfit in the fitted models. Both the cost of selecting an overfitting model (i.e., a complex model) and the cost of an underfitting model (i.e., a too-simple model) should be carefully assessed. In general, we would like to select a model that describes the data well and, at the same time, is simple enough that estimation and interpretation are straightforward.
The Current Study
Although research has compared the performance of CDM models using a variety of sorts of assessment data (e.g., Lee & Sawaki, 2009; Li, Hunter, & Lei, 2016; Ravand & Robitzsch, 2018), little work has focused on comparing the impacts of different Q-matrix specifications on diagnostic results. Investigations of the effects of Q-matrix designs have been conducted largely through simulation studies, from which Q-matrix designs have been shown to affect classification accuracy, reliability, and convergence rates (e.g., de la Torre & Chiu, 2016; Madison & Bradshaw, 2015; Rupp & Templin, 2008). What remains unclear are the empirical consequences when different Q-matrices are applied to large-scale assessment data.
Our study focuses on the impact of Q-matrices developed based on (a) the five predefined content reporting categories of a large-scale assessment, and (b) post hoc coding of 15 attributes by test-development experts. The 15-attribute Q-matrix is more fine-grained than the matrix with five attributes. A finer-grained Q-matrix is more likely to specify content more fully; however, it may face estimation challenges. These include a danger of overfitting which is burdensome for estimation and interpretation. A simple Q-matrix has an advantage in these regards, but it may not capture all key features in the data.
A popular noncompensatory DINA model was adopted for this investigation. The noncompensatory model assumes that high proficiency on one skill cannot compensate for low proficiency on another skill. This type of model has been shown appropriate for mathematics tests, because the solutions of mathematics problems often require mastery of skills at each step of problem solving (Roussos, Templin, & Henson, 2007).
Accordingly, the goal of this study is to explore two Q-matrix specifications with the DINA model in a statewide large-scale mathematics assessment. Specifically, we focused on (a) distributions of examinees according to the numbers of skills mastered under DINA models based on the two Q-matrices, (b) relationships between raw scores and the number of mastered skills estimated by the DINA models, (c) frequency distributions of raw scores for masters and nonmasters of each individual skill, and (d) relationships between IRT parameters (i.e., discrimination, difficulty, guessing) and DINA-model parameters (i.e., discrimination, guessing, slip) for the two Q-matrices (see more detail in “Method” and “Results” sections).
Method
Data Source
Data were drawn from a Grade 6 large-scale mathematics assessment in a state in the southern United States. The test contained 44 dichotomously scored items: 33 were multiple-choice items and 11 were gridded-response items. Multiple-choice items had been calibrated and equated under the three-parameter logistic (3PL) IRT framework. The probability of answering a question correct given the person’s level of latent ability

where a is the item discrimination parameter, b is the item difficulty parameter, and c is the item pseudo-guessing parameter. A gridded-response item is a type of constructed response item. A gridded-response item does not provide options from which an examinee can choose. Instead, the examinee provides his or her answer in a numeric grid. The chance of an examinee guessing on a gridded item is very low. Typically, the two-parameter logistic (2PL) IRT model is used for the calibration of gridded-response items, and the gridded-response items were operationally scaled using the 2PL IRT model in the large-scale assessment program from which we drew the data. In the 2PL IRT model, the guessing parameter is constrained to 0. For all items, IRT item parameters were readily available from the item bank.
Mathematics proficiency at Grade 6 covers five content domains that were specified prior to test construction: (a) number sense, concepts, and operations (NS); (b) measurement (M); (c) geometry and spatial sense (GS); (d) algebraic thinking (AT); and (e) data analysis and probability (DP). In practice, overall IRT scale scores are reported for decision making and official assessment purposes, and raw scores for the five subscales appear in score reports. Because the estimation of DINA models was computationally intensive, we used random samples from the statewide assessment population to reduce the time spent on estimation. Specifically, two random samples of 2,000 students were selected from the population of all tested students (approximately 200,000 students) for model estimation and cross-validation.
Two Q-matrices
We fitted DINA models with each of the two Q-matrices to each of the random samples. The two Q-matrices were constructed based on various potential attributes or skills needed for the 44 items on the test. Table 1 shows the first Q-matrix constructed based on the five content skill areas specified in the mathematics-assessment technical reports: NS, M, GS, AT, and DP. The DINA model for this matrix thus provides diagnostic information for each of the five content skills. Under this content-based structure, the number of items measuring each content domain ranged from 8 to 10. Each item measures only one attribute/skill.
Q-Matrix for the Five Content Skills.
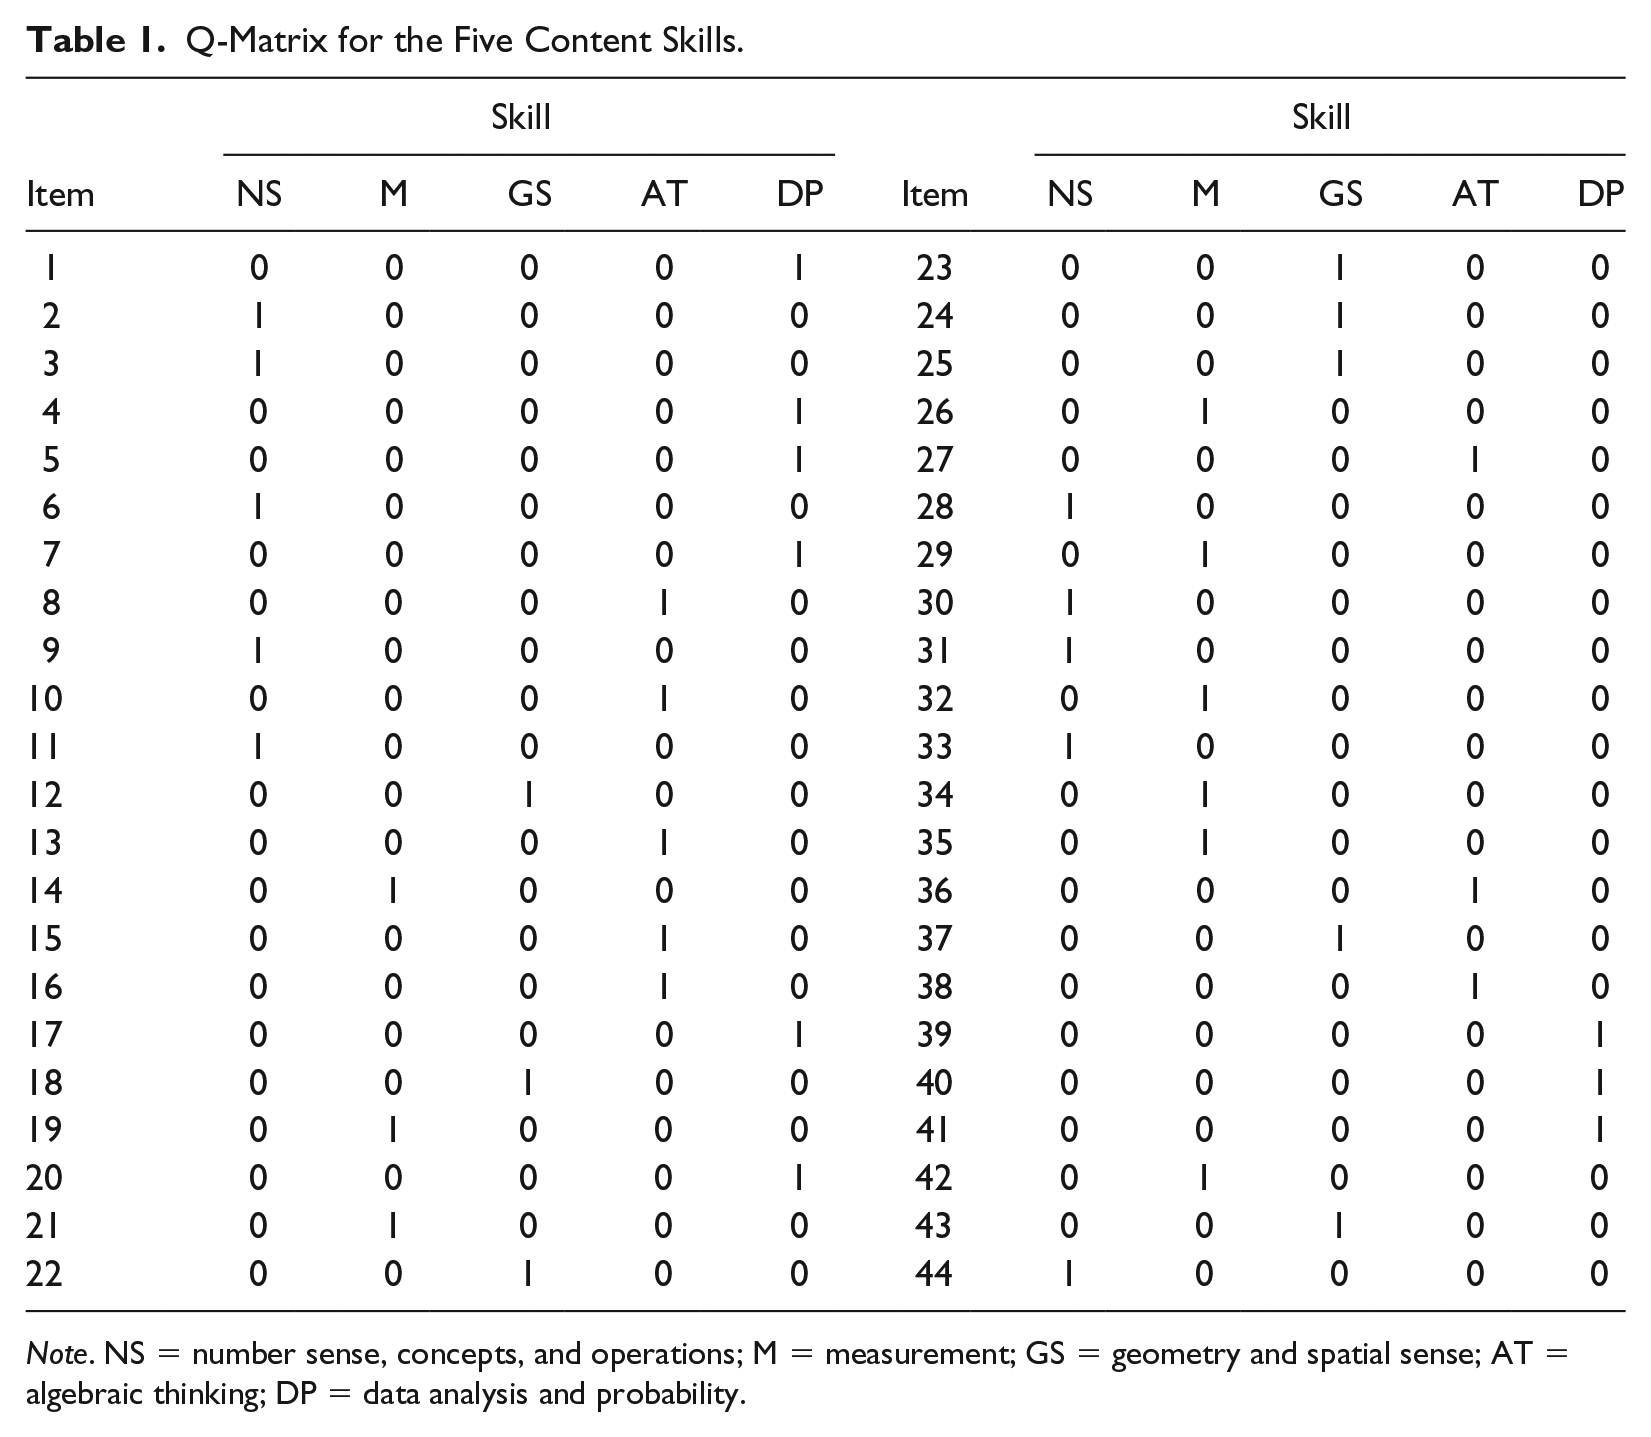
Note. NS = number sense, concepts, and operations; M = measurement; GS = geometry and spatial sense; AT = algebraic thinking; DP = data analysis and probability.
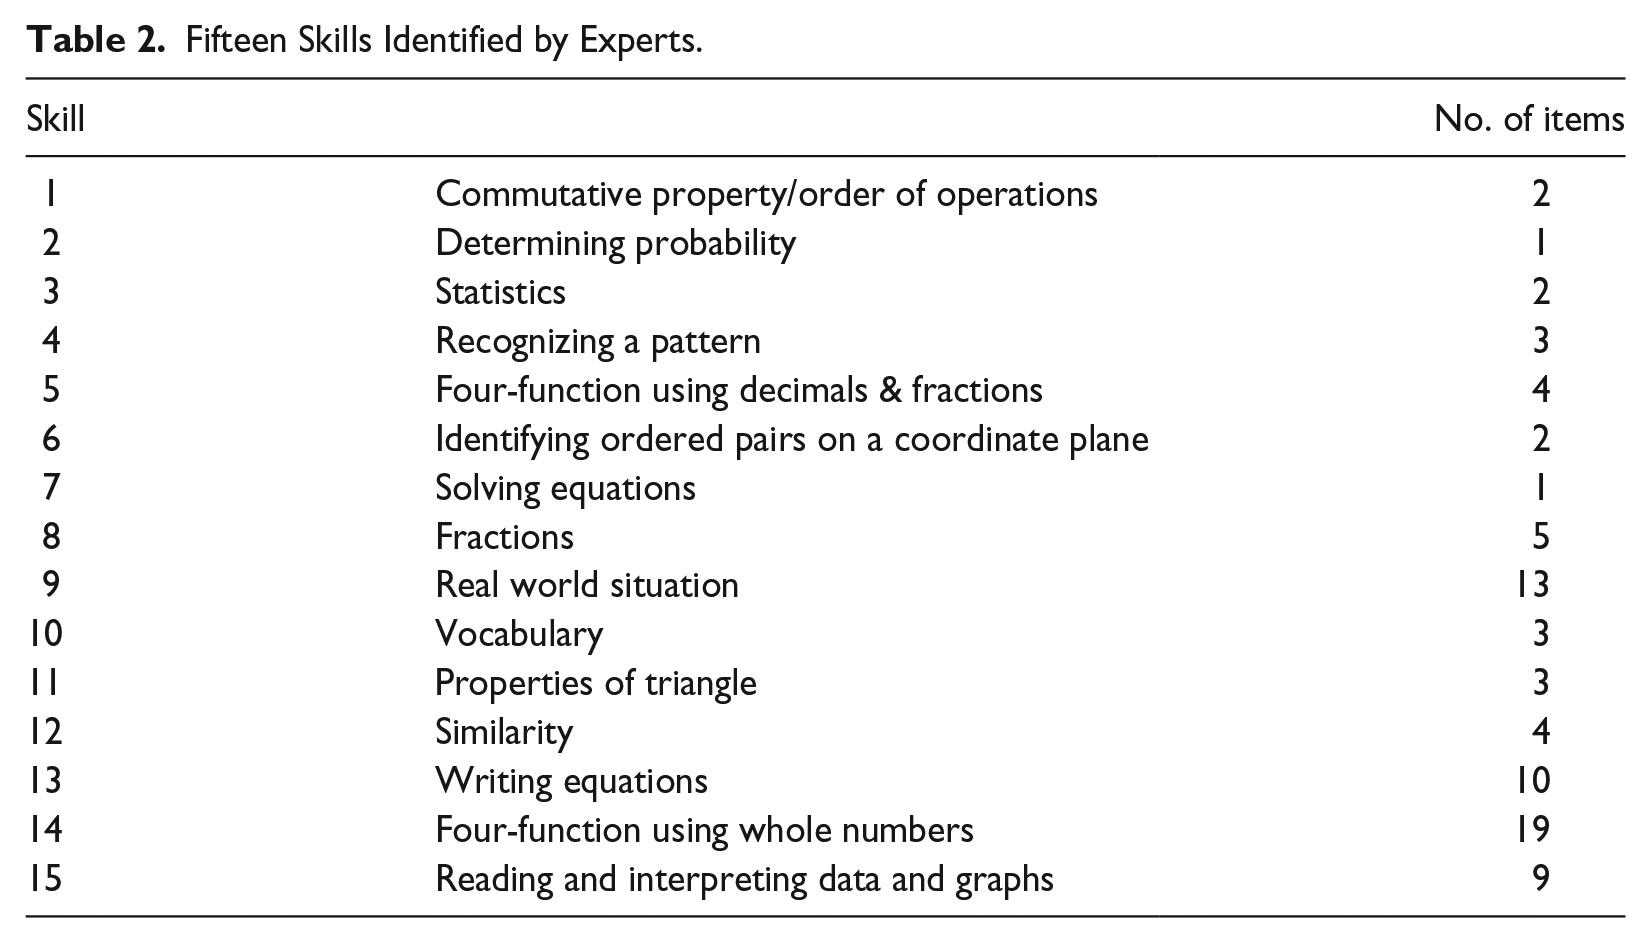
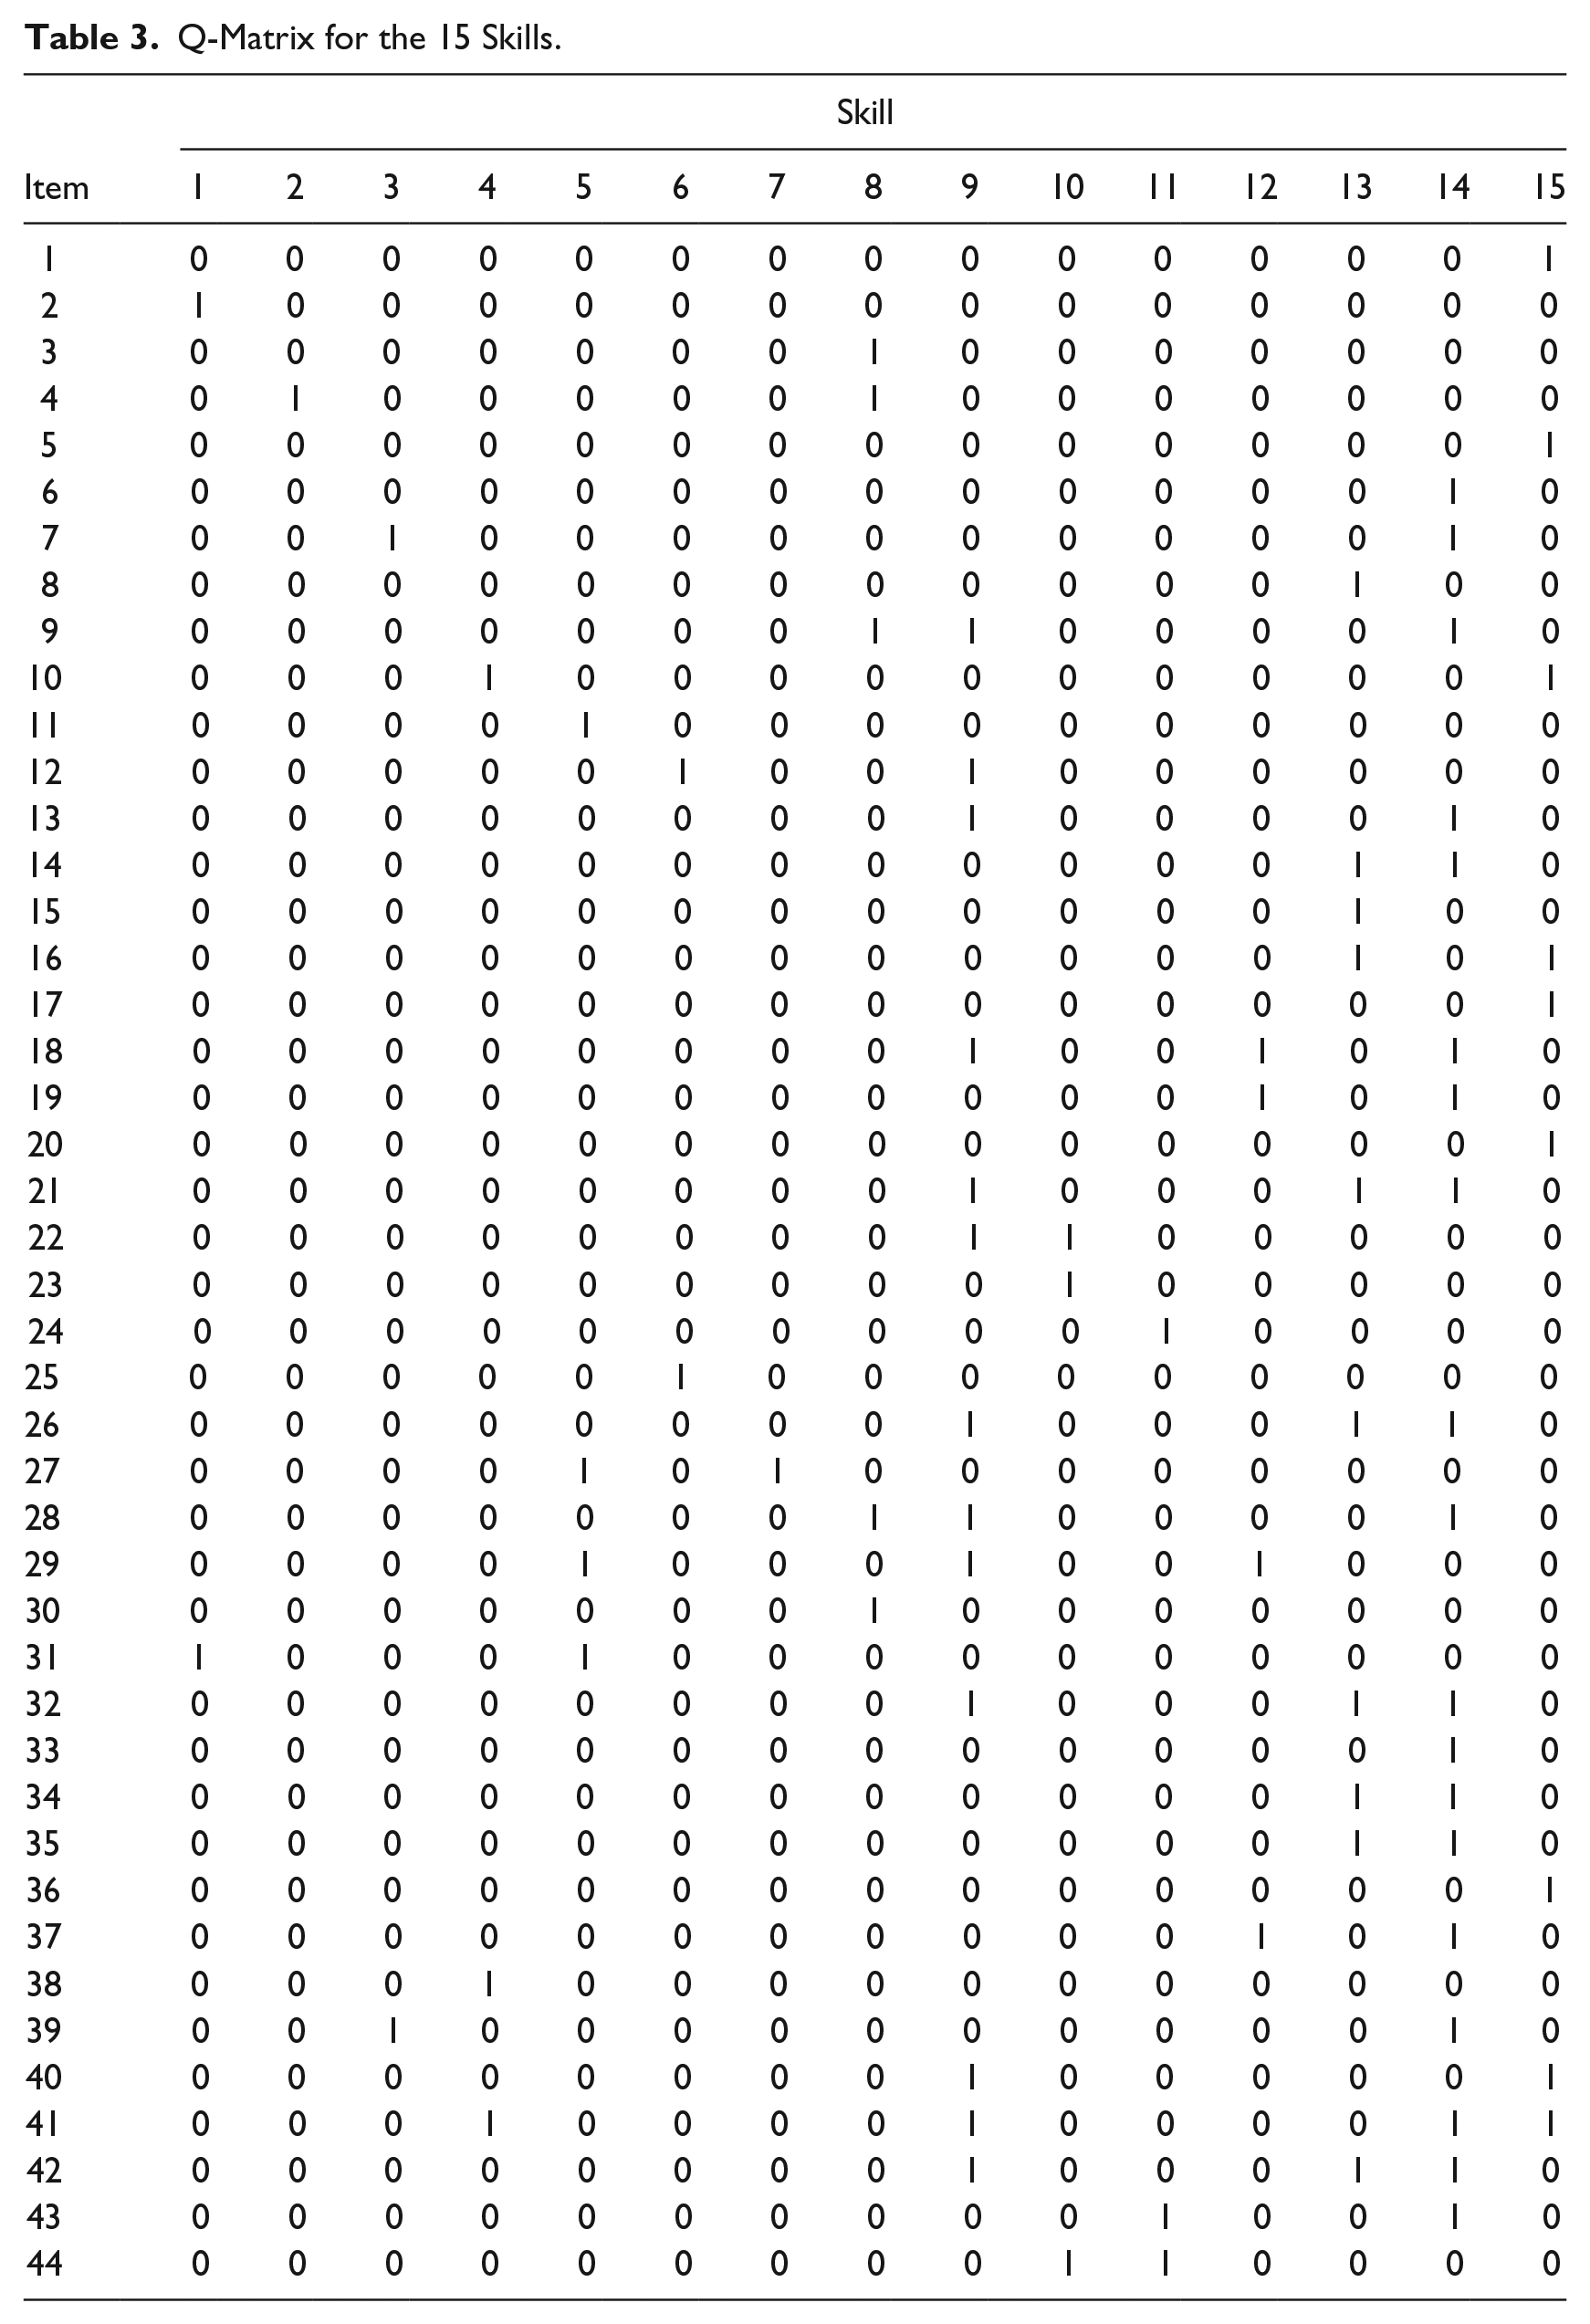
The second Q-matrix comprises 15 component skills as listed in Table 2. As we used an existing test form, no attributes had been identified during the initial stage of test development. The skills were constructed post hoc based on the knowledge and experiences of mathematics test-development experts. Two content experts from the state’s Test Development Center independently identified the skills required for each mathematics item to be solved correctly. Then, they discussed the coding for each item and reached a consensus if their codes disagreed. The experts initially identified 30 skills underlying the test, and after further discussion, they grouped similar skills together to establish the 15 skills. These 15 skills not only led to a reasonable number of unique skill patterns (215 = 32,768) that did not cause computation problems, but resulted in a good balance between the number of items and the number of skills. As a result, the number of items relevant to each skill varied from 1 to 19, and some items tapped multiple skills (ranging from 1 to 4). Table 3 shows the Q-matrix based on the 15 skills, specifying the relationship between the items and skills/attributes.
Fifteen Skills Identified by Experts.
Q-Matrix for the 15 Skills.
Data Analysis
The DINA models were estimated using the Ox program (Doornik, 2002), and maximum likelihood estimation was employed. IRT item-parameter estimates were obtained using MULTILOG 7.03 (Thissen, 2003). For each sample, DINA models using the five- and 15-skill Q-matrices were estimated and compared at the person and item levels. The item-level results from the DINA models were also compared with results from IRT models.
The model-data fit for the DINA analyses of the two different Q-matrices was evaluated based on the deviance, or −2 times the log likelihood (−2LL). Because models were not nested, a likelihood ratio test was not applicable. Thus, we simply compared the deviance values, where a smaller value indicates better model fit. In addition, we examined Akaike information criterion (AIC; Akaike, 1974) and the Bayesian information criterion (BIC; Schwarz, 1978) for relative fit comparisons between nonnested models. Information criteria can be viewed as penalized likelihoods. The penalty added to the deviance corrects for overfitting of a complex model. The penalty for AIC is a function of the number of estimated parameters. The penalty for BIC considers the sample size in addition to the number of parameters, and thus BIC imposes a harsher penalty than AIC and is known for a tendency to prefer simpler models (e.g., Vrieze, 2012). For both AIC and BIC, models with smaller values are in favor.
At the person level, we first examined the distributions of the number of skills mastered for each Q-matrix for each of the two samples. We then examined the relationships between the numbers of skills mastered and raw scores. Last, histograms of the raw-score distributions for students classed as masters and nonmasters of each attribute were examined.
At the item level, we examined correlations between (a) the IRT slope (or discrimination) parameter a and the DINA-based discrimination index δ, (b) the IRT pseudo-guessing parameter c and DINA-based guessing index g, (c) the IRT item-difficulty parameter b and the DINA-based guessing parameter g, and (d) the IRT b value and DINA-based slip parameter s. We also took a closer look at item statistics for the most extreme items as identified by their IRT difficulties, and for the gridded-response items. As most large-scale assessments are constructed based on the IRT framework, these analyses sought to answer whether IRT-based assessments can be diagnostically informative and to uncover the relationships between various IRT and DINA-model parameters. The discrimination and guessing parameters, respectively, from the IRT and DINA models are expected to be correlated. Also, items of higher difficulty are expected to show lower guessing values (e.g., Lee, de la Torre, & Park, 2012).
Results
Results are presented mainly for Sample 1, because the results for the two samples were extremely similar. Complete results for Sample 2 can be found in Supplemental Material.
Model Fit
Model fit was evaluated using the deviance, AIC, and BIC. The deviance of the 15-skill model (101,469.9) was lower than that of the five-skill model (103,372.9), suggesting better fit with the 15-skill model. This makes sense because more complex models usually yield lower deviance (i.e., fit better) due to the additional parameters estimated. However, both AIC and BIC indicated a preference for the more parsimonious five-skill model. AICs for the five- and 15-skill models were 103,610.9 and 167,179.9, respectively. BICs for the five- and 15-skill models were 104,277.4 and 351,197.5, respectively. The number of parameters estimated in the DINA model includes the number of item parameters and the number of unique skill patterns. The number of item parameters was 88 for both the five- and 15-skill models (two parameters, s and g, for each of the 44 items). However, the 15-skill model required the estimation of 215 = 32,768 unique skill patterns, while the five-skill model needed the estimation of only 25 = 32 unique skill patterns for examinees. Therefore, a sizable penalty (as a function of the number of parameters) was added to the deviance of the 15-skill model, leading to a large increase in its AIC and BIC values.
Previous studies have commonly examined various CDMs (e.g., DINA, G-DINA, etc.) based on the same Q-matrix, so any differences in the information penalty were mainly due to the difference in item parameters estimated across those CDMs, rather than differences in the number of skill patterns (e.g., Ravand & Robitzsch, 2018). Our study compared models based on two Q-matrices with different numbers of attributes. The increase in the number of attributes tremendously elevated the penalties in AIC and BIC. It was difficult to conclude which model fitted the data better given the current evidence. Model comparisons based on these information criteria should be made with caution.
Person-Level Results
Number of skills mastered
Figures 1 and 2 show the numbers of attributes mastered by students for the five content skills and 15 skills, respectively. For the five-skill model, the two extreme counts of mastered attributes (0 and 5) had the highest frequencies, indicating that the majority of students were classified as masters of either no skills or all skills. Specifically, about half of the 2,000 students in each sample did not master any content domain, and about 700 students (just over a third) mastered all five content areas. The five-skill model seems to mainly differentiate between students who had mastered all skills and all others.
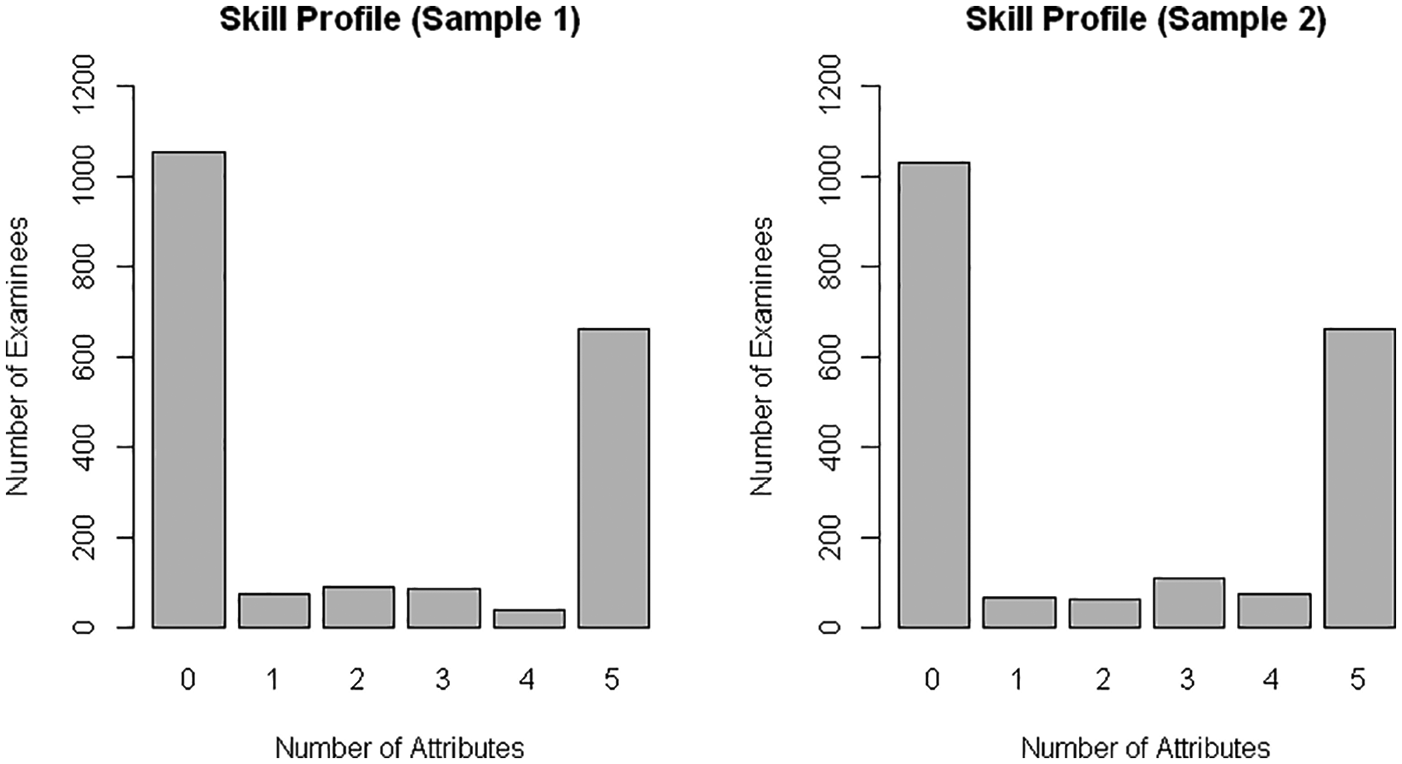
Distributions of number of skills mastered for five content skills.
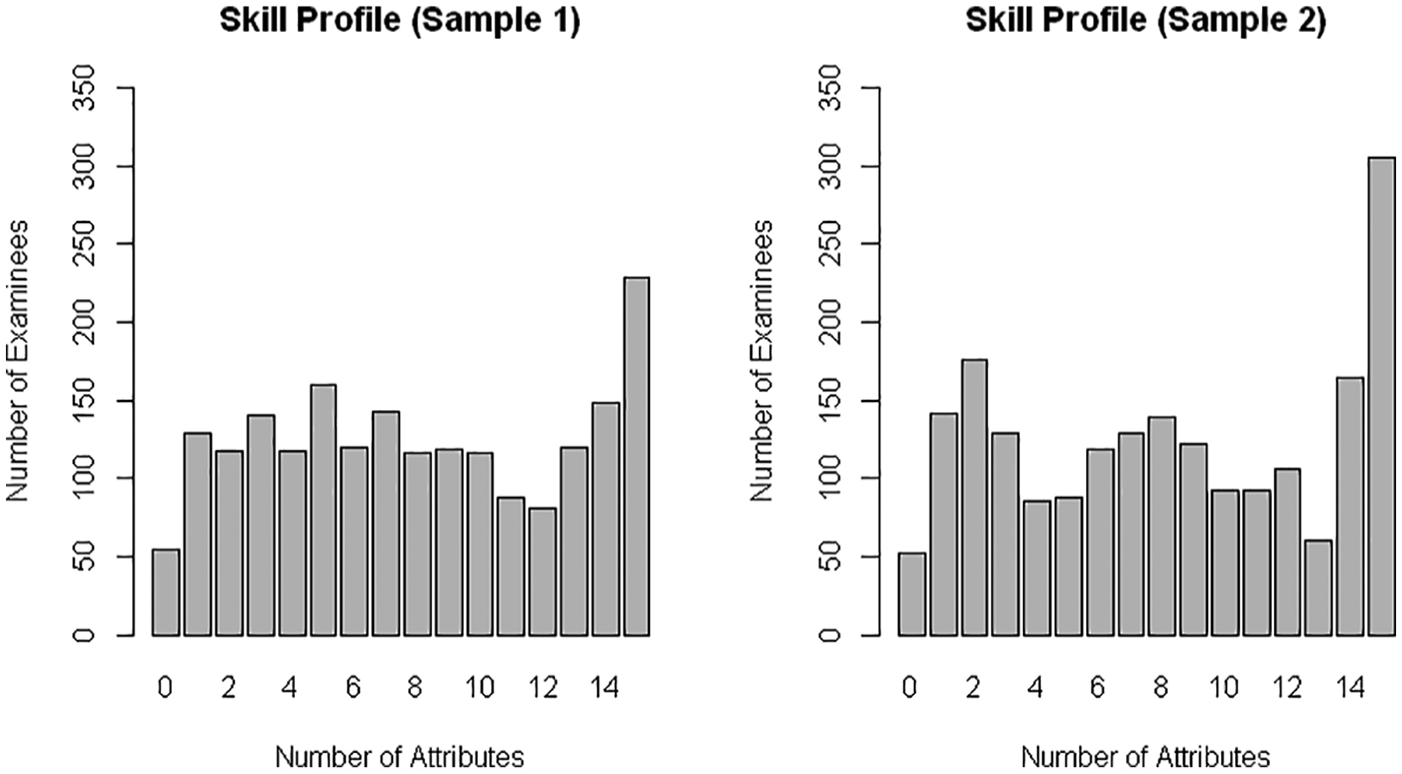
Distributions of number of skills mastered for 15 skills.
For the 15-skill model, roughly 12% to 15% of examinees mastered all 15 skills. The skills were finer-grained, and skill-mastery patterns were both more numerous and more specific for the larger number of defined skills. When more skills were tracked by the model, it was harder for students to master them all. Aside from the peak at 15 and low values for the mastery counts of 0 and 13, students were distributed roughly uniformly across the other attribute-score groups. This model classified students into more groups (with different numbers of mastered skills) than did the five-skill model. However, students could obtain each of the attribute-mastery counts in a variety of different ways that may reflect very different skill sets.
Relationship of raw scores to number of mastered skills
Figures 3 and 4 show bubble scatterplots of raw scores versus the number of mastered skills for the five- and 15-skill models, respectively, for Sample 1. Bubble size is proportional to the number of examinees at each coordinate pair. Given our 44 dichotomous items, the total possible raw score for the test was 44. Because the distributions of the number of skills mastered for the five and 15 skills were not normal, Spearman’s (1904) rank order correlations were computed between the raw scores and the numbers of skills mastered. For the five-skill model, the many values at the two extreme counts (0 and 5) reflect that the majority of students either had problems in all content areas or mastered all content skills. The correlation between the raw score and the number of mastered skills was .89, confirming that higher scoring students tended to master more skills.
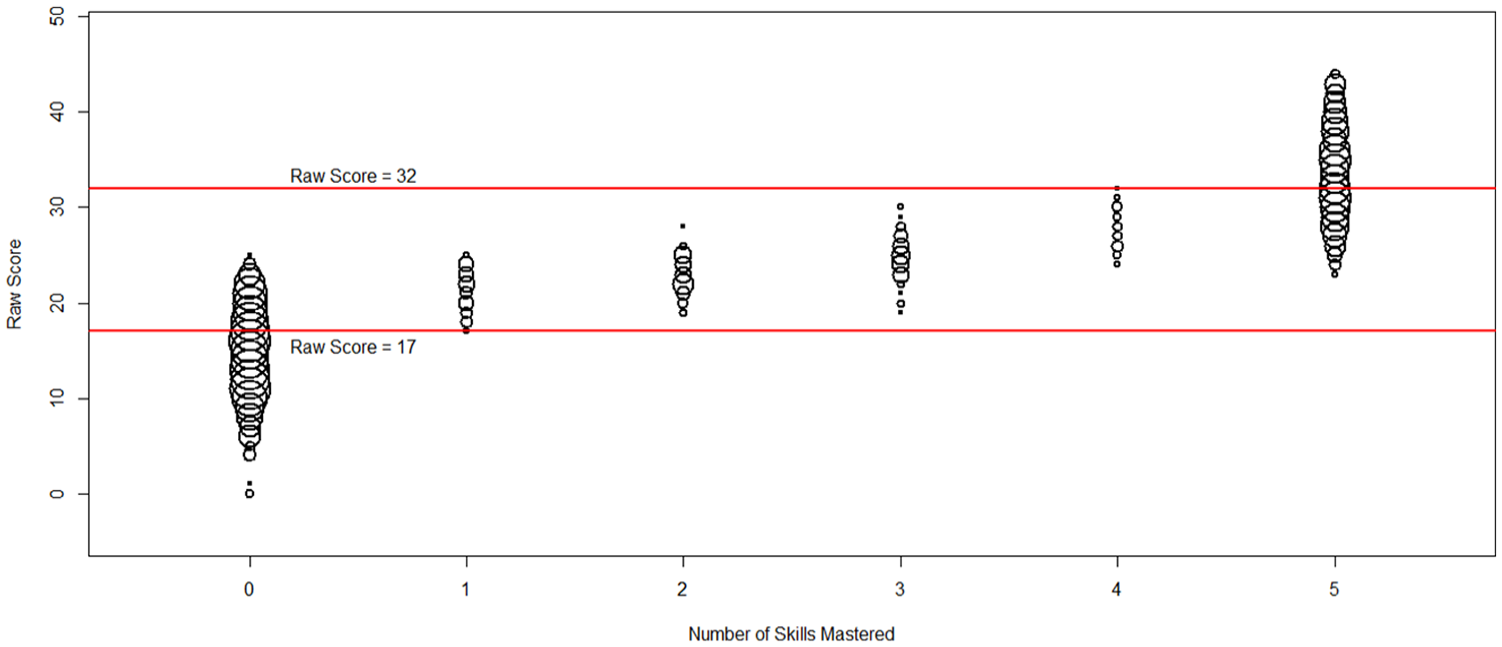
Bubble plot of raw scores versus number of skills mastered for five content skills.
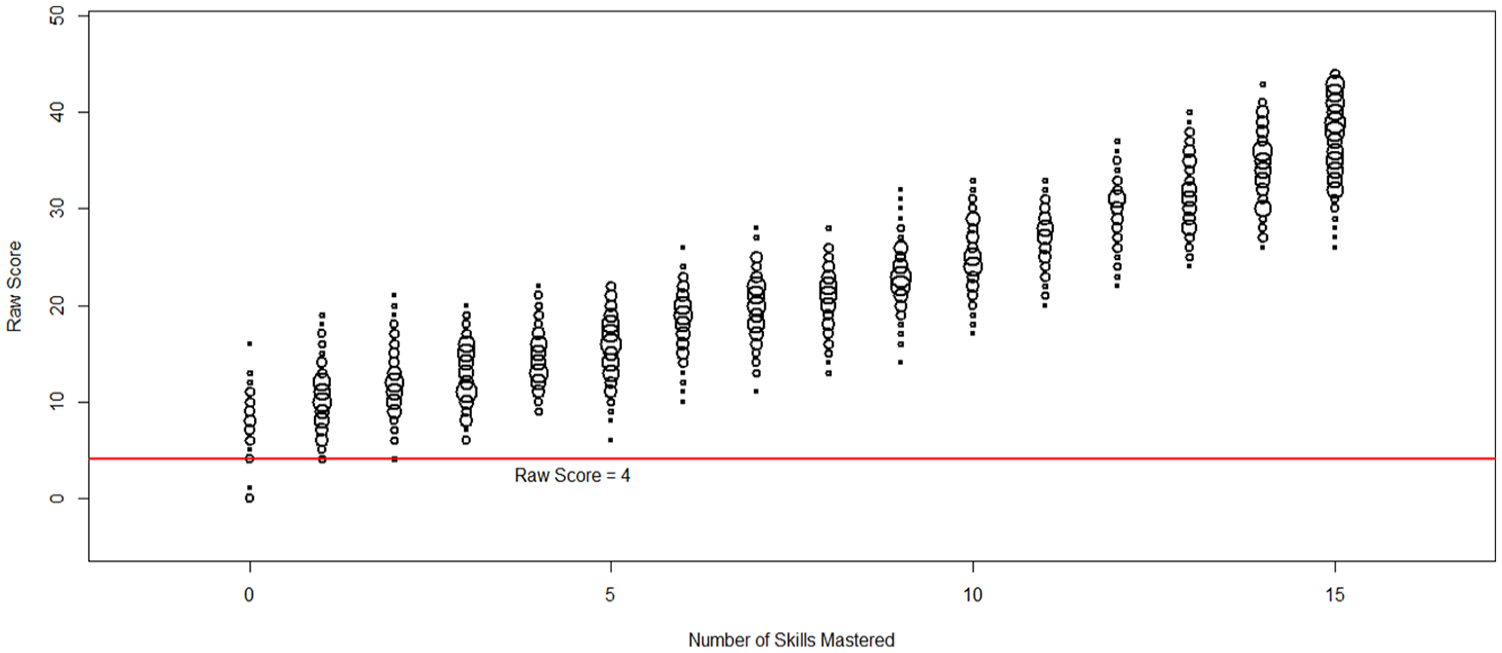
Bubble plot of raw scores versus number of skills mastered for 15 skills.
The two reference lines at raw scores of 17 and 32 in Figure 3 define three groups: (a) students with raw scores less than 17, who all mastered no skills, (b) students with scores from 17 to 32 who mastered some but possibly not all skills, and (c) students with raw scores greater than 32 who all mastered all five content skills. The plot shows that as raw scores increase, the number of mastered skills increases. However, raw scores varied widely among those who were classed as mastering no content areas, and among those who supposedly mastered all five areas.
We see a similar pattern for the 15-skill model in Figure 4. The correlation between raw scores and count of mastered skills was .94. The five-skill model had a lower correlation (.89), because it essentially dichotomized the group into masters and nonmasters. The 15-skill model classified examinees into more groups and provided potentially finer-grained diagnoses. However, raw scores also ranged widely within each skill-count group under this model. For example, among the 54 students who had not mastered any skills, four students scored 0 points, 40 students scored 1 to 10 points, nine students scored between 11 and 13 points, and one student scored 16 of the 44 total points available.
Raw-score distributions conditional on attribute-specific mastery
Figures 5 and 6 show raw-score distributions given students’ mastery status on each attribute for Sample 1. The x axis shows the raw total score. Gray bars outlined with dashed lines show score frequencies for examinees who had not mastered each skill. The white bars toward the right show raw-score frequencies for examinees who mastered the skill. These figures depict how mastery (or nonmastery) of each skill relates to the student’s raw score. In general, examinees scoring in the middle of the score range may (or may not) have mastered that skill. Students who mastered each skill were more likely to have high raw scores. Depending on what different skills are identified (as manifest in the Q-matrix), one skill may have more impact on obtaining high (or low) raw scores than another. As the number of identified skills increases, each skill is likely to have less impact on the raw score.
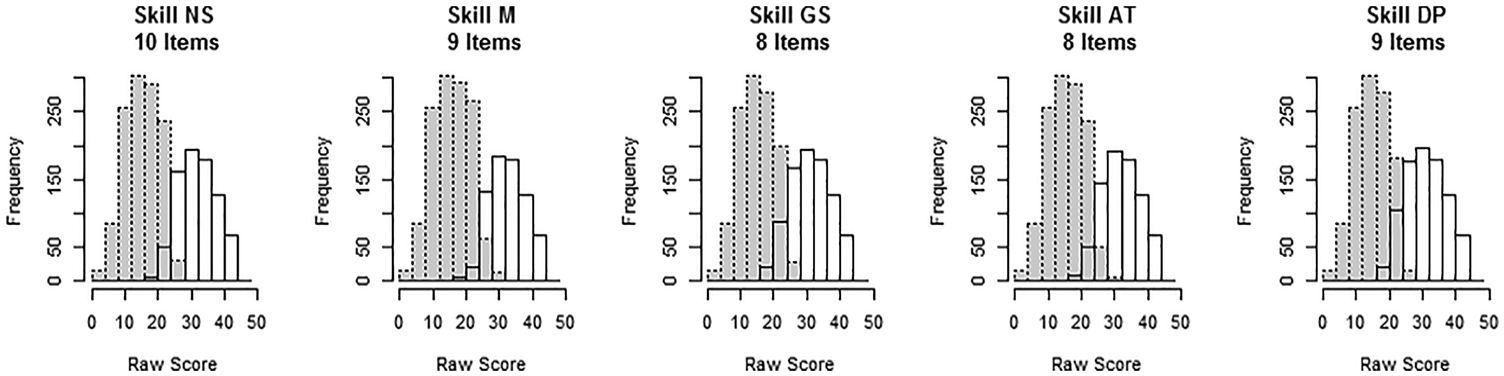
Raw-score distributions for masters and nonmasters of each of the five content skills.
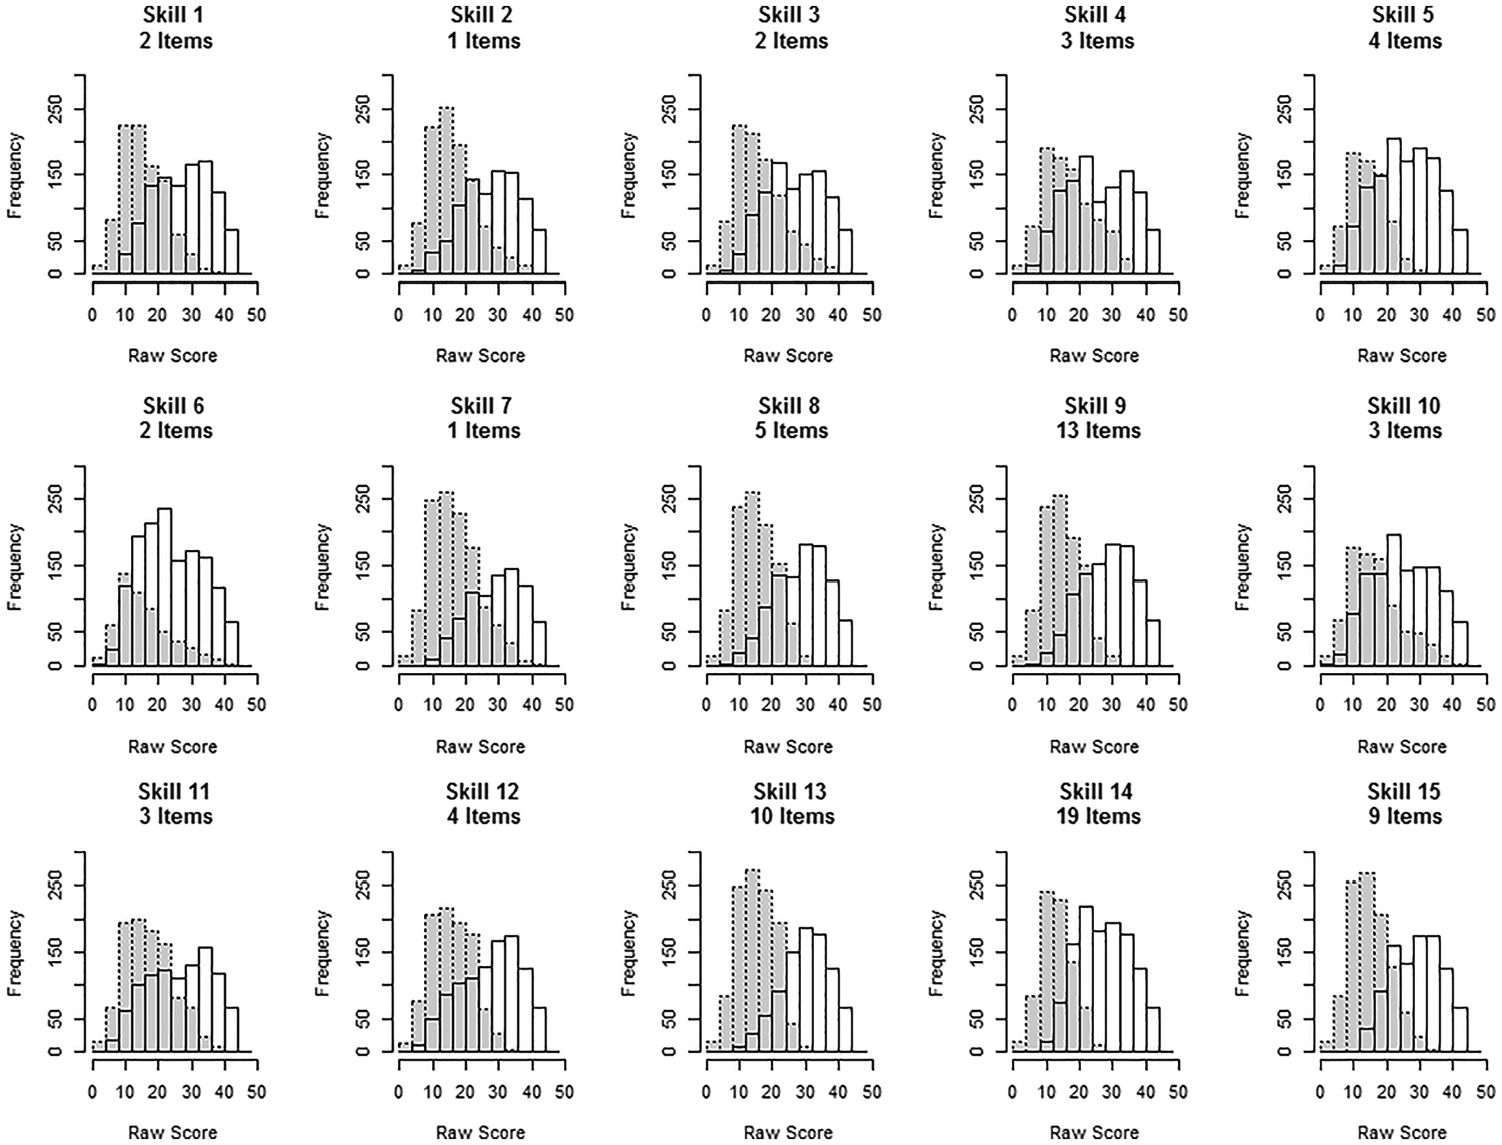
Raw-score distributions for masters and nonmasters of each of the 15 skills.
For the five-skill model, eight to 10 items tapped each skill. For the first skill, NS, some examinees at each raw-score point between 19 and 30 had mastered NS but others had not. The area of overlap in this score range included only 89 of the 2,000 students. Eight hundred and eight students with raw scores below 19 did not master the NS skill and are expected to have difficulty with NS items. The distributions for the other four skills show similar patterns. It was somewhat difficult to differentiate skill-mastery status for students scoring in the very middle of the raw-score range.
Similar patterns appear for the 15-skill model in Figure 6 but more overlap is seen in each plot. Overlap occurred when students in the mastery category had wide raw-scores ranges. The degree of overlap also related to the number of items in each skill. Skills with fewer items showed greater overlap, such as for Skill 3 (measured by two items; with 499 of 2,000 students in the area of overlap), Skill 4 (three items; 624/2,000), and Skill 10 (three items; 609/2,000). Skills with more items generally showed less overlap, such as Skill 9 (13 items; 379/2,000), Skill 14 (19 items; 289/2,000), and Skill 15 (9 items; 337/2,000). Given a set number of test items, as the number of defined skills increases, the number of items measuring each skill will likely decrease. When few items tap a skill, the capacity to clearly assign mastery and nonmastery status is low. This reflects a trade-off between finer-grained Q-matrix modeling and discriminating power.
Item-Level Results
Table 4 presents the correlations between the IRT estimates and the five- and 15-skill DINA-model parameter estimates based on Sample 1. All correlations between IRT and DINA parameter estimates were higher for the five-skill model. The correlation between IRT and DINA discrimination indices for the five-skill model was .78, over twice that for the 15-skill model (.31). The IRT and DINA guessing indices had low to moderate correlations for both Q-matrices.
Correlations Between IRT and DINA Parameters.
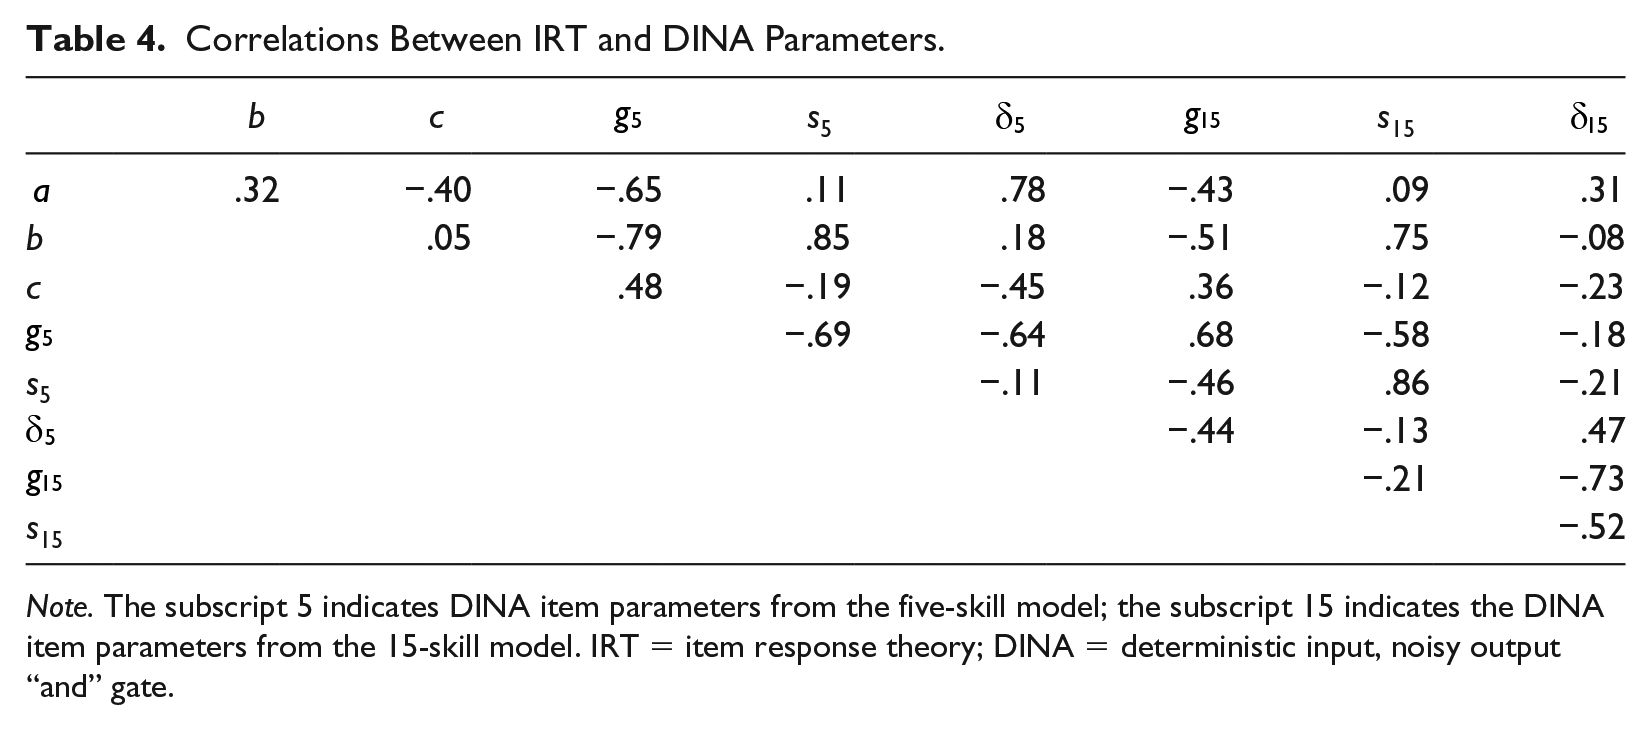
Note. The subscript 5 indicates DINA item parameters from the five-skill model; the subscript 15 indicates the DINA item parameters from the 15-skill model. IRT = item response theory; DINA = deterministic input, noisy output “and” gate.
The IRT difficulty and DINA guessing-parameter estimates were negatively correlated; this makes sense because the DINA guessing-parameter represents the chance of a less capable examinee getting the item right. The IRT difficulty and DINA slip-parameter estimates correlated positively. The probability
Table 5 shows the item-parameter estimates for the gridded-response items based on Sample 1. The IRT pseudo-guessing parameters (c) were constrained to 0, and the DINA models also produced low to moderate guessing-parameter estimates (g), especially for the 15-skill model, except for a few items (6, 26, and 39). These few items also had moderate-sized IRT difficulty values on average. Based on the DINA model, the students who were missing at least one required skill had average
Item Parameter Estimates for Gridded Response Items.
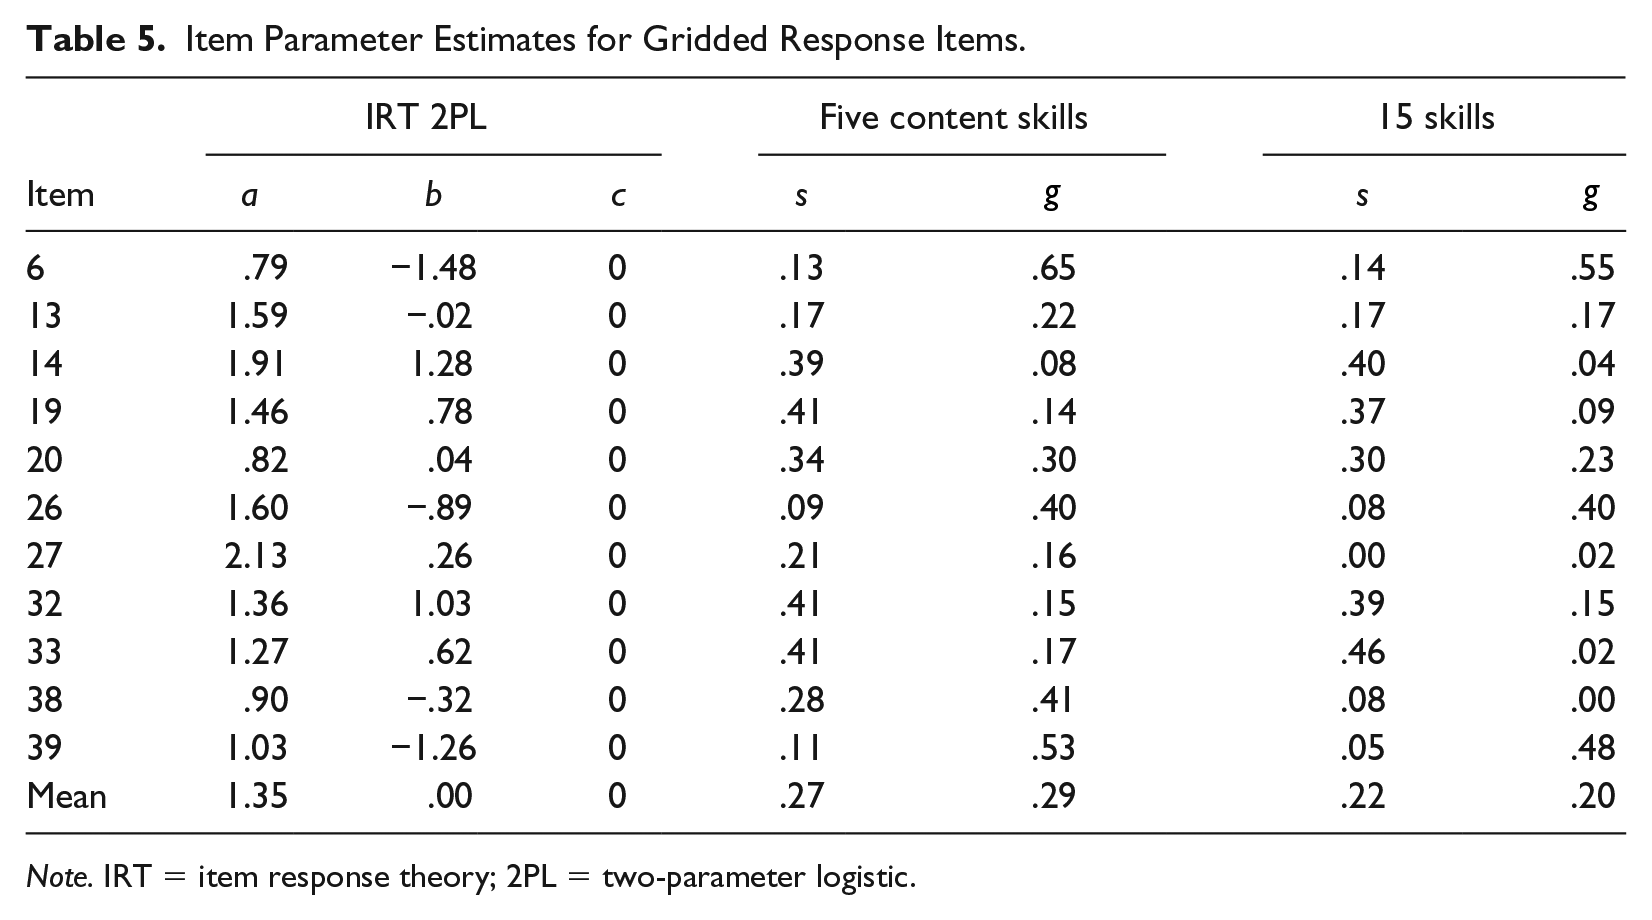
Note. IRT = item response theory; 2PL = two-parameter logistic.
Another interest in analyzing item-level results was to compare the mean item-parameter estimates for items with various levels of difficulty. We report results for the nine easiest items (the lowest quantile in terms of IRT item difficulty) and nine most difficult items (the highest quantile in terms of IRT item difficulty), regardless of the item type. The observed differences in parameter estimates, if any, will be the greatest between these two groups of items. Thus, differences between parameter estimates from the easy and difficult items can be observed more easily.
Table 6 shows the item-parameter estimates for nine easy items. Average probabilities of correct responses for these items were quite high: .87 (for five skills) and .93 (for 15 skills). The moderate degree of guessing for these items indicates that students were likely to answer the items correctly by guessing, even without all required skills. These items showed low DINA slip parameter(s) estimates, suggesting that students who had mastered the required skills were not likely to miss the easy items.
Item Parameter Estimates for Nine Easy Items.
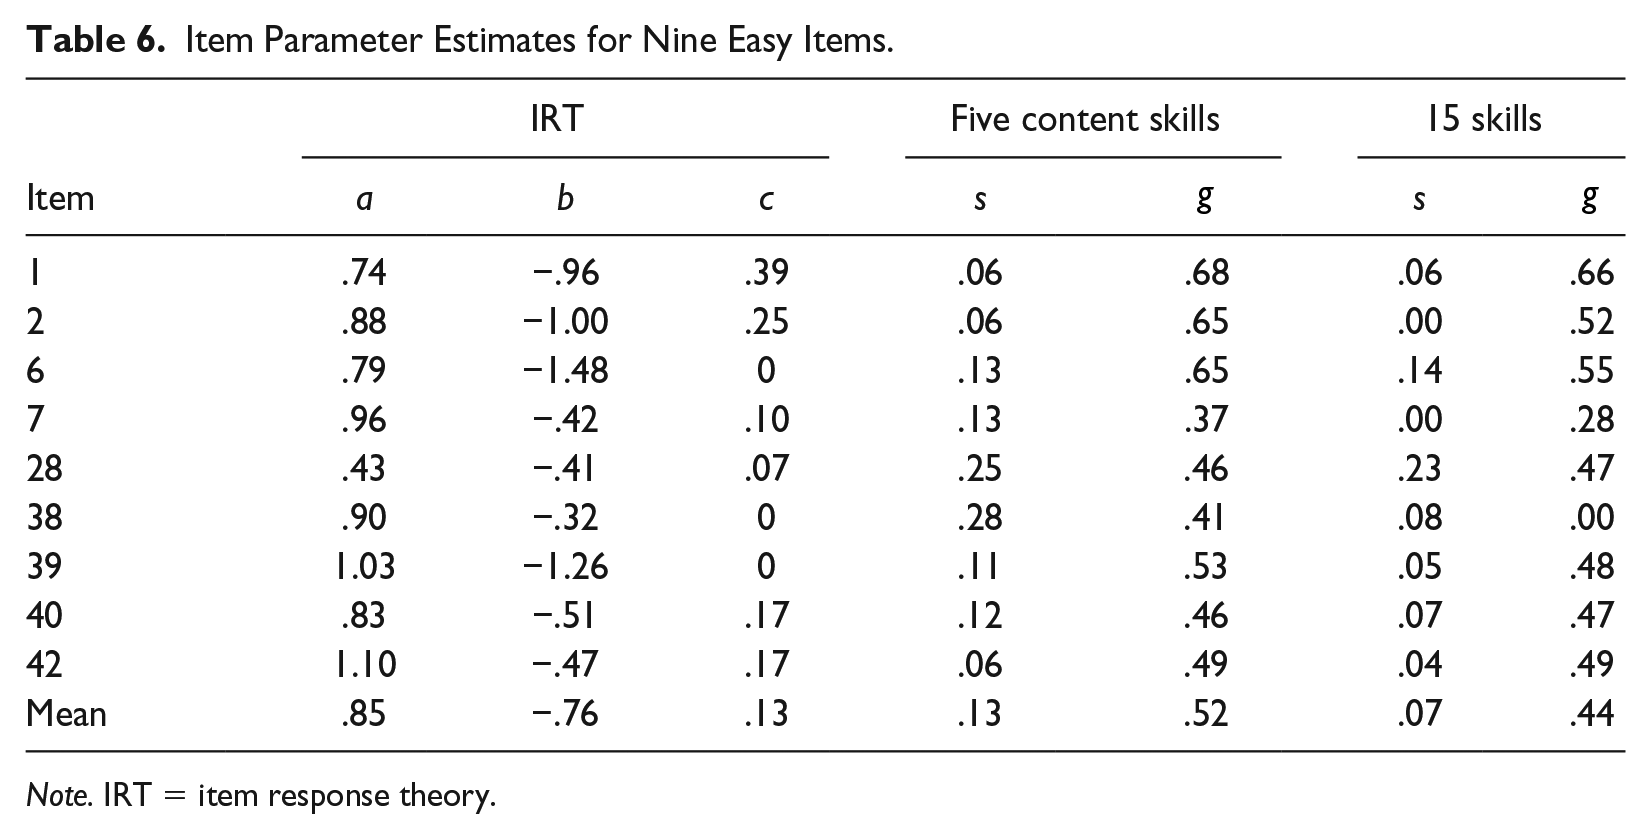
Note. IRT = item response theory.
Table 7 shows the item-parameter estimates for the harder items. Compared with the results from Tables 5 and 6, the DINA slip values were higher, and DINA guessing values were lower. Students had only a moderate chance to answer these hard items correctly even if they possessed all the required skills based on the DINA model (.60 probability on average). The low values of the DINA guessing-parameter estimates indicated that nonmastery students had less chance to answer a difficult item correctly by guessing than they did for easy items. Both s and
Item Parameter Estimates for Nine Difficult Items.
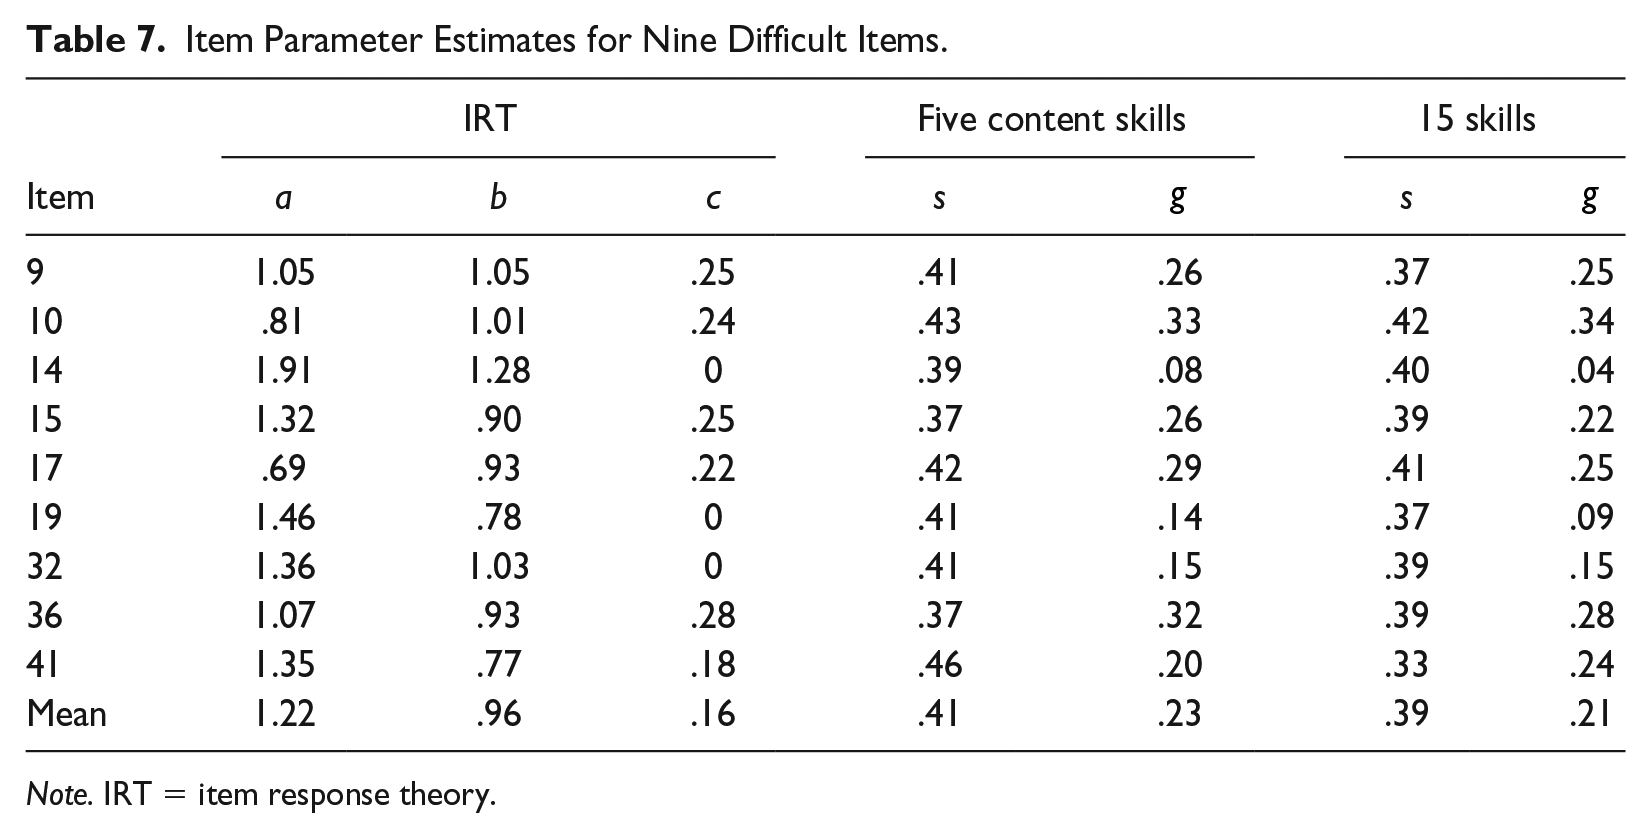
Note. IRT = item response theory.
Discussion
The large-scale mathematics assessment examined in the current study was constructed to measure one overall latent trait and had a subtest structure with five content domains. DINA models that provide specific diagnostic information can complement the current practice of reporting overall and subtest scores. The DINA diagnostic information may help educators understand students’ learning needs and improve classroom instruction, as well as assist students to understand their strengths and weaknesses to facilitate effective learning. Our study findings are summarized as follows.
The raw test scores and the counts of mastered skills were strongly correlated using both five- and 15-skill Q-matrices. For both samples, the 15-skill model had slightly higher correlations (.94-.95) than did the five-skill model (both .89), which is consistent with having a more fine-grained analysis of student abilities provided by the 15 components. These values compare well with the correlation between skill counts and raw test scores reported by Li and Suen (2013) for a test of reading comprehension (.96). The lower correlation for the five-skill model may also have resulted in part from the fact that 86% of the students fell into only two groups—masters or nonmasters of all skills.
The 15-skill model dispersed students more uniformly across 16 skill-count groups (from 0 to 15), except that the full mastery group included about 14% of the sample (roughly twice what would be expected had all groups been equal in size), and thus its skill counts correlated better with the raw scores. In our analysis, the category of “0” in the five-skill case may not necessarily mean “zero” masteries across the 15 skills. However, students in the “5” category for the five-skill analysis should be more likely than others to master many or all of the 15 skills. It would be expected that the distribution of the numbers of skills mastered (0-15) for the students in the “0” category of the five-skill case is positively skewed, and the distribution of the numbers of skills mastered (0-15) for the students in the “5” category of the five-skill case is negatively skewed. It is noted that having the skill counts spread uniformly may not be the goal in Q-matrix specification. The connection of the Q-matrix to the distribution of skills warrants further investigations.
Students classified as mastering the delineated math skills tended to have higher raw scores. However, when individual skill-level mastery groups were examined, raw-score distributions for masters and nonmasters based on the 15-skill model overlapped substantially (Figure 6). Thus, at the skill level, examinees were not differentiated particularly well on each individual skill within the 15-skill model. For some skills, the distributions of raw scores for the mastery group covered almost the entire raw-score range, including the entire distribution for nonmasters. Also within each skill-count group, raw test scores varied widely.
Correlations between the DINA-model item statistics and those from the IRT analyses were moderate to strong, but were always lower for the 15-skill model. Although the discrimination parameters correlate positively, they are based on different conceptualizations of discrimination. The DINA discrimination index
Recommendations
The current study shows that although, in practice, many assessments are constructed under an IRT framework, they can still provide useful diagnostic information when analyzed using a CDM model. The number of attributes mastered and the status of skill mastery correlated reasonably well with the total raw scores; item parameters of the IRT and DINA models were also meaningfully correlated. One challenge of applying CDMs to existing assessments is the difficulty of constructing a proper Q-matrix post hoc. The number and nature of skills that underlie any real assessment are, to some degree, a matter of judgment. Given the limited numbers of items in typical test forms (about 40 to 50 items), as more skills are identified and assessed, fewer items tend to be used to measure each skill. In our analysis, the second Q-matrix, for example, has the advantage of finer-grained classifications of attributes or skills essential to solving problems, which have the potential to produce more detailed diagnostic information on students’ performance. However, because the items were not intentionally developed for a diagnostic test, and because the test was not extremely long, several attributes were assigned only a small number of items. This could affect the precision of estimation of related skills. Researchers should also be aware of this trade-off between finer-grained modeling and less precise model estimation; the latter can be elusive when the number of attributes is large.
To enhance diagnostic power, tests should be constructed consistent with the desired CDM analysis framework (Mislevy, 1994), instead of deriving attributes from existing items that are IRT based. That is, to provide optimal diagnostic information, the attributes can be identified a priori, and the Q-matrix can be constructed at the beginning of the test-development process under a cognitive diagnosis framework. If our test had been constructed with the named attributes in mind, more items could have been designed to tap each of the skills, or to get at multiple skills. Also, the appropriateness of the specification in the Q-matrices under consideration should be empirically assessed to minimize the bias in the estimated results. Various approaches have been proposed to detect misspecification in the Q-matrix and/or validate the Q-matrix, including the data-driven approach (Barnes, 2010; Liu, Xu, & Ying, 2012), model-based approach (DeCarlo, 2012; Templin & Henson, 2006), nonparametric classification method (Chiu, 2013), and empirical methods with a provisional Q-matrix (de la Torre, 2008; de la Torre & Chiu, 2016). Validating the Q-matrix would ensure that all attributes intended to be measured are included, and that each attribute is measured by a sufficient number of items. However, constructing such assessments based on a priori profiles of required cognitive skills can be costly in terms of both time and expertise.
Because this is an empirical study and the true Q-matrix is unknown, we do not make recommendations on the use of larger or smaller Q-matrices in practice. Instead, through the empirical comparison of the two Q-matrices, we illustrated some potential outcomes of adopting Q-matrices with smaller or larger numbers of attributes.
Limitations and Future Research
This study has several limitations, which lead to potential future research directions. First, we examined only a sixth-grade mathematics assessment. As the subject and/or grade changes, the Q-matrix will also change accordingly and would need to be properly aligned with relevant content. Thus, generalizing results far beyond the grade and content measured in this study requires caution. Second, other CDMs could be applied with the Q-matrices and data used in this study. Comparisons among various CDMs could enhance our understanding of the skills needed for mathematics performance and reveal the roles of Q-matrices in different models. Third, a simulation study designed according to the empirical findings, with predefined Q-matrices and known parameters, would aid with our understanding of the results from this study.
The uncertainty of the Q-matrix is one limitation of the use of DINA models in empirical applications (e.g., Basokcu, 2014; DeCarlo, 2012). Our Q-matrix with five skills was content based, in that we did not examine actual skills needed to answer items, but relied instead on the content-based subtest structure of the operational test. Fitting only a content-based Q-matrix with a CDM may not accurately reflect all of the component skills required for problem solving. For the Q-matrix with 15 skills, domain knowledge from experts applied in a post hoc fashion may also not have captured all skill components needed in the Q-matrix. Nevertheless, it likely is closer to the “real” structure. It also provides a more particularized set of mastery levels than the simpler model, although a finer-grained Q-matrix for a fixed test length means a lower number of items for each skill. As the Q-matrix is commonly constructed post hoc, the application and comparison of various Q-matrix validation approaches (as listed in the “Recommendations” section) to empirical Q-matrices may enhance further investigations.
Supplemental Material
JPA_supplement – Supplemental material for Exploring the Impact of Q-Matrix Specifications Through a DINA Model in a Large-Scale Mathematics Assessment
Supplemental material, JPA_supplement for Exploring the Impact of Q-Matrix Specifications Through a DINA Model in a Large-Scale Mathematics Assessment by Haiyan Wu, Xinya Liang, Hülya Yürekli, Betsy Jane Becker, Insu Paek and Salih Binici in Journal of Psychoeducational Assessment
Footnotes
Acknowledgments
The authors thank Christopher Harvey and Susan Cornwell from the Florida Department of Education, Tallahassee, FL, for their expertise on identifying the 15 attributes for the assessment. The authors thank the editor and two anonymous reviewers for helpful comments on earlier drafts of this manuscript.
Declaration of Conflicting Interests
The author(s) declared no potential conflicts of interest with respect to the research, authorship, and/or publication of this article.
Funding
The author(s) received no financial support for the research, authorship, and/or publication of this article.

Supplemental Material
Supplemental material for this article is available online.
References
Supplementary Material
Please find the following supplemental material available below.
For Open Access articles published under a Creative Commons License, all supplemental material carries the same license as the article it is associated with.
For non-Open Access articles published, all supplemental material carries a non-exclusive license, and permission requests for re-use of supplemental material or any part of supplemental material shall be sent directly to the copyright owner as specified in the copyright notice associated with the article.
