
Abstract
The proliferation of Internet usage has motivated Internet researchers and practitioners to study possible gratifications underlying Internet use. Despite the fact that research examining Internet gratification is more than two decades old, no attempt has been made in the last decade to develop an instrument that has known reliability of scores and validity of inferences to examine the various Internet gratifications. To bridge this gap, the present study has estimated the reliability of scores and validity of inferences of a 27-item instrument, examining different Internet uses and gratification (U&G) among 1,914 adolescent Internet users. The development and validation process involved exploratory and confirmatory factor analyses, examination of convergent and discriminant validity, and other measures of construct validity and reliability. The factor analyses revealed a six-factor structure, representing six Internet gratifications, namely, information seeking, exposure, connection, coordination, entertainment, and social influence. This instrument exhibits excellent internal reliability. The practical and theoretical contributions of this instrument are also presented.
Introduction
The Internet has become an essential part of our lives, with users spending a considerable amount of their time on the Internet. This has led to the emergence of clinical investigations into why people use the Internet, what kinds of gratification they seek from Internet use (Diddi & LaRose, 2006; Kim & Haridakis, 2009; Roy, 2009), and what kinds of needs are satisfied with increasing Internet use. To understand the gratifications of Internet use, researchers have proposed the uses and gratifications theory (UGT), a well-known theory in the field of media research. The UGT presents a psychological communication framework, which states that different users have different uses, motives, and choices with regard to media use. Therefore, different users use a given media platform for different reasons (Severin & Taknard, 1997).
Research examining Internet uses and gratifications (U&G) spans nearly two decades. However, despite this long period of development, very few studies have aimed to develop and validate an instrument with known psychometric properties to examine Internet gratifications. The 27-item Internet Motives Scale (Papacharissi & Rubin, 2000) and the 18-item Television Viewing Motivation Scale (Rubin, 1983) are the most widely utilized instruments derived from prior U&G literature. Both these instruments, however, suffer from various limitations. The Internet Motives Scale is more than a decade old, and the Television Viewing Motivation Scale was designed three decades ago.
Meanwhile, the Internet has undergone a lengthy evolution process since its emergence, and Internet-based services are still evolving. Therefore, both these instruments need to be revised, refined, and updated as per the social and psychological needs of the present-day Internet users. These instruments require psychometric validation to determine whether they are still valid for present-day Internet-based activities. Unfortunately, no attempt has been made to develop and examine the validity of inferences made from the instrument for examining Internet U&G in more than a decade. To bridge this gap, the present study has estimated the reliability of scores and validity of inferences of a 27-item Internet gratification instrument based on earlier Internet U&G literature. This instrument is of great relevance for both researchers and practitioners, because it will enable the utilization of an instrument with known reliability of scores and validity of inferences for examining the U&G of media platforms in addition to the Internet.
During a review of earlier Internet U&G literature, it was found that most prior work focused on a broad range of Internet user age groups (e.g., 16-54 years or 16-75 years; see Table 1). Therefore, only limited understanding exists of the potential Internet U&G of specific age groups (i.e., gratifications specific to pre-teens, adolescents, adults, and older Internet users). To date, only a handful of studies have examined the Internet U&G of specific age groups (e.g., adolescents aged 12-19 years). In the present study, the target user group is adolescent Internet users. Adolescents differ from adults in that they are in a developing social and psychosocial stage in their lives, in addition to having various cognitive and personality-related differences (Leontjev, 1978; Piaget, 1970). Furthermore, it might also be worth noting that many adolescents today have never experienced a world without the Internet. Due to these reasons, it is thus quite plausible to assume that the Internet U&G of adolescents might be quite different from those of older age groups. To help confirm this supposition, the present study has estimated the reliability of scores and validity of inferences of an Internet U&G instrument specifically designed for adolescent Internet users.
Review of the Prior Internet U&G Literature.
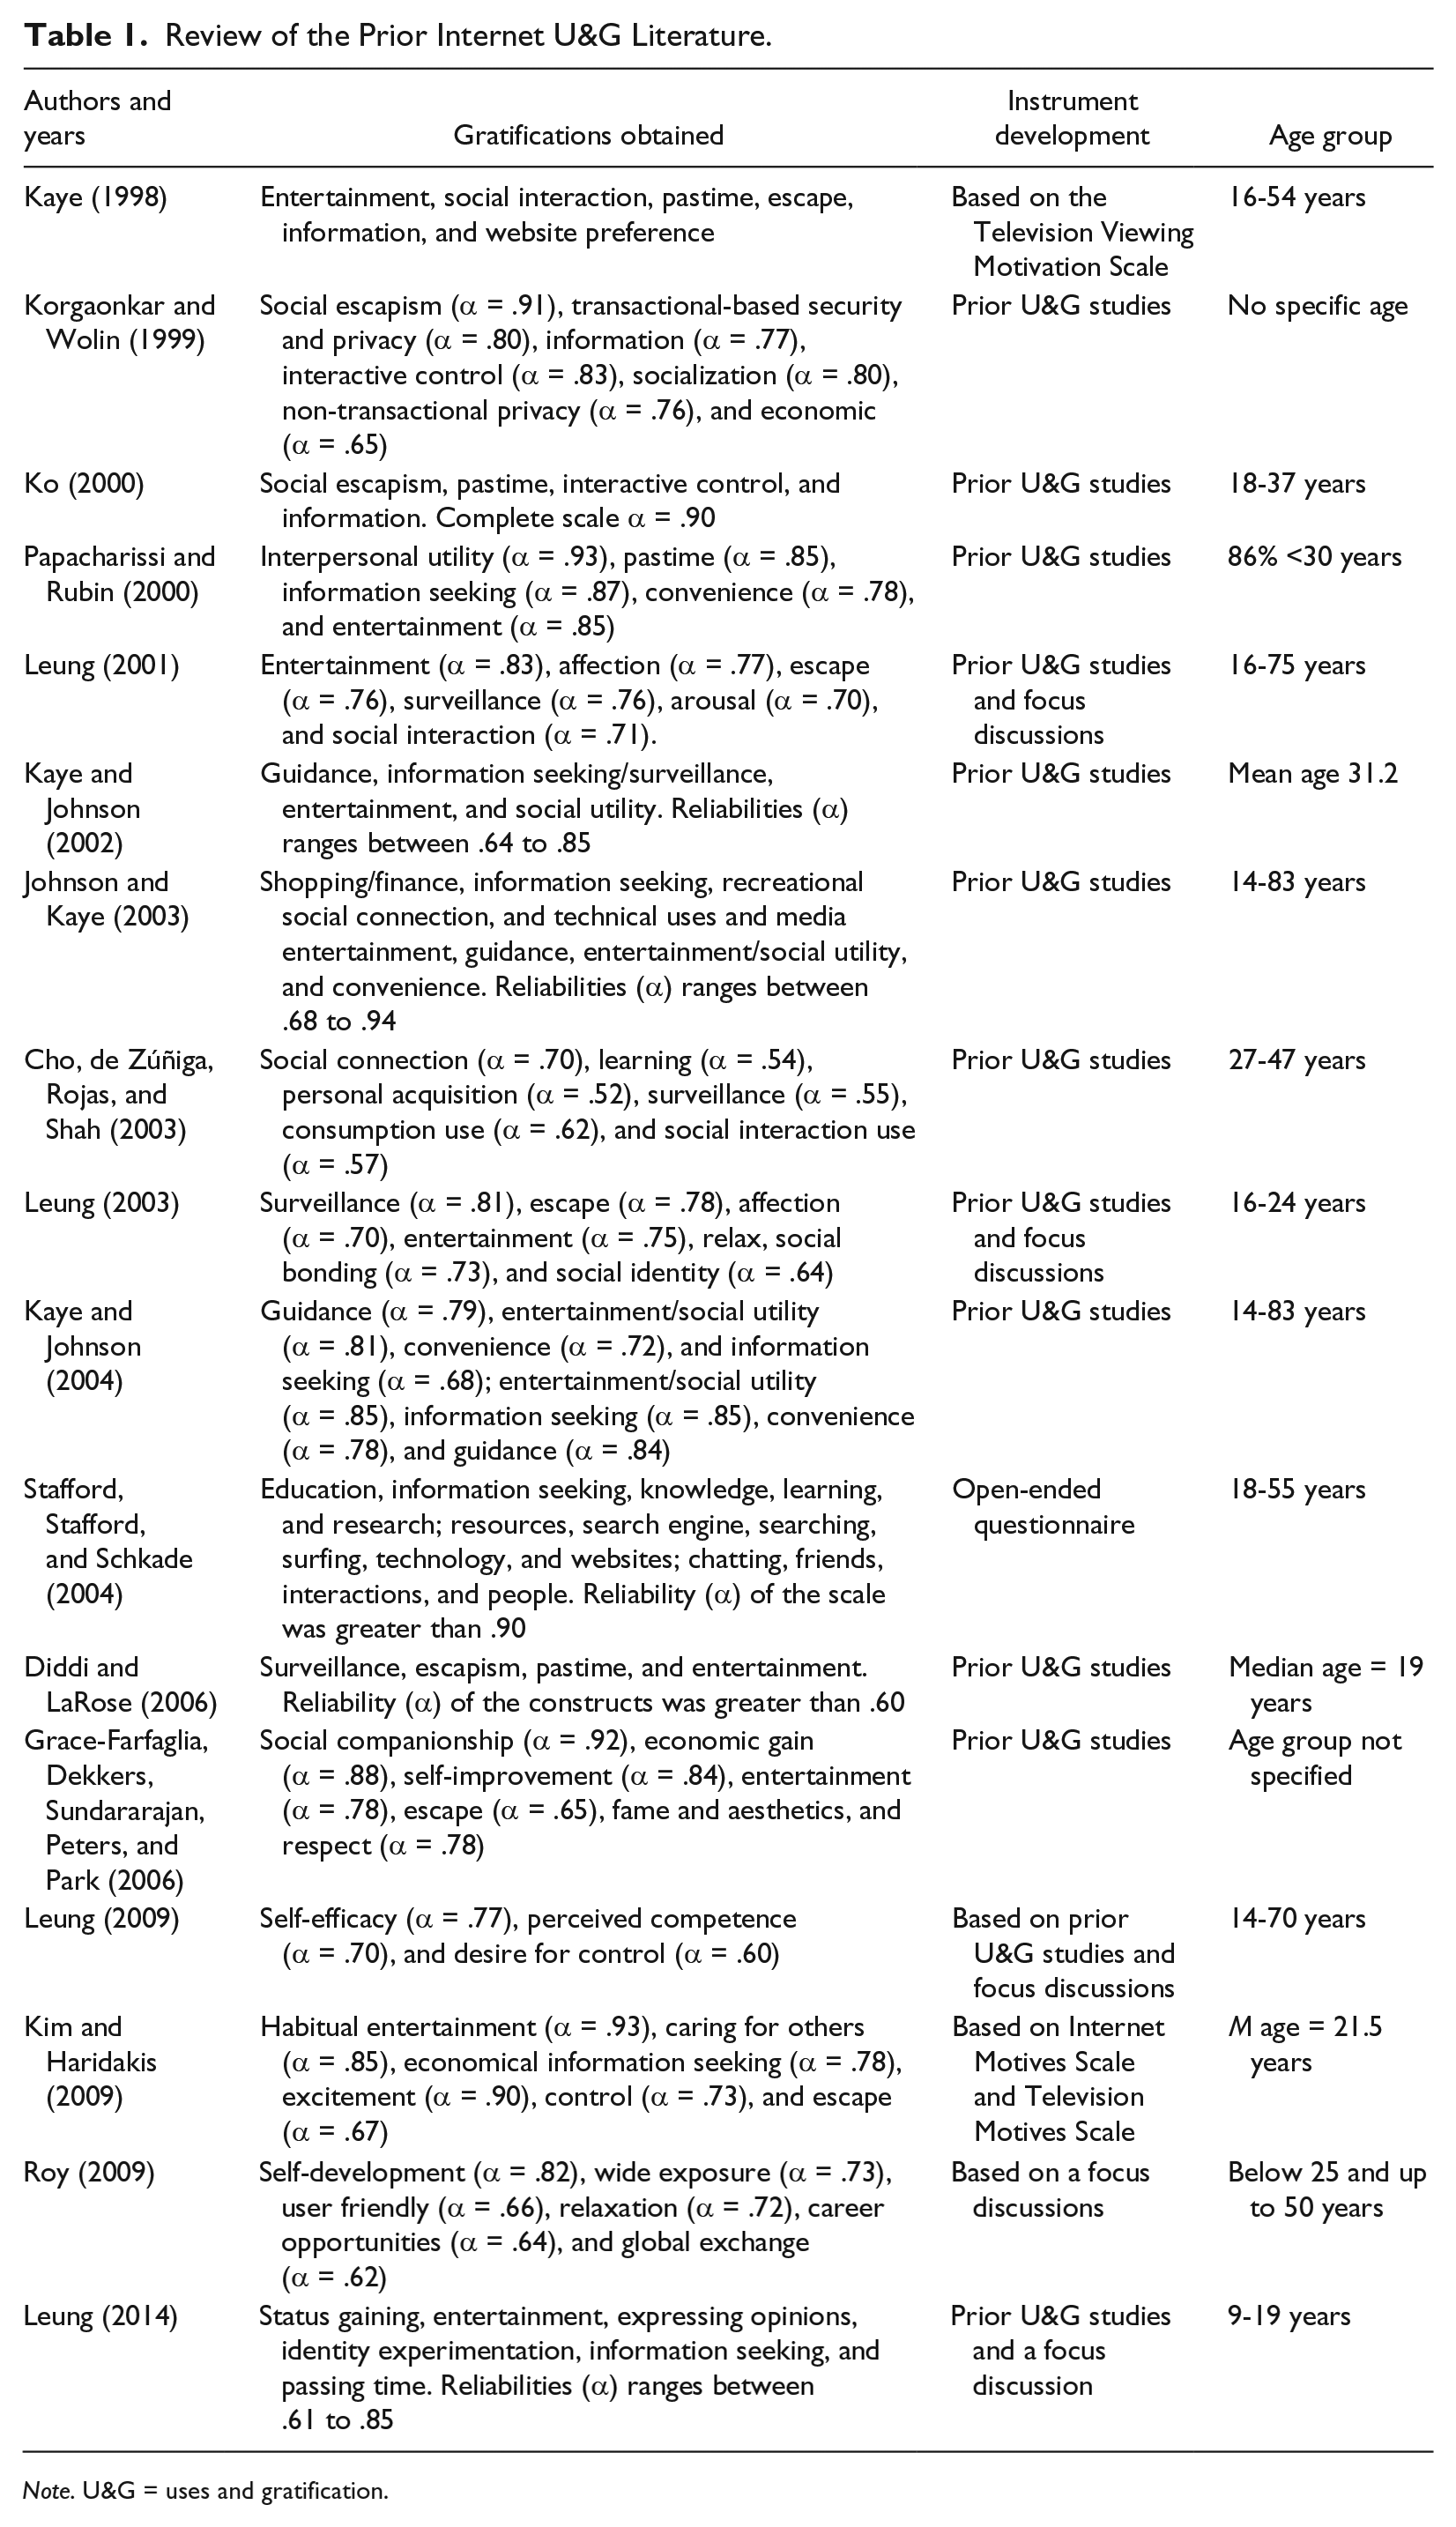
Note. U&G = uses and gratification.
UGT and Internet U&G Measures
The UGT suggests that individuals make use of media platforms to satisfy their own social and psychological needs, such as information seeking, entertainment, connection, and so on (Dimmick, Sikand, & Patterson, 1994; Lin, 1999; Rubin, 1983). Furthermore, UGT explains various psychological needs of users that may influence their motivation and decision to utilize a certain medium to fulfill their needs (Rubin, 1983). Numerous research studies have applied UGT to study the gratifications of television (Rubin, 1983), social networking sites (Park, Kerk, & Valenzuela, 2009), instant messaging (IM) apps (Lo & Leung, 2009), text messaging (Thurlow, 2002), web blogs (Shao, 2009), and the Internet (Korgaonkar & Wolin, 1999; Leung, 2009; Papacharissi & Rubin, 2000; Stafford, Stafford, & Schkade, 2004).
Researchers have documented several attributes of the UGT. It examines the attitude of users toward the use of a given medium and its content (Fagerlind & Kihlman, 2000), because it not only explains the reasons and motivations for using a medium but also explains the way in which people use that particular medium (Roy, 2009). Furthermore, UGT identifies the potential positive and negative implications of individual use of the given medium (Lin, 1999).
A systematic review of the prior Internet U&G literature was performed that concluded with 17 empirical studies examining Internet U&G. The review of this exhaustive list revealed four main approaches of instrument development and utilization. The first approach is based on a qualitative inquiry applying focus discussions, open-ended questionnaires, and interviews with the target users (Roy, 2009). The second approach involves a review of prior U&G studies (e.g., Cho, de Zúñiga, Rojas, & Shah, 2003; Grace-Farfaglia, Dekkers, Sundararajan, Peters, & Park, 2006; Johnson & Kaye, 2003; Kaye, 1998; Kaye & Johnson, 2002, 2004; Ko, 2000; Korgaonkar & Wolin, 1999; Papacharissi & Rubin, 2000; Stafford et al., 2004). The third approach involves summarizing prior Internet gratification scales (e.g., the Internet Motives Scale; Kim & Haridakis, 2009). Multi-level studies were the fourth approach, which involved utilizing prior U&G studies and a qualitative method for the instrument development (e.g., Diddi & LaRose, 2006; Leung, 2001, 2003, 2009, 2014).
The review of 17 previous Internet UGT-based studies also revealed various inherent shortcomings. First, most of the earlier Internet U&G research has focused on adapting or utilizing “gratification instruments” from earlier work, with the most notable reliability evidence being alpha. Only a handful of studies (e.g., Papacharissi & Rubin, 2000; Rubin, 1983) have tried to develop a gratification instrument that has known reliability of scores and validity of inferences. Song, Larose, Eastin, and Lin (2004) also criticized the existing U&G literature for failing to determine gratification instruments that are specific to new media. Furthermore, gratification instruments were developed on a priori theoretical frameworks, rather than using post hoc exploratory factor analysis (EFA; Song et al., 2004). For example, it is likely that a priori theoretical frameworks might be able to present only those gratifications that are already available in the existing U&G literature, whereas post hoc exploratory research might lead to the development of completely new gratification instruments that are not yet known to the U&G field of research. Second, prior Internet U&G literature gave different names to the similar gratification subscales (see Table 1). For example, different subscale names represent similar gratifications (e.g., surveillance, information seeking, and information exchange) all representing the same concept. These different names may not only confuse young media researchers and practitioners, but may also act as a barrier to the development of further understanding of media gratification. Furthermore, these different naming conventions make it difficult for researchers and practitioners to compare their study results with the findings of the earlier research.
To support research in the field of Internet U&G, the UGT was utilized in this study. A number of steps were intentionally taken to address its limitations. First of all, psychometric validation and development of the Internet gratification instrument were carried out through EFA and confirmatory factor analysis (CFA), and estimation of reliability of scores and validity of inferences for the instrument. Then, a large-scale sample was collected from the target user group (i.e., adolescent Internet users), to minimize the sampling error. Moreover, the instrument items were drawn from prior media U&G, Internet U&G studies, and a user study with target users. Finally, pilot testing with target users was performed.
Method
Study Sample and Sampling Procedure
First, a list of 25 schools representing six different cities in northwestern India was randomly drawn from an online directory. The schools were typical private English-speaking institutes that cater to junior and senior high school students from low to upper middle class economic status groups. All schools were contacted via email (subject to the availability of the correct email address) and later via a phone call in January 2012. A total of 14 junior and senior high schools responded positively; however, only 10 schools from four cities finally agreed to participate and were briefed face to face in early May 2012. There were no differences between the schools that agreed and those that refused to participate, because all contacted schools were following similar educational curricula and cater to students of a similar economic status.
Approval for conducting the questionnaire survey was obtained from either the respective school principals or the school management. A copy of the survey was submitted to obtain ethical clearances. In the approval process, the school administrators as well as the students were informed of the purpose of the survey, the aims and the objectives of our research, and its outcomes, and various ethical issues concerning their participation, such as voluntary participation and preserving anonymity.
The researcher then collected a total of 1,914 completed survey sheets from 10 schools representing adolescents aged 12 to 18 years during May-June 2012. The effective response rate for the survey was 97.1%, which is considered normal for paper-based studies (Malhotra, 2007). The survey was prepared in English. The participant’s average age was 14.88 years (SD = 1.44 years), where 61.3% (n = 1,173) of the participants were male adolescents. The percentage of missing data in the 1,914 used cases (representing 78-item scale) was less than 5%. Therefore, the missing data were imputed using the SPSS Expectation-Maximization (EM) algorithm (e.g., Allison, 2001; Pigott, 2001; Schafer & Graham, 2002). The skewness and kurtosis for the items were in the acceptable range of ±1 (Byrne, 2001; George & Mallery, 2003; Hair, Anderson, Tatham, & Black, 1998), thus confirming the normal distribution of the data.
Markopoulos, Read, MacFarlane, and Hoysniemi (2008) have recommended that the presence of teachers during evaluation sessions with young children can serve as a deterrent against possible child abuse, and is important for safety and risk assessment. Furthermore, teachers can help researchers in the efficient organization of the research (e.g., arranging students and classrooms for the evaluation exercise and so on). For these reasons, a researcher together with one or more schoolteachers in the classroom administered the survey. It should be noted that the presence of schoolteachers in the classroom obviously raised concerns about the possibility of coercion for the students to participate. To overcome this limitation, study participation was kept voluntary and anonymous, and participating teachers were clearly informed that students could withdraw from participating at any time during the answering session. Each participating school allocated one or more time slots specifically for answering this survey. All students received equal chances to participate in the study.
Before answering this instrument, all study participants were given the following instructions in both written and oral format (the first author read them aloud to the participants):
The following survey-based study is designed to examine the different Internet uses and motives among Indian adolescents, and the relationship between Internet uses and motives, compulsive Internet use and adolescents’ background characteristics. In this study, Internet uses and motives refers to the motivations and reasons behind using the Internet. The study participants should take into account their overall, or total Internet use in a typical day.
Instrument Development
First, the previous media and Internet U&G studies were rigorously studied and analyzed for the preparation of suitable instrument items. A 90-item pool addressing various Internet gratifications was chosen based on the criteria that items and corresponding subscales represent possible gratifications among adolescent Internet users.
Second, the pool of 90 items drawn from prior literature were discussed and reviewed by a team of two researchers and one professor from a local university in India. The research team performed several iterations, resulting in a list of 74 items. A total of 16 items were excluded either due to duplication, or because they did not hold much relevance for the target user group. The pool of 74 items represented a total of 15 Internet gratifications, namely, information seeking (Johnson & Kaye, 2003; Kaye & Johnson, 2002, 2004; Kim & Haridakis, 2009; Leung, 2014; Papacharissi & Rubin, 2000; Stafford et al., 2004), connection (Cho et al., 2003; Johnson & Kaye, 2003), utility (Johnson & Kaye, 2003; Kaye & Johnson, 2002, 2004; Papacharissi & Rubin, 2000), user friendliness (Roy, 2009), entertainment (Diddi & LaRose, 2006; Grace-Farfaglia et al., 2006; Johnson & Kaye, 2003; Kaye, 1998; Kaye & Johnson, 2002, 2004; Kim & Haridakis, 2009; Leung, 2001, 2003, 2014; Papacharissi & Rubin, 2000), global exchange (Roy, 2009), escape (Grace-Farfaglia et al., 2006; Kaye, 1998; Kim & Haridakis, 2009; Leung, 2001, 2003), exposure (Roy, 2009), affection (Leung, 2001, 2003), coordination (Leung, 2007), convenience and economy (Leung, 2007), self-efficacy (Leung, 2009), social influence (Leung, 2007), socialization (Cho et al., 2003; Grace-Farfaglia et al., 2006; Johnson & Kaye, 2003; Kaye, 1998; Kaye & Johnson, 2002, 2004; Ko, 2000; Korgaonkar & Wolin, 1999; Leung, 2001, 2003; Stafford et al., 2004), and social needs (Leung, 2004, 2009).
Third, the prepared list of 74 items was shown to three high school teachers (science and computer teachers) who were asked to evaluate whether the items addressed the possible Internet gratifications of Indian adolescents. It was noticed during observation exercises in participating schools that science and computer teachers were responsible for Internet-based education or Internet literacy; thus, they were considered as experts and were invited to share their insights on why adolescents use the Internet. The teachers were instructed to cross out any unnecessary or inapplicable items. The process resulted in a change in wording of a few items and the deletion of two irrelevant items; hence, a list of 72 items was utilized in the next stage.
Fourth, a 2-day qualitative inquiry was performed in two participating schools in early May 2012. Qualitative essays written by 20 adolescents, a workshop cum focus discussion with 32 adolescents, informal interviews, and observation exercises resulted in the generation of six new items. It should be noted that these six items did not represent new gratification subscales. Rather, they supported the existing 15 Internet gratifications.
Fifth, the updated list of 78 items was pilot tested with 25 adolescent (12 male and 13 female) students representing the target age group. The pilot test aimed to understand whether any item or statement was confusing, unclear, or meaningless. It began with a short informal interview with each student asked to identify any possible language-related issues with this instrument.
Sixth, the updated instrument was finally evaluated with the 1,914 adolescents (12-18 years) using a 5-point response scale representing strongly disagree = 1, disagree = 2, neutral = 3, agree = 4, and strongly agree = 5. We acknowledge the fact that the “Internet” and “Internet use” is a broad concept, even for a particular age group. For example, adolescents might sometimes use the Internet for socializing, connecting, and coordination, but they sometimes might also use it for information seeking for a school project. For this reason, the study participants were instructed to take into account overall, or total, Internet use in a typical day. Furthermore, the word “Internet” refers to the use of web browsers for accessing different webpages including Facebook, google.com, email clients, and other informational content. An established test, 20-item Internet Addiction Test (IAT; Young, 1998), was administered along with the Internet Gratification Scale to evaluate the convergent validity.
Results
The present study utilized a two-step approach for the development of the proposed instrument (Anderson & Gerbing, 1988) due to the developmental nature of the current study. In the first step, the total collected sample of 1,914 was randomly split into two approximately equal-sized samples, namely, Sample A (n = 977) and Sample B (n = 937). Afterward, EFA was performed using SPSS 21.0 and Sample A to examine the factorial structure of the instrument. In the second step, the factorial structure was confirmed using AMOS 21.0 through CFA using Sample B.
EFA
The EFA utilized the maximization likelihood (ML) method with “Promax rotation,” and items with a factor loading below .50 were deleted (Chin, 1998; Hair, Anderson, Tatham, & Black, 2006). The null hypothesis that the correlation matrix was an identity matrix was rejected using Bartlett’s statistic test (Bartlett, 1954); it was significant (χ2 = 16,469.5, df = 496, p < .01). The Kaiser-Meyer-Olkin (KMO) test (Kaiser, 1970) returned a value of 0.92 (excellent; Hair et al., 2006), which shows that the empirical data were fit for performing EFA. The final EFA of 27 items resulted in six latent factors with an eigenvalue >1.0 as per the Kaiser Criterion (see Table 2). All six gratification subscales had α > .80 (DeVellis, 2003; Tavakol & Dennick, 2011). These six factors together accounted for 66.32% of the total variance explained for Internet use, and are explained as follows (see Table 2):
Rotated Factor Loadings, Cronbach’s Alpha Values, Means, and Standard Deviations (n = 977).

Note. The total variance explained: 66.32%. IS = information seeking; CC = connection; ET = entertainment; EX = exposure; SI = social influence; CE = coordination.
Information seeking (IS)
IS refers to Internet users’ internal desire to increase their own knowledge and skills and make themselves aware of themselves, others, and the outside world (Shao, 2009). In the present study, IS was interpreted as the utilization of the Internet to seek information (e.g., learning new things, learning how to do things, learning about the latest news) and also providing others with information.
Exposure (EX)
This construct delineates the process of utilizing the Internet for gathering information about different educational opportunities, accessing career and job opportunities, and using the Internet to get a wide range of exposure and knowledge.
Connection (CC)
CC focuses on the use of the Internet to connect with others (e.g., peers, friends, and family) through the means of online chatting, online discussions, and emails.
Coordination (CE)
A user may access the Internet for coordination purposes (e.g., using the Internet to arrange, organize, or confirm how and when to communicate with friends and family).
Entertainment (ET)
ET means to use the Internet for entertainment purposes (e.g., use of the Internet is entertaining, fun, and enjoyable).
Social influence (SI)
SI is to use the Internet to look fashionable, gain prestige or status in one’s own peer network, and display one’s own Internet activity to friends, peers, or family. The SI gratification is also linked closely with peer pressure. For example, an adolescent may feel that if everyone else uses the Internet, then he or she should do the same. Previous literature has utilized “Fashion” to represent SI, but we argue that Fashion represents something which is transient, short term, and temporary. In comparison, Internet gratifications are becoming more and more embedded in our daily lives.
Parallel Analysis (PA) for Factor Extraction
In the psychometric literature, it has been argued that PA should be utilized for factor extraction (e.g., Hayton, Allen, & Scarpello, 2004; Henson & Roberts, 2006). However, in the present study, the PA results were considered but rejected in favor of a structure that seemed more meaningful or interpretable. The main reasons were as follows: first, prior literature suggests that PA can underfactor the correct number of factors, which is potentially a more serious problem than overfactoring (e.g., Turner, 1998). Due to this, researchers must examine the goodness of model fit for the factorial structure obtained from the PA.
In the present study, PA based on minimum rank factor analysis (Timmerman & Lorenzo-Seva, 2011) was performed using Sample A, and recommended a three-factor structure for the 27-item instrument. Factor 1 contains information seeking and exposure combined together; Factor 2 consists of three U&Gs, namely, connecting, coordination, and entertainment; and Factor 3 represents only the social influence U&G. This three-factor structure extracted using PA was later examined using CFA and resulted in a poor model fit (e.g., Sample A returned χ2 = 2,948.902, df = 321, χ2/df = 9.20, comparative fit index [CFI] = .80, Tucker–Lewis index [TLI] = .78, root mean square error of approximation [RMSEA] = .09; Sample B returned χ2 = 2,806.90, df = 321, χ2/df = 8.74, CFI = .80, TLI = .78, RMSEA = .09). This confirms that the three-factor structure does not represent our Internet U&G instrument.
This claim is further strengthened by the fact that the obtained three-factor structure is also not consistent with the theoretical foundation of Internet U&Gs. Stafford et al. (2004) classified Internet U&Gs into three categories, namely, content, process, and social gratifications. However, in comparison, the PA-based three-factor structure combined social and process U&Gs (e.g., connecting, coordination, and entertainment) into a single dimension. These findings are also consistent with the observations of Henson and Roberts (2006), which also suggests that in factor analysis, the most important aspect is the meaningfulness of the latent factors. Similarly, Mulaik (1987) also argued that “it is we who create meanings for things in deciding how they are to be used” (p. 301).
CFA
The CFA of 27-item Internet U&G representing six-factor structure was performed using ML estimator. The standardized factor loadings were above .50 for all items. Prior literature has recommended cut-off score for a good model fit namely χ2/df < 3, CFI ≥ .92, RMSEA < .08, and TLI ≥ .92 (Anderson & Gerbing, 1988; Byrne, 2001; Hu & Bentler, 1999). The CFA results suggest that six-factor structure has good model fit (χ2/df = 3.74, CFI = .94, TLI = .93, RMSEA = .05). It should be noticed that χ2/df was greater than 3.0. However, Pratarelli and Browne (2002) recommended that χ2/df is dependent on the sample size and due to this, other goodness-of-fit indices should be considered.
Validity and Reliability
This study has estimated the reliability of scores and validity of inferences for the instrument, which is consistent with the recommended standards (e.g., American Educational Research Association, American Psychological Association, & National Council on Measurement in Education, 2014; Newton & Shaw, 2013). This study has utilized the recommended structural equation modeling (SEM) terminology for estimation of the reliability of scores and validity of inferences for the instrument (see Hair et al., 2006).
Discriminant validity
The correlational results between scores on a measure and scores on other theoretically dissimilar measures provide evidence of discriminant validity. When strong validity evidence exists, there is a higher probability that a given inference is correct. The average variance explained (AVE) measures the average variance shared between a construct and its subscale and should be at least .50. AVE is calculated through computing the sum of the square of all the factor loadings and dividing it by the sum of the square of all the factor loadings plus the sum of error variance. The AVE values for all six subscales were greater than the variance between any given subscale and the other measures (Barclay, Higgins, & Thompson, 1995), the correlation between any two gratification subscales did not exceed .80 (Campbell & Fiske, 1959), the square root of AVE was greater than the off-diagonal elements in most cases, and AVE was greater than the maximum shared variance (MSV) and the average shared variance (ASV; Hair et al., 2006). Therefore, this evidence supports the discriminant validity of the instrument (see Table 3). The MSV indicates how well the subscale is explained by the items of the other subscales whereas ASV indicates the average of the squared variances explained by items of other subscales.
Validity and Reliability of the Internet Gratification Scale.
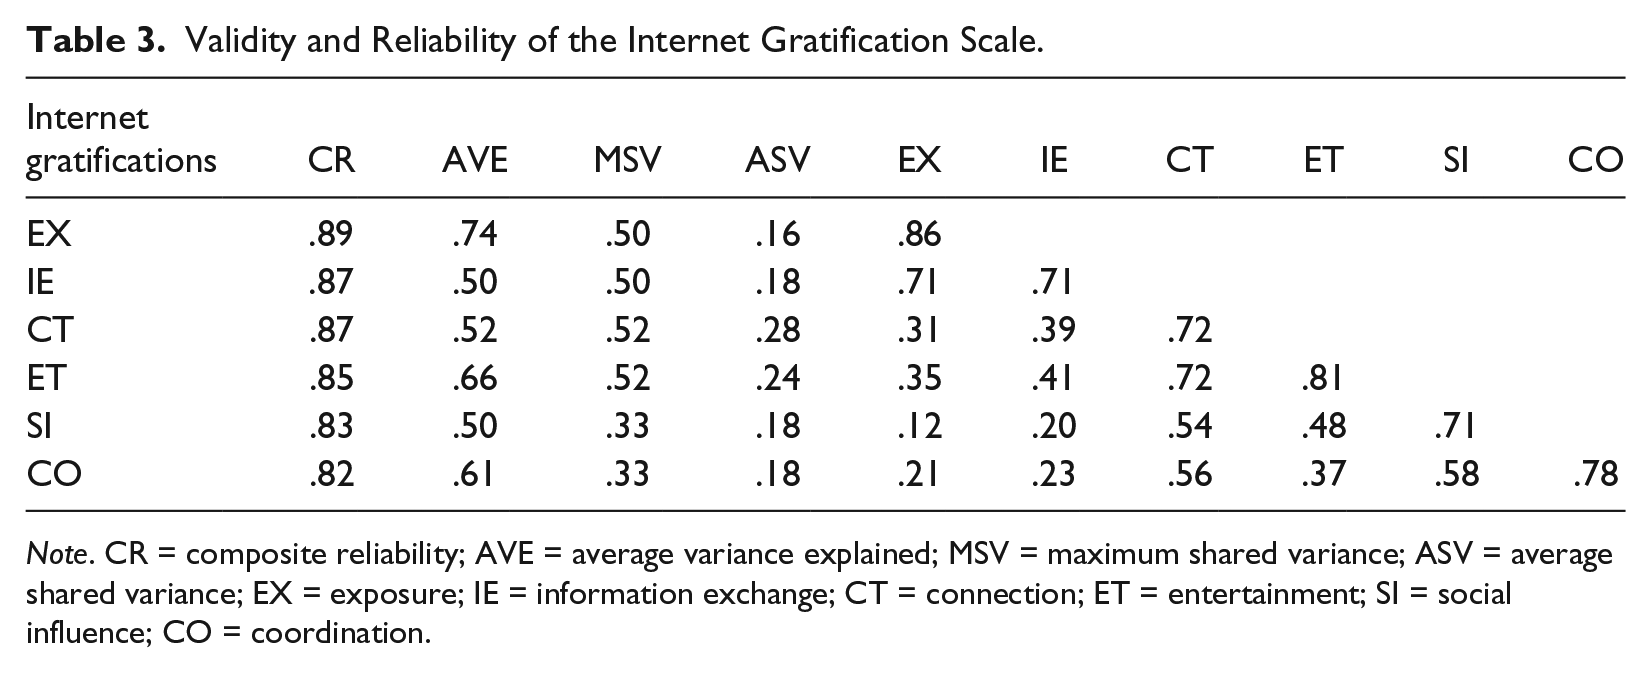
Note. CR = composite reliability; AVE = average variance explained; MSV = maximum shared variance; ASV = average shared variance; EX = exposure; IE = information exchange; CT = connection; ET = entertainment; SI = social influence; CO = coordination.
The diagonal values in the right half of the table are the square root of the corresponding AVE value, and the non-diagonal values represent the correlations between the six Internet U&Gs.
Convergent validity
The correlational results between scores on a measure and scores on other theoretically similar measures provide evidence of convergent validity. The factor loadings for all the gratification items were greater than .50 (Carmines & Zeller, 1979), composite reliability (CR) for each of the six subscales exceeded the .70 threshold limit (Molina, Montes, & Ruiz-Moreno, 2007; Nunnally, 1978; Werts, Linn, & Jöreskog, 1974), and AVE for all subscales was either greater than or equal to .50 (Anderson & Gerbing, 1988; Kline, 1998; Table 3). The CR was computed as the square of the sum of all the loadings and dividing it by the square of the sum of all the loadings plus the sum of error variance (Nunnally, 1978). We choose CR rather than omega because many authors have suggested that coefficient of omega is equal to CR (Graham, 2006; Zinbarg, Revelle, Yovel, & Li, 2005). The validity of inferences provides evidence that supports the convergent validity of the instrument (see Table 3).
Score reliability
The score reliability informs whether the observed items are sufficiently reliable with low measurement error or not (Cronbach, 1951). All six gratification factors had an adequate Cronbach’s alpha value; thus, the present results support the reliability of these scores (Cronbach & Meehl, 1955; Nunnally & Bernstein, 1994; Table 3). Previous literature has indicated that Cronbach’s alpha can overestimate or underestimate the true scale reliability (Peterson & Kim, 2013; Raykov, 1998). For this reason, CR for all six Internet gratifications was also calculated, and it was found that they were all above .80. According to Peterson and Kim (2013), CR and alpha are roughly exchangeable with little difference between them except a tendency for CR to be slightly higher. This is exactly what we also observed in the current study (see Tables 2 and 3).
Discussion and Implications
The present study has estimated the reliability of scores and validity of inferences of a 27-item instrument that examines different Internet U&G among 1,914 adolescent Internet users. Consequently, this study provides evidence to support the interpretation of scores derived from the Internet Gratification Scale for adolescents. This instrument is composed of six dimensions representing six Internet gratifications, namely, information seeking, exposure, connection, coordination, entertainment, and social influence. On comparing these six Internet U&G with the prior Internet U&G, it was found that three Internet gratifications of the present study, namely, information seeking, entertainment, and interpersonal utility/companionship (connection), were consistent with the prior literature. This shows that entertainment, connection, and information searching have continued to be the major reasons for using the Internet since the last decade.
Furthermore, three new gratifications that were not addressed by the previous Internet motives scales were identified as exposure, social influence, and coordination. These new gratifications present the way in which adolescents currently utilize the Internet. For example, the Internet is now considered as the most convenient mechanism for coordinating different daily routine activities. Similarly, adolescents consider the Internet as an important source of exposure to new happenings around the world, and for receiving new information and knowledge related to education as well as their future careers. The emergence of “social influence” as one important Internet U&G suggests that the Internet has now become a matter of prestige or a trend among adolescent Internet users. Furthermore, adolescents make use of the Internet not only for the satisfaction of their content and social needs, but rather because they want to use it to receive recognition from others, to not look different, and also to maintain their membership of their existing social circle of close friends who also use the Internet.
This instrument has a number of benefits. First, it could help us to understand the potential U&G of a given medium or behavior. It will enable researchers and practitioners to investigate the development of the U&G of a specific medium, by a specific user group (e.g., adolescents, adults, older users) over time. Furthermore, this instrument can help researchers to compare results across different studies if the same instrument is utilized. It can also help managers and administrators to understand the behavior and motivations of their existing and prospective customers regarding their services or products.
Moreover, schoolteachers and educational psychologists can utilize this instrument to gain a better understanding of the gratification needs of adolescents, for example, why adolescents utilize a given mobile IM application or a social media site. The obtained gratification structure can help teachers and educational psychologists to refine or even redefine their information technology (IT)–based educational aids to adapt IT support systems to the needs of their adolescent students. This may change the existing IT support systems in schools and transform them to be more economical, interesting, and enjoyable for students. For example, the inclusion of collaborative blogging in schools can enable students to express, present, and discuss their classroom learning with peers. If the blogging system supports information seeking, exposure, connection, coordination, entertainment, and social influence, then students might continue using it without any external pressure from teachers or the school administration. In this way, specially designed Internet-based utilities that take into consideration the six Internet gratifications sought by adolescents will enable adolescent students to channel their energy and time into more productive activities.
The study findings also provide opportunities for the advancement of businesses aimed at adolescents. In addition to this, the study results support the development of more user-friendly Internet-based services, and also support the business of Internet service providers. For example, it was found that adolescents value “content gratifications” (exposure and information seeking). In response, service companies can offer Internet-based products (e.g., educational games, career-oriented content), and content that enhances adolescents’ existing knowledge base, thereby gaining more exposure.
Adolescents value “process gratification” (entertainment and social influence). This particular finding has important implications for service designers and especially user-interface developers, for example, when designing an Internet-based educational utility that is fun to use, entertaining, and enjoyable for adolescents. The gratification factor “social influence” points out that adolescents look for fashionable Internet-based utilities that are both trendy and satisfy their need to possess “status” in the eyes of their friends and the online community in general. Therefore, an important design consideration for service designers will be to develop Internet-based services that look fashionable and are a status symbol for adolescent Internet users.
Similarly, adolescents value “social gratifications” (connection and coordination), which clearly indicates that they view the Internet as a medium for connecting and coordinating with others. Therefore, service companies should develop newer Internet-based services that enable adolescents to connect and coordinate with their peers, friends, and family.
Study Limitations and Future Work
The present study is not without limitations regarding the generalizability and applicability of the findings to a wider context. This article concludes with the presentation and discussion of three main limitations, which may make researchers and practitioners proceed with caution when interpreting and utilizing the findings of our study. First, the present study recruited adolescent Internet users from four cities in the northwest of India, all of who belong to a specific economic status group (i.e., low to middle income families). Therefore, the generalization of the present study results to the rest of India is a matter of concern.
Second, the study participants were drawn from the English-speaking community of schools, while state education board–affiliated schools were not surveyed. Therefore, it might be possible that the statistics presented in the context of Internet U&G might be different if students from state education board–affiliated schools were involved.
Third, the content of the Internet gratifications proposed in the present study might be revised due to the fact that Internet use has witnessed rapid changes in the last 3 years (the study was conducted in May 2012). For example, the Indian market witnessed the emergence of mobile-based IM applications such as WhatsApp and Viber at the end of 2012. At that time, adolescents were utilizing Facebook, Google Talk, email (a delayed response mechanism), and various other websites for coordinating, arranging, and organizing different activities. However, now, adolescents utilize mobile IM applications, Facebook, and other forms of social networking sites for coordination. Therefore, other researchers who want to use this instrument in future research should estimate its content validity with the target population to ensure that the subscales and items are valid.
Fourth, the 27-item Internet gratification instrument requires further validation in other cultures and with different demographic groups, because this study estimated the reliability of scores and validity of inferences in the context of Indian adolescents. Therefore, we recommend that other U&G researchers and practitioners conduct panel, longitudinal, and cross-cultural studies examining Internet U&G. These limitations will enable the research community to gauge the present study findings through the lens of generalizability.
Fifth, the present study’s choice of criterion of .50 for factor loadings in the EFA could have led to subscale underrepresentation. This choice also affects the factor results and the survival of many items; of 15 gratifications, only six survived in the final instrument.
For future work, we recommend that U&G researchers and practitioners develop and validate similar instruments to understand the U&G of other forms of media, including mobile IM (e.g., Viber, WhatsApp, Snapchat) and social media platforms (e.g., Facebook). The content validation for the 27-item instrument is currently unknown, and thus we recommend that other scholars examine the content validity of our scale. In addition to this, researchers should also examine the measurement invariance of this instrument across ages and genders by examining the configural, metric, and scalar invariances.
Footnotes
Declaration of Conflicting Interests
The author(s) declared no potential conflicts of interest with respect to the research, authorship, and/or publication of this article.
Funding
The author(s) disclosed receipt of the following financial support for the research, authorship, and/or publication of this article: We acknowledge the generous support received from the Academy of Finland, Mind the Gap (Project Number 1265528) and Academy of Finland Researcher’s mobility grants (Decision No. 265969, 277571, 290038, 298098).