
Abstract
Researchers examined the concurrent and predictive validity of a brief (12-item) teacher-rated school readiness screener, the Kindergarten Student Entrance Profile (KSEP), using receiver operating characteristic (ROC) curve analysis to examine associations between (N = 78) children’s social-emotional (SE) and cognitive (COG) readiness with measures of behavioral/emotional risk and early literacy skills throughout kindergarten. Results indicated statistically significant associations between both subscales of the KSEP (SE and COG) with all outcome variables. Findings provide validity evidence in support of the KSEP as an initial gate in the universal screening process to inform educators on the readiness of incoming kindergarteners.
Kindergarten is the first formal year of schooling for most children, as approximately 98% of children in the United States attend kindergarten at school entry (Zill & West, 2001). Often, kindergarten provides the earliest opportunity to provide services to children in a single setting (Feeney-Kettler, Kratochwill, Kaiser, Hemmeter, & Kettler, 2010) and is an ideal time to identify and address early emotional, behavioral, and academic difficulties (Feeney-Kettler et al., 2010). Early identification and intervention is critical to the academic and social-emotional (SE) development of children, with documented benefits of early intervention in literacy (Denton, Fletcher, Anthony, & Francis, 2006) and emotional/behavioral functioning (Webster-Stratton & Reid, 2003).
The Kindergarten Student Entrance Profile (KSEP; Quirk, Rebelez, & Furlong, 2014) was developed to provide educators with an efficient universal screening tool for use during the first month of kindergarten. The KSEP assesses COG and SE aspects of kindergarten readiness, which is unique from many screeners that focus on either academic or SE functioning (Quirk, Furlong, Lilles, Felix, & Chin, 2011). Previous research has provided a foundation of psychometric evidence supporting the KSEP. KSEP ratings have been associated with a variety of academic outcomes throughout elementary school (Lilles et al., 2009; Quirk et al., 2011; Quirk, Grimm, Furlong, Nylund-Gibson, & Swami, 2016; Quirk, Nylund-Gibson, & Furlong, 2013). Research has also yielded evidence supporting the two-factor structure of the scale (Quirk et al., 2014), including evidence of invariance across student characteristics (Quirk, Mayworm, Edyburn, & Furlong, 2016; Quirk, Mayworm, Furlong, Grimm, & Rebelez, 2015). However, research has not yet examined whether cut points on the KSEP are useful in predicting problems later in kindergarten. Sensitivity, specificity, positive predictive values (PPV) and negative predictive values (NPV) merit attention when examining the predictive validity of a screener (Glover & Albers, 2007). Sensitivity is described as the proportion of students with problems who are detected by the screener (i.e., true positives). Specificity indicates the proportion of students without problems who are identified by the screener (i.e., true negatives). PPV refers to the proportion of students with positive screens who actually have problems, and NPV indicates the proportion of students with negative screens who do not have problems.
To improve interpretability of KSEP ratings and provide foundational psychometric information lacking in its current research base, it is necessary to investigate the concurrent and predictive validity of KSEP ratings with established measures of early literacy and emotional/behavioral functioning. The following research questions were examined:
Method
Participants
Participants included 78 students (42 males) from four kindergarten classes in a public elementary school in California. When initially screened, 22% (n = 17) of the students were 4 years old and 78% (n = 61) were 5 years old. Participants were 67.9% Latino/a, 19.8% Anglo, 3.7% Asian American, 3.7% multiracial, 2.5% African American, 1.2% Native American, and 1.2% Filipino. Approximately 65% of the students were from families experiencing low income and were eligible for free or reduced-price lunch.
Instruments
School readiness
The KSEP (Quirk et al., 2014) is a brief, 12-item observational rating scale designed to assess children’s SE (six items) and COG (six items) readiness at the time they enter kindergarten. Teachers complete KSEP ratings based on observations and interactions with students during the first month of the academic year on a 4-point scale (1 = not yet, 2 = emerging, 3 = almost mastered, 4 = mastered) using a rubric that provides operational definitions and behavioral exemplars. Average ratings across items on each KSEP subscale ranged from 1 to 4, with an average rating of 4 indicating that a child has “mastered” every item on that subscale. Previous research (Quirk et al., 2014) has supported the two-factor structure of the KSEP and the reliability (SE, α = .88 and COG, α = .81) of KSEP ratings.
Early literacy
The STAR Early Literacy (RenSTAR; Renaissance Learning, 2009) assessed children’s academic risk status, with scores below the 25th percentile indicating risk (Fletcher, Francis, Morris, & Lyon, 2005). RenSTAR is a computer-adaptive curriculum-based measure comprised of 30-item tests assessing kindergarten students’ reading readiness skills (e.g., phonemic awareness, vocabulary). Previous research has found evidence supporting the reliability of RenSTAR scores and the validity of their use as a standardized measure of literacy achievement (Renaissance Learning, 2009).
Behavioral/emotional risk
The BASC-2 Behavioral and Emotional Screening System (BESS; Kamphaus & Reynolds, 2007) teacher rating scales (TRS) were used to assess children’s behavioral/emotional risk. The TRS includes ratings on a 4-point scale for each item (1 = never, 2 = sometimes, 3 = often, and 4 = almost always), and item responses provide a T-score with higher item ratings indicating higher risk (Kamphaus & Reynolds, 2007). T-scores between 20 and 60 indicate normal risk, scores between 61 and 70 suggest elevated risk, and scores of 71 or higher are categorized as extremely elevated. To facilitate analyses, each student with a T-score of 61 or higher was classified as having emotional/behavioral risk. Psychometric properties and information on scale development are available in the manual.
Procedure
All activities were approved by an institutional review board, which included active consent from all participants. The participating school was selected due to their expressed interest in early screening and an ongoing collaboration with the researchers. All kindergarten teachers at the participating school completed a 2-hr training on how to administer the assessments. Teachers completed KSEP ratings for all students during the first month of kindergarten and BESS ratings for all students at two time points (fall/spring). Students completed the RenSTAR in the fall/spring of kindergarten.
Results and Discussion
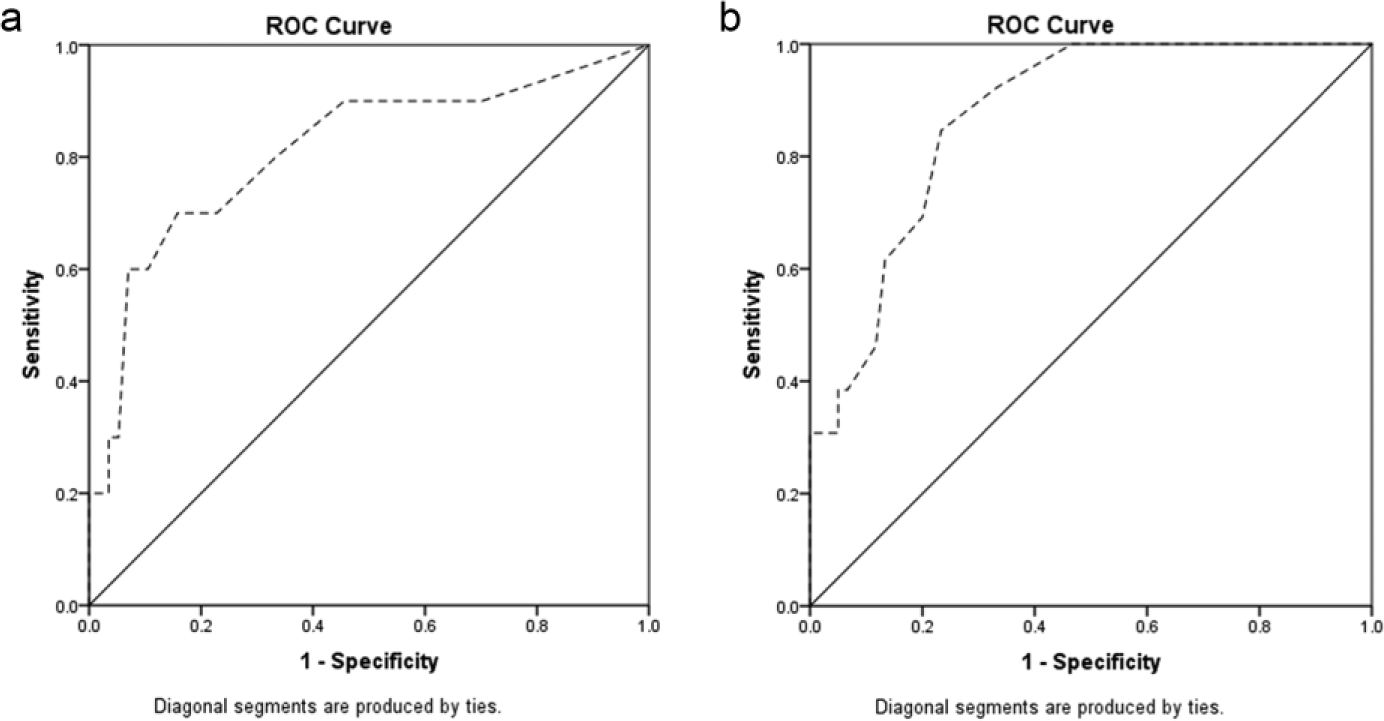
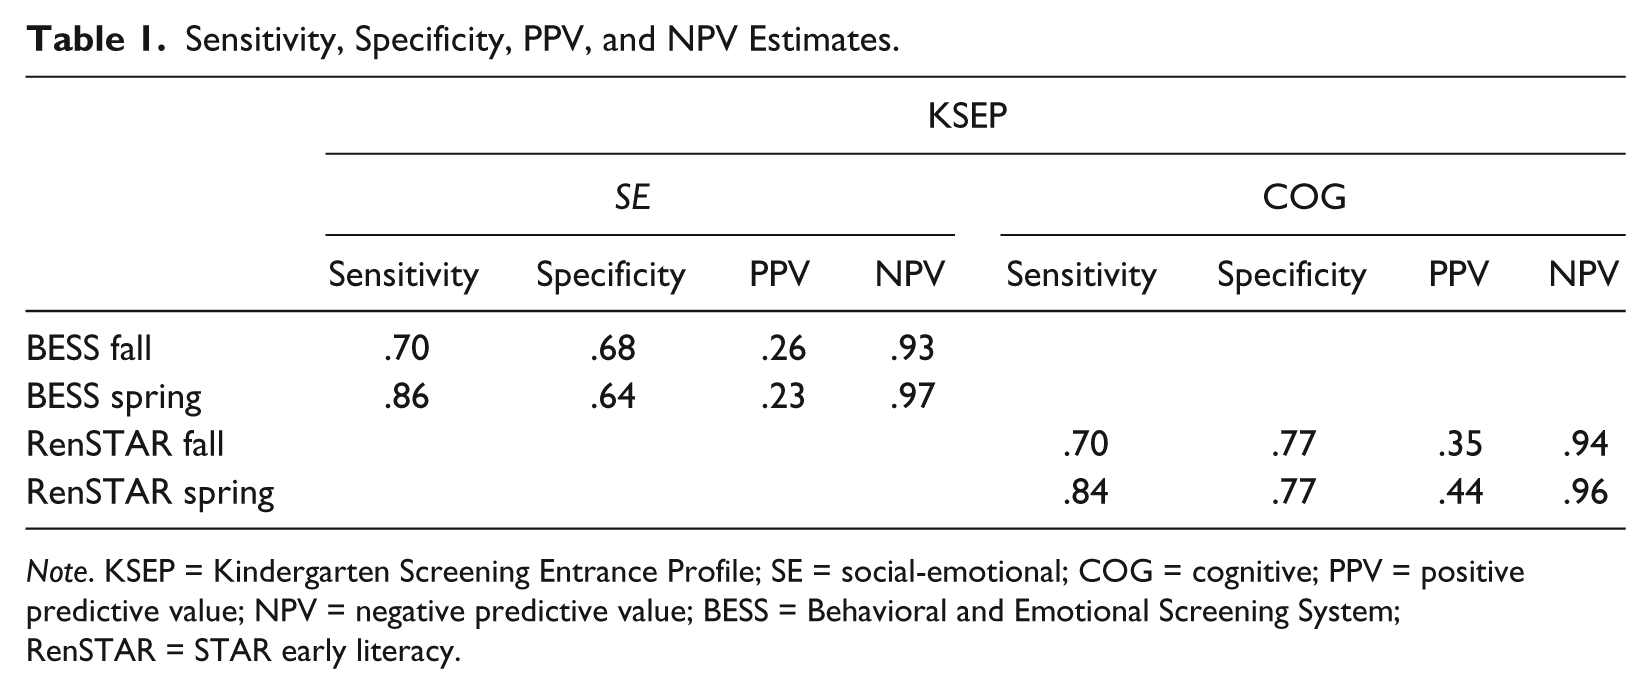
First, ROC curve analyses were conducted to assess the area under the curve (AUC) for use of (a) the KSEP SE in predicting BESS risk classification in the fall and spring and (b) the KSEP COG in predicting RenSTAR classifications in the fall and spring. In the fall and spring, 13.9% and 11.3% of students were classified as at risk by the BESS, and 14.9% and 17.8% of students were classified as at risk by the RenSTAR, respectively. As seen in Figure 1, AUCs were 0.79 and 0.80 for prediction of BESS risk classification in the fall and spring, respectively. AUCs were 0.81 and 0.87 for prediction of RenSTAR classification in the fall and spring, respectively (Figure 2). All AUCs were in the fair (.70-.79) to good (.80-.89) range (Youngstrom, 2014). Results indicate that KSEP scale scores did equally well at predicting behavioral/emotional and academic risk, both concurrently and longitudinally.

ROC Curve analysis with KSEP SE scores predicting (a) fall and (b) spring BESS classification.
ROC Curve analysis with KSEP COG scores predicting (a) fall and (b) spring RenSTAR classification.
Second, ROC curve analyses were used to determine optimal cut scores for risk on each of the KSEP domains. The pivot point was identified based on a leveling off of sensitivity accompanied by a decrease in specificity across the cut scores. This is depicted by the flattening out of the AUC at a sensitivity of approximately 0.80 in both curves in Figure 1. The goal in choosing a cut score was to find the point at which sensitivity and specificity were both as close to .75 or higher as possible, which is considered desirable (Glover & Albers, 2007; Levitt, Saka, Romanelli, & Hoagwood, 2007). However, what is seen as desirable varies across instruments and uses. If, for example, the consequences of a false positive are worse than the consequences of a false negative, then a lower PPV or NPV may be desirable. Based on examinations of sensitivity and specificity in predicting the outcomes of interest, cut scores between 3.25 and 3.40 emerged as the pivot point for each comparison. As the 40th percentile was 3.33 for both KSEP domains and was situated in the middle of the target range, 3.33 was chosen as the cut-point for risk status for both KSEP subscales (SE and COG). These results are consistent with previous research indicating children rated in these ranges have a stronger likelihood of academic success across the elementary grades (Quirk et al., 2011; Quirk et al., 2016).
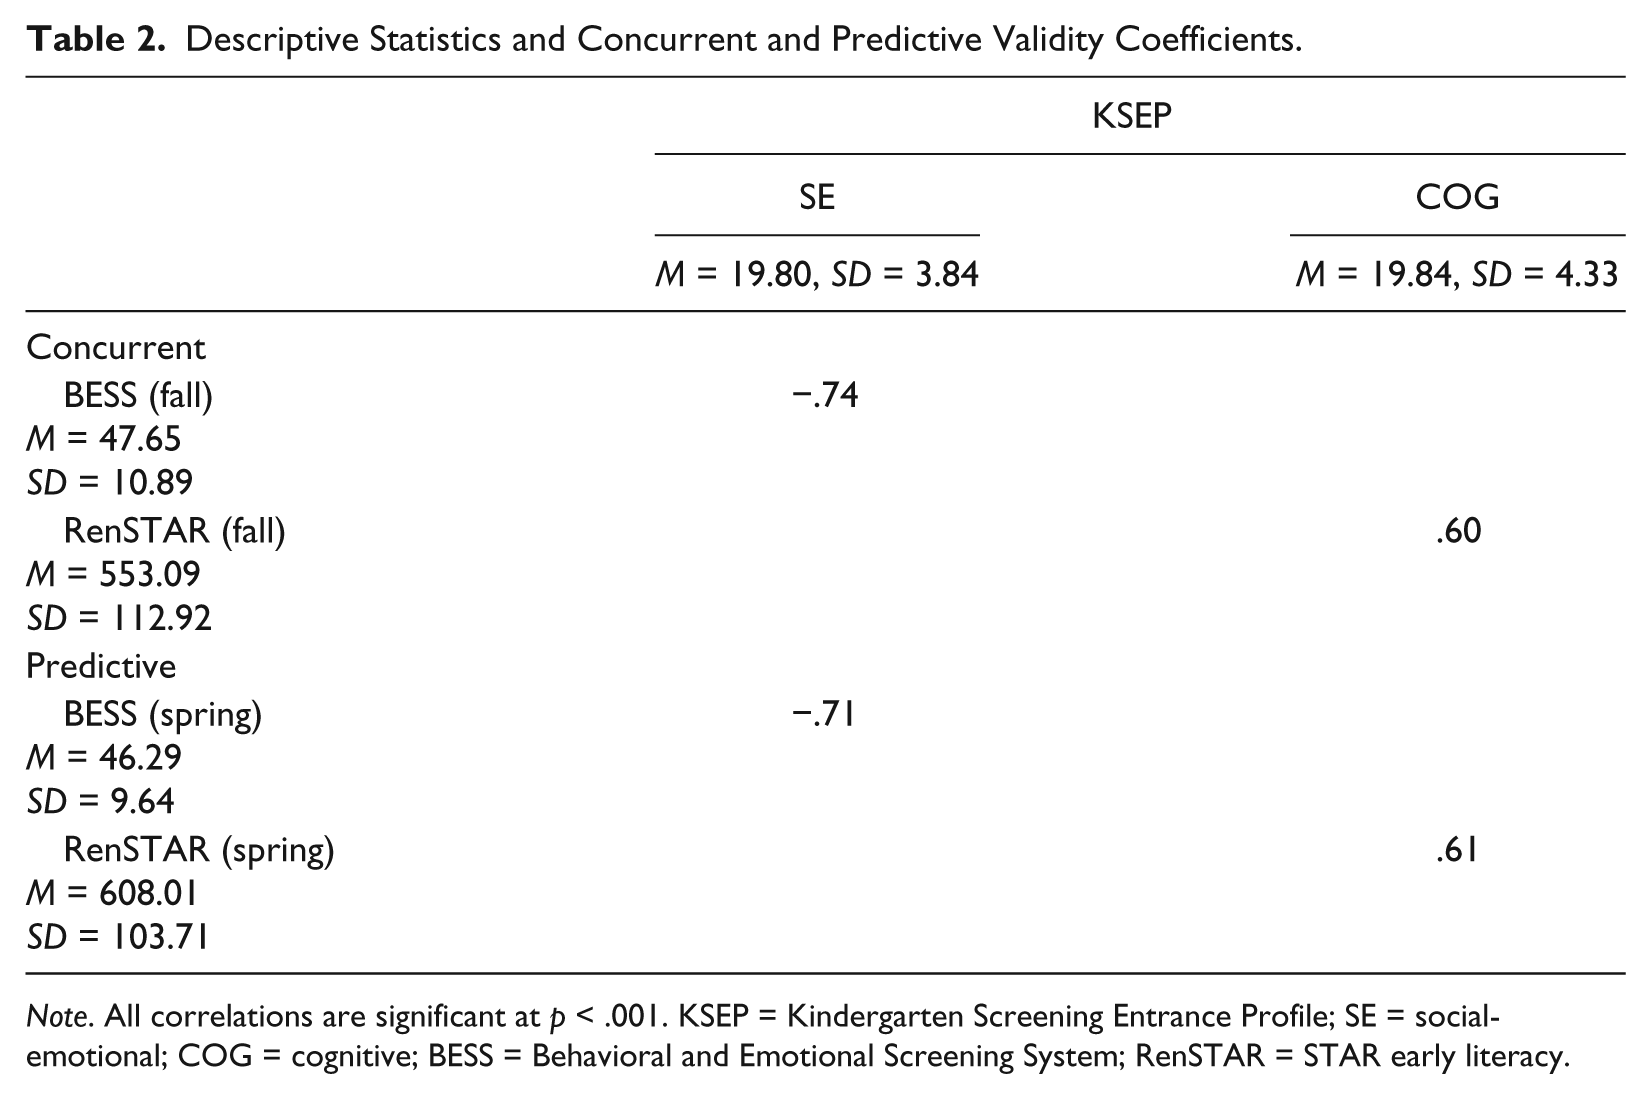
Sensitivity, specificity, PPV, and NPV estimates were calculated using 3.33 as the cut score for risk on the KSEP SE and COG to predict risk status on the BESS and RenSTAR, respectively. Results in Table 1 indicate that sensitivity and NPV were strengths of the KSEP SE and COG risk scores. Sensitivity and PPV estimates are often considered the most important within a screening context, as low-sensitivity values may lead to under-identification of at-risk students, and low PPVs indicate a greater chance of over-identifying at-risk students (Glover & Albers, 2007). Sensitivity estimates suggest that KSEP catches most students presenting with social/emotional and academic problems. However, low-PPV estimates indicate that additional assessment, such as proposed within multiple-gating screening frameworks (Glover & Albers, 2007), could provide further differentiation between students who do/do not present with behavioral/emotional or academic problems.
Sensitivity, Specificity, PPV, and NPV Estimates.
Note. KSEP = Kindergarten Screening Entrance Profile; SE = social-emotional; COG = cognitive; PPV = positive predictive value; NPV = negative predictive value; BESS = Behavioral and Emotional Screening System; RenSTAR = STAR early literacy.
Finally, KSEP subscale scores were correlated with BESS and RenSTAR scores in the fall (concurrent) and spring (predictive). Table 2 presents these coefficients, all of which were in the anticipated direction and ranged from .60 to .74.
Descriptive Statistics and Concurrent and Predictive Validity Coefficients.
Note. All correlations are significant at p < .001. KSEP = Kindergarten Screening Entrance Profile; SE = social-emotional; COG = cognitive; BESS = Behavioral and Emotional Screening System; RenSTAR = STAR early literacy.
Several limitations deserve mention. First, generalizability is limited due to the size and characteristics of the sample. In addition, data were collected over a single academic year and mostly via teacher report. Future research should examine how KSEP ratings predict a variety of academic and SE outcomes using multiple informants and measures and investigate how KSEP data can be utilized to support further assessment and early intervention efforts.
Efforts to proactively screen and provide early intervention for students are increasing (Glover & Albers, 2007). However, screening efforts are limited by the psychometric properties of the instruments used. Despite limitations, this study provides evidence of adequate convergent and predictive validity estimates and supports the use of a 3.3 cut score to optimize predictive validity estimates for KSEP subscales. Results also suggest that the KSEP could be a valuable resource as an initial gate in the universal screening of students at kindergarten entry.
Footnotes
Declaration of Conflicting Interests
The author(s) declared no potential conflicts of interest with respect to the research, authorship, and/or publication of this article.
Funding
The author(s) disclosed receipt of the following financial support for the research, authorship, and/or publication of this article: This research was supported in part by the Society for the Study of School Psychology.