
Abstract
This replication study examined the alternate form reliability, criterion validity, and predictive utility of two curriculum-based measurement (CBM) tools in science, Vocabulary-Matching (VM) and Statement Verification for Science (SV-S), for the purpose of screening. In all, 205 seventh-grade students from four middle schools were given alternate forms of each science CBM tool. Scores from the Idaho Standards Achievement Test (ISAT) science assessment were obtained. Stronger evidence of reliability and validity with the ISAT was found for VM compared with SV-S. With regard to predictive utility, VM more accurately classified students’ at-risk status compared with SV-S for identifying proficiency on the ISAT. Practical implications and directions for future research are also discussed.
Keywords
Recently, the National Center for Educational Statistics (NCES; 2016) reported that over 63% of eighth-grade students scored below basic levels in science knowledge. The authors of the Next Generation Science Standards (NGSS) suggest that science should be comprehensible to all students (Lee, Miller, & Januszyk, 2014). However, many students often struggle comprehending the content presented in science classes due to complex vocabulary (Fang, 2006). Deficits in word knowledge represent primary barriers to engaging with science, communicating and interacting with science content and activities, and ultimately developing science content knowledge and interest that facilitates subsequent access to science, technology, engineering, and mathematics education and careers (Therrien, Benson, Hughes, & Morris, 2017).
Students need to access the vocabulary of grade-level science curriculum to communicate conceptual understanding. This requires educators to be equipped with efficient tools to adequately support students in science learning and help all students fulfill their potential, including at the secondary level (Bravo & Cervetti, 2008; Espin et al., 2013). As students get older and progress in school, vocabulary knowledge and reading comprehension become interdependent, especially in classes where texts increasingly include substantial content-specific terminology (Busch & Espin, 2003). To proactively identify and monitor students at risk for content-area difficulties, teachers need a brief, easy to administer, and easy to score assessment that can be used for making inferences regarding students’ comprehension of vocabulary related to content that has been, is being, or will be taught. Universal screening promotes early identification, intervention, and subsequent prevention of risk for failure (Glover & Albers, 2007). This proactive, rather than reactive, model improves students’ long-term performance by addressing student needs prior to experiencing failure (Jenkins, Hudson, & Johnson, 2007).
Curriculum-based measurement (CBM; Hosp, Hosp, & Howell, 2016) is a type of brief assessment that is commonly used in K-12 settings to assist educators with screening (i.e., identifying students at risk) and progress monitoring (i.e., measuring growth overtime) in reading, mathematics, and writing to make instructional decisions. CBM tools in content areas such as social studies (e.g., Espin, Busch, Shin, & Kruschwitz, 2001) and, more recently, science (e.g., Ford & Hosp, 2017; Ford, Conoyer, Lembke, Smith, & Hosp, 2018; Espin et al., 2013) have also been examined, but there is still much to be explored.
Science CBM Screening Studies
To date only a few researchers have examined the development and use of CBM as a screening tool in the area of science. The majority of these studies have focused on Vocabulary-Matching (VM) and Statement Verification for Science (SV-S).
VM
The VM measure requires a student to match a set of terms with definitions in a 5-min time period (Espin et al., 2001). This task was first investigated when vocabulary was found to be a stronger predictor compared with oral reading fluency (i.e., amount of words read correctly in 1 min) on a locating-information task (Espin & Foegen, 1996). This initial investigation resulted in a VM measure that accounted for more variance and higher correlations with content-area tasks, above and beyond maze (e.g., every seventh word in a passage is deleted and replaced with three answer choices) or oral reading measures. Espin and Foegen (1996) recommended VM measures as a stand-alone, efficient, and effective predictor of students’ likely success in the general education curriculum related to particular content areas.
Subsequent researchers have investigated the usefulness of VM as a means to progress monitoring skill in social studies (Beyers, Lembke, & Curs, 2013; Espin, Shin, & Busch, 2005; Lembke et al., 2017) as well as science (Espin et al., 2013). Alternate form reliability for VM in science has ranged from r = .64 to .84 (Ford et al., 2018; Espin et al., 2013). Criterion-related validity coefficients with state science tests have ranged from r = .64 to .66 (Ford et al., 2018; Espin et al., 2013). However, investigation of VM measures as a screening tool to predict future performance has been limited. As states have begun to include assessments of science in their battery of high-stakes assessments, the possibility of examining concurrent and predictive utility has increased.
SV-S
The SV-S measure is a more recent science CBM screening tool, developed in conjunction with the Iowa Core Science Standards and aligned to the NGSS (Hosp & Ford, 2014; Ford & Hosp, 2017; Lee et al., 2014). The SV-S measure is a modification of the Sentence Verification Technique (Royer, Hastings, & Hook, 1979). When completing a Sentence Verification task, students first read three to four 12-sentence passages and an associated set of test sentences. Then, students indicate whether the test sentences are related to the passages they read. When completing SV-S measures, students respond to a series of 60 “true” and “false” items for 3 min. Rather than items being related to a recently read passage, the items are based on vocabulary and key terms related to state science standards and the NGSS that students are expected to learn. Learning in content areas requires students to read and make sense of content-area material, obtain information from instruction, and retain obtained information (Espin & Foegen, 1996). Thus, students’ ability to accurately respond to SV-S items depends on knowledge they have obtained via science instruction.
While SV-S measures are relatively new, previous work has demonstrated that for Grade 7, alternate form reliability has ranged from r = .41 to .58 (Ford & Hosp, 2017) and for Grade 8 from r = .39 to .45 (Ford & Hosp, 2017; Ford et al., 2018). Criterion-related validity with state science tests have ranged from r = .11 to .24 in Grade 7 (Ford & Hosp, 2017) and r = .18 to .40 in Grade 8 (Ford & Hosp, 2017; Ford et al., 2018). Although promising evidence of the technical adequacy for SV-S has been reported, there is a need for additional investigation with larger and more diverse samples.
Pilot Study
With multiple formats of science CBM being developed, it is important to consider which type of task may be the most efficient and technically adequate way to collect information regarding students’ academic performance. Ford et. al (2018) investigated how VM and SV-S screening tools differed in alternate form reliability, criterion validity, and predictive utility with the same sample of 25 eighth-grade students. Results indicated that alternate form reliability was strong for VM (r = .73), however, weak for SV-S (r = .40). When examining criterion validity, the VM measure was strongly correlated with the state standardized science assessment (r = .71) and again SV-S demonstrated a weaker relation (r = .40). The VM measure was a better predictor of student performance on the state standardized science assessment compared with the SV-S (z = 2.09, p = .04). However, this pilot study was limited due to a small sample and an administration error with the SV-S measure.
Need for Replication of Science Screening Studies
Recently, there have been numerous reviews of replication studies in the field of special education (Cook, Collins, Cook, & Cook, 2016; Coyne, Cook, & Therrien, 2016; Lemons et al., 2016; Makel et al., 2016). While the majority of these studies focus on intervention, Hosp, Ford, Huddle, and Hensley (2018) discussed the importance of replication in measurement research in special education and school psychology. They note that if the tools used do not possess evidence of adequate reliability, validity, or utility, they cannot be used with confidence in schools and could potentially undermine the evidence base of intervention outcomes. Thus, replication is necessary in measurement development to establish adequate psychometric properties that contribute to the utility of the measure for a specific purpose. Due to the limited research and development of CBM tools in content areas, replication is necessary to demonstrate adequate reliability and validity of the VM and SV-S measures (Hosp et al., 2018; Mooney & Lastrapes, 2018).
According to Schmidt (2009), replications are classified as either direct or conceptual. Direct replication studies use the exact same methods, design, and sample for the purposes of examining accuracy of the original investigation. Conceptual replications allow for different samples, methods, designs, or analysis to further explore a construct or, in this case, the validity of a measure with a different population of students or criterion. Furthermore, Schmidt discusses that replication studies can serve different purposes. For example, these studies can control for sampling error, lack of internal validity, and fraud. However, replications can also be used for generalizing results to larger populations or verifying hypotheses made in previous investigations. With these functions in mind, we sought to replicate Ford et al. (2018) with a larger sample size, adjusted development and administration procedures for SV-S, and a different state standardized science assessment for enhanced generalizability. This conceptual replication further extends the literature by also examining predictive validity to science learning of these measures.
Predictive Utility and Classification Accuracy of Science CBM
A key feature in potential screening CBM tools for science is the ability to identify students at risk of learning difficulties in science due to deficits in vocabulary knowledge. Predictive utility has often been investigated for CBM in the areas of reading and mathematics (e.g., Gersten et al., 2012). In a review of mathematics CBM, Gersten and colleagues (2012) defined predictive utility as the screening tool’s ability to predict later performance. That is, if a student obtained a particular score on the measure, it may indicate the student would benefit from additional supports. The authors suggested that a screening tool’s ability to predict future performance is crucial to the development and use of such a tool in any academic area.
Investigations of CBM as a screening tool in content areas have examined predictive utility using correlational analysis (Mooney & Lastrapes, 2016, 2018; Ford et al., 2018). Screening tool charts produced by the Center on Response to Intervention (n.d.) indicate that a threshold of .70 is necessary to identify a measure as having “convincing evidence” of validity. Moreover, the Center on Response to Intervention indicates that having the ability to accurately determine or classify which students are at risk is also a key feature for screening tools. In addition to correlational analysis, logistic regression, and receiver operating characteristic (ROC) curves analyses, specifically the area under the curve (AUC) statistics have more recently been used for predicting students’ performance using CBM in other areas such as reading and mathematics (Conoyer, Foegen, & Lembke, 2016; Johnson, Jenkins, Petscher, & Catts, 2009). The AUC is an overall score ranging from .5 to 1 for diagnostic accuracy that takes both sensitivity and specificity into account. In this case, an AUC statistic of .5 suggests the accuracy of the screening measure is likely due to chance, whereas a score closer to 1 indicates that the screening measure is better able to correctly classify a pair of students as at-risk or not (Youngstrom, 2013). At this time, there has been limited investigation of the accuracy of content-area CBM in predicting future performance using these diagnostic analyses.
Present Study
The current study is a conceptual replication of the differences between VM and SV-S as screening tools for middle school students in science content knowledge with a large sample. Based on the results of Ford et al. (2018), we hypothesized that the VM measure would again produce strong coefficients and that based on the revisions to the SV-S measure and its similar content, it would show stronger coefficients that were similar to VM. We also sought to expand this conceptual replication by exploring the predictive utility of each measure. The following research questions were addressed:
Method
Participants
Four participating middle schools (Grades 7-9) in the Northwest United States agreed to participate. We chose seventh-grade students as participants given that this is the only grade where the ISAT Science Assessment (Idaho State Department of Education [SDE], 2017) is administered. After parent consent and student assent, a total of 205 students with full datasets were included in our sample. Our sample was mostly female and White (55.1% and 85.4%, respectively). Students with an Individualized Education Program or Section 504 plan accounted for 15.6% of our sample; 2.9% of students were identified as having Limited English Proficiency. For additional demographic information, see Table 1.
Student Demographics.

Note. IEP = Individualized Education Program.
Measures
SV-S
Similar to the pilot study (Ford et al., 2018), the SV-S items identified with the highest discrimination values from previous analysis were used to create two alternate SV-S forms (A and B). Each SV-S form included 60 items total as previous researchers suggest this is the optimal number for a 3-min administration (Hosp & Ford, 2014). To keep discrimination values comparable across the two SV-S forms, items were assigned in an alternating fashion (e.g., the item with the highest discrimination value was included on Form A and the next highest on Form B, etc.). Once created, each form was reviewed and edited to ensure similar items were not on the same form. As a result, SV-S Form A had 60 items with an average discrimination value of 1.088, and SV-S Form B had 60 items with an average discrimination value of 1.104. Furthermore, the resulting difficulty values across SV-S forms were comparable as well (−0.37 for both SV-S Forms A and B). Using standardized directions, students were given 3 min to read each statement silently, determine if the statement was “true” or “false,” and then fill in the corresponding circle in the “yes” or “no” column. A raw score of the total number of correctly identified statements for each probe and the mean of the two forms were calculated.
VM
For VM, the first 20 statements from each SV-S form were translated into two corresponding VM forms with similar language from the SV-S statement used to create a VM definition for each vocabulary word. This allowed the content of SV-S and VM forms to be similar with only the format of the probe being presented differently. In addition, the construction of VM was also changed from traditional procedures (Espin et al., 2001). Instead of items being developed based on the current classroom curriculum, items were based on standards students are expected to learn. Despite differences in item development, formatting and administration procedures outlined in previous studies (e.g., Espin et al., 2001) for VM were implemented. Thus, each VM form consisted of 20 terms listed alphabetically on the left side of the page, and 22 definitions (including two distracters) listed in random order on the right side of the page (Espin et al., 2001). Standardized directions were provided to students to read the probe silently for 5 min and match the words with the definitions by writing the letter of the correct definition in the blank next to each word, with two definitions not used. A raw score of the total number of correct matches for each probe and the mean of the two forms were calculated.
Idaho Standards Achievement Test (ISAT) Science Assessment
The ISAT Science Assessment served as the criterion measure of overall science skills. It is a multiple-choice, fixed form (i.e., all students are administered the same items in the same order) test administered to students in Grades 5 and 7 in the spring (SDE, 2017). The untimed test is administered for approximately 1 hr and 30 min with a provided guideline that professional judgment be used to determine if students are actively engaged and should be provided additional time. The ISAT Science Assessment measures students’ knowledge in five categories: Nature of Science, Physical Science, Biology, Earth and Space Systems, and Personal and Social Perspectives—Technology. Students obtain a Scale Score, with a score of 213 indicating proficiency for seventh-grade students (SDE, 2017).
Procedures
Previously developed standardized procedures for administration and scoring were used for VM and SV-S measures. These CBM tools were administered by the second author within 2 weeks of schools administering the ISAT Science Assessment. All CBM forms were group administered to students during their science class at each of the four participating middle schools, with a range of five to 15 classes at each school. Students received a packet with two SV-S forms and two VM forms. Forms were counter-balanced across class periods by teacher and across schools. Two graduate researchers were trained to competence by the fifth author to score each of the CBM probes. Raw scores were then entered into a spreadsheet. All scores were double entered, and any disagreements were discussed and resolved. Ten of the students’ assessments were pulled at random for scoring reliability, equaling 29% of total CBM tasks being scored twice. Scoring reliability for SV-S was 99%, and VM was 100%.
Data Analysis
Descriptive statistics were calculated prior to examining the research questions, including average VM, SV-S, and ISAT performance. To examine alternate form reliability, bivariate correlations were calculated across Forms 1 and 2 for VM and SV-S with results compared with standards set by Marston (1989) for CBM research (r ⩾ .70 = strong; r = .50 to .69 = moderate; and r ⩽ .50 = weak). The second research question related to evidence of criterion-related validity was examined via Pearson product correlations between mean scores from the VM, SV-S, and ISAT, and the Marston criteria imposed.
Predictive utility was examined using logistic regression and ROC curve analysis. Students scoring below 213 on the ISAT (e.g., below proficient) were coded as 1 (at-risk, n = 85) and those scoring 213 or above (e.g., proficient to advanced) were coded as 0 (no risk, n = 120). AUC values were interpreted using the following guidelines set by the Center on Response to Intervention (n.d.) specifically for screening tools: below .80 demonstrates “unconvincing evidence,” between .80 and .90 suggests “partially convincing evidence,” and greater than .90 demonstrates “convincing evidence.” We used ROC curve analysis to estimate diagnostic characteristics for each measure based on 90% sensitivity, per previous studies (Conoyer et al., 2016; Johnson et al., 2009).
Results
After reviewing descriptive statistics, the ranges for SV-S measures do not suggest floor or ceiling effects. However, there was a relatively small floor effect (3%) and small ceiling effects (3% and 22%, respectively) found for both VM forms. The skewness and kurtosis for the correct responses on both versions of the SV-S and VM forms ranged from −0.26 to 0.51 and from −1.19 to 0.59, respectively. To meet the normality assumption, the recommended range of the absolute value is within 2 for skewness and kurtosis (Tabachnick & Fidell, 2012). See Table 2 for the complete list of descriptive statistics.
Descriptive Statistics for All Measures.

Note. SV-S = Statement Verification for Science, VM = Vocabulary-Matching, ISAT = Idaho Standards Achievement Test.
Alternate-Form Reliability
VM coefficients were strong (r = .75, p ⩽ .01) compared with SV-S which were moderate (r = .61, p ⩽ .01). There was a moderate relation between the means of VM and SV-S (r = .65, p ⩽ .01).
Criterion-Related Validity
To address our second research question, criterion validity was calculated by correlating each measure with the ISAT Science Assessment standard score. Results indicated a strong, positive relation between the mean of VM and the ISAT (r = .74, p ⩽ .01) and a moderate, positive relation between the mean of SV-S and the ISAT (r = .58, p ⩽ .01).
Predictive Utility
To examine the accuracy of the VM and SV-S measures in predicting proficiency on the ISAT science assessments, we report the results of the logistic regression and ROC curve analysis in Table 3. To compare the classification accuracy based on sensitivity, the first row includes results from a typical logistic regression analysis. The second row includes the cut score for each measure estimating 90% sensitivity of the associated specificity levels, AUC statistics, and the resulting classification accuracy.
Classification Indices for SV-S and VM Measures With the State Standardized Science Score.
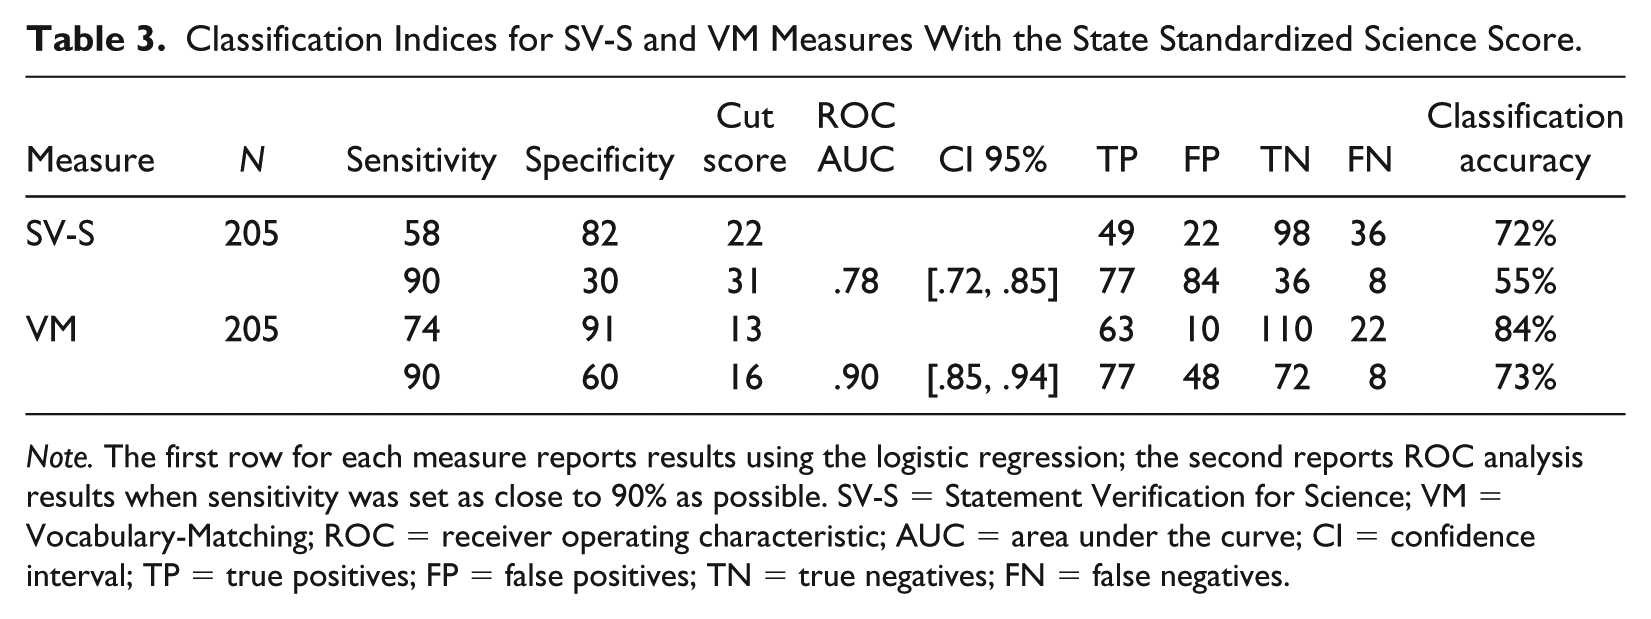
Note. The first row for each measure reports results using the logistic regression; the second reports ROC analysis results when sensitivity was set as close to 90% as possible. SV-S = Statement Verification for Science; VM = Vocabulary-Matching; ROC = receiver operating characteristic; AUC = area under the curve; CI = confidence interval; TP = true positives; FP = false positives; TN = true negatives; FN = false negatives.
The classification rate for SV-S according to the ROC curve analysis controlling for 90% sensitivity (55%) was less than those obtained with logistic regression results (72%). SV-S demonstrated an acceptable AUC statistic (.78), with 95% confidence intervals ranging from .72 to .85. In contrast, the classification rate for VM measure mirrors a similar, but less extreme, reduction in classification accuracy when sensitivity is set to 90%. Logistic regression classification accuracy rate for VM was 84%, while the ROC curve analysis rate was 73%. The VM measure demonstrated an outstanding AUC statistic (.90), with 95% confidence intervals ranging from .85 to .94.
Discussion
This study replicated a pilot investigation that examined the differences in technical adequacy between two similar screening CBM tools. The tools were compared on alternate form reliability, criterion validity, and classification accuracy. One of the main goals of the study was to compare the differential pattern between the two similar measures in the areas of alternate form reliability and concurrent criterion validity. For our first research question, we examined the evidence of alternate form reliability for each measure. A strong coefficient (.75) was found for VM measures, similar to previous studies in science (Espin et al., 2013) as well as social studies (Beyers et al., 2013; Espin et al., 2001; Lembke et al., 2017). A moderate coefficient (.61) was found for the SV-S forms, contrasting previous work demonstrating coefficients between .39 and .58 (Ford & Hosp, 2017). This pattern of the VM measure outperforming the SV-S measure is similar to results found in the Ford et al. (2018) study; however, the SV-S measure produced stronger coefficients with this larger sample. We attribute this performance to the increase in items included on the form and the appropriate administration time (in the initial study, SV-S administration was shortened). An interesting finding is that when correlating the mean score of the VM and SV-S forms only, a moderate relationship was found (.65). This may imply that while the items are measuring similar constructs, identifying science content knowledge requires different skills beyond knowing only content vocabulary.
Our second research question examined the evidence of concurrent criterion validity between the CBM tools and the ISAT. Once again, the VM measure demonstrated a strong relationship with the ISAT (.74). The results are similar to previous studies that compared VM measures with state standardized science assessment scores (Espin et al., 2013). The SV-S measure demonstrated a moderate relation to the ISAT (.58). This pattern of VM measures producing higher coefficients compared with SV-S measures is similar to results found in the Ford et al. (2018) study; however, SV-S produced stronger coefficients with the ISAT than it did with a different state science assessment. This is in contrast to previous studies that have shown criterion validity coefficients ranging from .11 to .40 in middle school grades when comparing SV-S measures with the state science assessment (Ford & Hosp, 2017; Ford et al., 2018). We attribute these findings to comparing SV-S with a different state science assessment, appropriate administration procedures, and having 60 items on the SV-S form.
Our third research question addressed the predictive utility of the VM and SV-S tools for the state standardized science assessment. As the majority of previous work in this area has been with correlational analysis, we were concerned with how accurately these measures predict the likelihood of whether a student was going to pass or fail a high-stakes test in science. The results suggested that VM measures were able to classify students more accurately compared with SV-S measures. With this particular sample of students and the ISAT, the SV-S measure performed at an unconvincing level, but a convincing level for VM measure according to the criteria established by the Center on Response to Intervention (n.d.). As expected based on previous studies, the classification accuracy percentage declined slightly when the sensitivity was set to 90% and the cut scores increased to potentially identify more students as being at-risk. The number of false positives dramatically increases when sensitivity is set at 90% and providing intervention to those that may not need it becomes an issue (Conoyer et al., 2016; Johnson et al., 2009).
Limitations
Limitations related to this study included a narrow sample, survey instrumentation lacking validation, and lack of generalization to other state tests. Our sample consists of students from one school district in one state and thus a representation of the areas in which the study was conducted. As a result, the sample lacks diversity in race, learning, and linguistic ability. This indicates that generalizability of our results will be limited to other populations. Finally, while the ISAT science assessment has been endorsed for measuring skills and concepts in science, it is unlikely that it will be similar to other state science assessments. Despite many states aligning to more national standards such as NGSS, generalizing the results of our findings to other state standardized science measures would not be appropriate at this time.
Practical Implications and Future Directions
Overall, the VM measure performed as a stronger predictor of performance on ISAT science assessment compared with the SV-S measure. This is an interesting finding given that the lack of adequate validity and reliability of SV-S measures in the pilot study was mostly attributed to administration and instrumentation errors and the small sample size. Even when these confounds were remediated in the replication, the results indicated that VM measures produced higher reliability and validity coefficients. Previous studies have shown that VM measures have outperformed other reading tasks such as oral reading fluency and maze (Espin & Foegen, 1996) as well as sentence verification (Mooney, Lastrapes, Marcotte, & Matthews, 2016) for students at the middle school level in the area of reading and science. One explanation that we have regarding this outcome is there may be some type of reading comprehension skill that is a moderating or mediating variable for VM, SV-S, or both measures. Perhaps asking students to identify the meaning of a word (i.e., VM) is more aligned with learning of content area vocabulary than having to read and comprehend an entire sentence to indicate if the items are “true” or “false” (i.e., SV-S). It is possible that SV-S items are acting as more of a reading comprehension measure than a content knowledge indicator. This would align with the fact that SV-S measures are modeled off of Sentence Verification Technique, which is a reading comprehension task (Ford et al., 2018).
However, prior to suggesting that VM measures be implemented for screening purposes in schools, more research is necessary to address measurement development. First, we would suggest a different approach to determining the sample of items for VM measures from standards such as NGSS and Common Core. This may assist in creating a more robust indicator of performance. If schools are ultimately using screening data to identify students at risk of not meeting proficiency on state assessments that are more aligned to national standards (e.g., NGSS), then perhaps this method of development would be more beneficial than pulling key vocabulary from curriculum, textbooks, or teacher notes.
We also suggest critical examination of these items through a formal analysis of grade-level terms and construct validity using item response theory coupled with enhanced examination of content validity by conducting expert reviews of items in the field of science education. Obtaining content validity coefficients from expert reviewer agreement would also provide further evidence that the screening measures are capturing science constructs (Cohen & Swerdlik, 2018). Additionally, using these measures as part of an intervention study that employs them as pre–post test measures could demonstrate additional validity evidence. For example, if students show growth from pretest to posttest after being taught the construct (i.e., science vocabulary), this may also provide evidence of good construct validity (Dimitrov & Rumrill, 2003).
Finally, it may also be important to determine what ways we can provide more items to students in a VM format that addresses the limitations of the measure such as ceiling effects, overwhelming lists of words, and the process of elimination and/or guessing. This could be accomplished with using computer assisted or even computer adaptive technology. While previous technological-based measures have been examined for measuring student progress in acquiring science content, they have either not incorporated a VM task or have not investigated the technical adequacy of such measures for screening purposes (Marino & Beecher, 2010; Vannest, Parker, & Dyer, 2011).
Conclusion
We sought to extend the research in science CBM by replicating a previous pilot study that examined differences between the VM and SV-S measures with middle school students. While stronger technical adequacy and better prediction to state test proficiency were found for VM measures, future research is necessary to critically examine content-area CBM development, construct validity, and incorporate computer assisted administration formats.
Footnotes
Declaration of Conflicting Interests
The author(s) declared no potential conflicts of interest with respect to the research, authorship, and/or publication of this article.
Funding
The author(s) received no financial support for the research, authorship, and/or publication of this article.