



Abstract
The present investigation explored the psychometric validity of the five-item Gratitude Questionnaire (GQ-5) using a construct validation approach. Concerning within-network construct validity, results of item response theory (IRT) analysis via graded response model (GRM) showed that this scale could not discriminate individuals who score high in gratitude and the 7-scale response options could be modified to a 6-scale response choice. As regards to between-network construct validity, findings demonstrated that gratitude was positively correlated to both controlled and autonomous motivation. Implications are discussed to refine the assessment of gratitude in the school contexts.
Gratitude is defined as “a sense of thankfulness and joy in response to receiving a gift, whether the gift be a tangible benefit from a specific other or a moment of peaceful bliss evoked by natural beauty” (Park, Peterson, & Seligman, 2004, p. 554). With its definition, it is quite evident that this concept can be observed in our everyday lives. More interestingly, a simple gesture of gratitude and/or feeling thankful has been found to significantly increase happiness, positive emotions (Watkins, Woodward, Stone, & Kolts, 2003), life satisfaction (Sheldon & Lyubomirsky, 2006), and other positive outcomes. Existing studies (i.e., Datu, 2014; Datu & Mateo, 2015; Froh, Emmons, Card, Bono, & Wilson, 2011; Langer, Ulloa, Aguilar-Parra, Araya-Véliz, & Brito, 2016; Valdez, Yang, & Datu, 2017) have commonly measured gratitude using the six-item Gratitude Questionnaire (GQ-6; McCullough, Emmons, & Tsang, 2002). It is composed of six items assessed via a 7-point Likert-type scale ranging from strongly disagree to strongly Agree. McCullough and his colleagues (2002) have shown that the scores from this scale were both valid and reliable in university students and adults. Other investigations have also demonstrated that GQ-6 had adequate psychometric properties even in high school student sample (Froh et al., 2011). However, the results on the psychometric validity of this scale may not be applicable to non-Western and collectivist societies as these studies (Froh et al., 2011; McCullough et al., 2002) usually recruited samples in the United States.
Limited investigations were carried out to explore the psychometric properties of GQ-6 in collectivist contexts such as Taiwan (Chen, Chen, Kee, & Tsai, 2009), Chile (Langer et al., 2016), and Philippines (Valdez et al., 2017). Across these studies, it has been found that the five-item version of the Gratitude Questionnaire (GQ-5) performed better than the originally constructed GQ-6. Despite the converging evidences on the validity of GQ-5, more studies are needed to examine whether this can effectively measure gratitude in similar cultural contexts (i.e., Western and non-Western context). As previous investigations adopted classical test theory approaches such as confirmatory factor analysis to provide evidence about the scale’s validity and reliability, it is notable to test this using latent trait theory approach such as item response theory (IRT). It is also important to refine the measurement of gratitude in the Philippine context given that past studies have shown that gratitude was linked to higher well-being (Datu, 2014; Datu & Mateo, 2015) and academic engagement (Valdez et al., 2017).
In this research, we assessed how gratitude may be related to dimensions of academic motivation (i.e., amotivation, controlled motivation, and autonomous motivation; Shahar, Henrich, Blatt, Ryan, & Little, 2003). It is likely that inclinations to feel grateful can be linked to adaptive motivational orientation. This was hypothesized because the broaden-and-build theory (Fredrickson, 2001) has pointed out that positive emotions (e.g., joy and gratitude) expand thought–action repertoire that optimizes achievement of physical, social, and psychological resources. In particular, it is hypothesized that scores from this Gratitude Scale may be associated with higher levels of autonomous motivation.
Hence, the current study explored the psychometric validity of GQ-5 via an IRT analysis approach in a collectivist school-aged sample that can generate substantial psychometric information such as the items’ difficulty and discrimination. It also assessed the association of gratitude with academic motivation to generate evidence on the external validity of this scale.
Method
Participants
There were 1,099 Filipino high school students from Grade 7 to Grade 11, which covers almost the whole population of a private secondary school in Metro Manila who participated in the current study. The mean age of the participants was 13.94 years with a standard deviation of 1.34. There were 566 girls and 519 boys, whereas others failed to specify their gender. Active consent forms were given to the participants and their parents, before the survey administration.
Measures
Gratitude
The five-item Gratitude Questionnaire (Chen et al., 2009) was used to measure students’ extent of gratitude. The five items came from the original version of GQ-6 questionnaire (McCullough et al., 2002). Specifically, the last item (“long amounts of time can go by before I feel grateful to something or someone”) was omitted in the questionnaire. The items were rated on a 7-point Likert-type scale (1 = strongly disagree; 7 = strongly agree). A sample item in the questionnaire was “I am grateful to a wide variety of people.”
Academic motivation
The Academic Motivation Scale (Caleon et al., 2015) is a 22-item questionnaire that assesses students’ levels of amotivation, controlled motivation, and autonomous motivation. The sample items were “In the past, I had good reasons for going to school; however, now I don’t know whether I should continue” (amotivation), “Because I need at least a high school degree to find a high-paying job later on” (controlled motivation), and “Because my studies allow me to continue to learn about many things that interest me” (autonomous motivation).
Data Analyses
First, test of unidimensionality was carried out in GQ-5 using exploratory factor analysis. Second, two-parameter polytomous IRT analyses via graded response model (GRM) was used to examine the psychometric information of GQ-5 items using the ltm package in R (Rizopoulos, 2006). In this investigation, there were six GRM categories: (a) Option 1 versus Options 2, 3, 4, and 5; (b) Options 1 and 2 versus Options 3, 4, and 5; (c) Options 1, 2, and 3 versus Options 4 and 5; (d) Options 1, 2, 3 and 4 versus Options 5 and 6; (e) Options 1, 2, 3, 4 and 5 versus Option 6; and (f) Options 1, 2, 3, 4, 5 and 6 versus Option 7, as the scale has a 7-point rating option. Difficulty and discrimination indices were reported. Third, descriptive statistics and correlational coefficients of gratitude to academic motivation were calculated.
Results
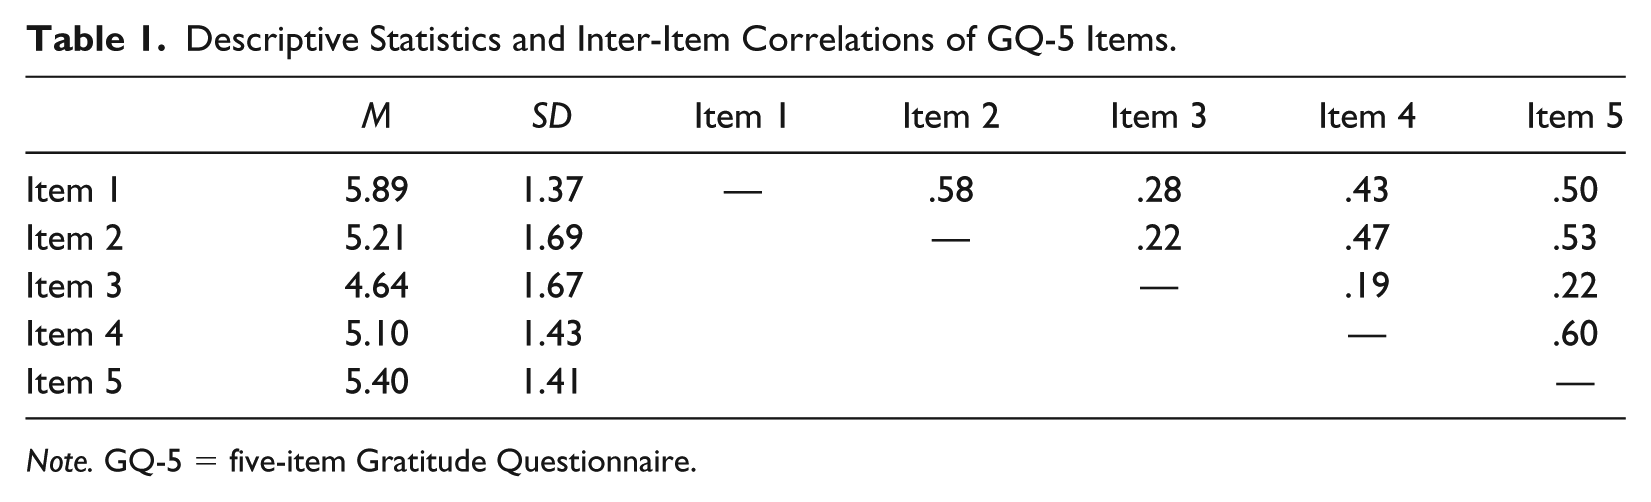
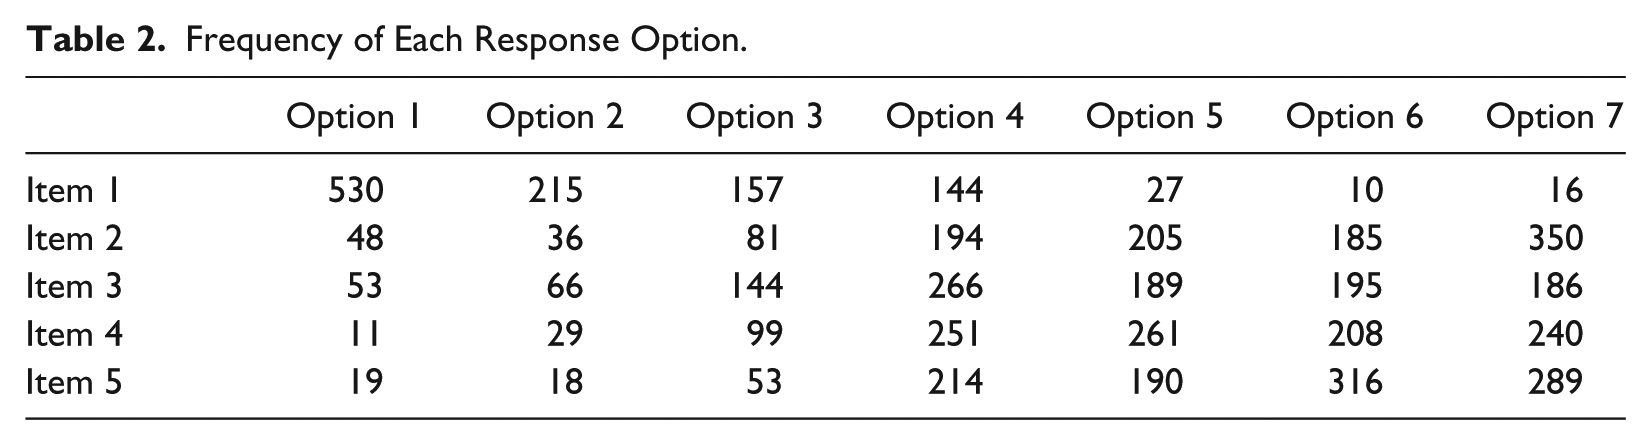
Table 1 shows the results of descriptive statistical and correlational analyses among the GQ-5 items. The Cronbach’s alpha reliability coefficients of the five-item and three-item versions of the scale were .76 and .77, respectively. The frequencies of each response choice are also shown in Table 2. Results of parallel analysis and Velicer’s minimum average test demonstrated that the scale was unidimensional. The Goodness of Fit Index for the unidimensional model of gratitude was 0.99.
Descriptive Statistics and Inter-Item Correlations of GQ-5 Items.
Note. GQ-5 = five-item Gratitude Questionnaire.
Frequency of Each Response Option.
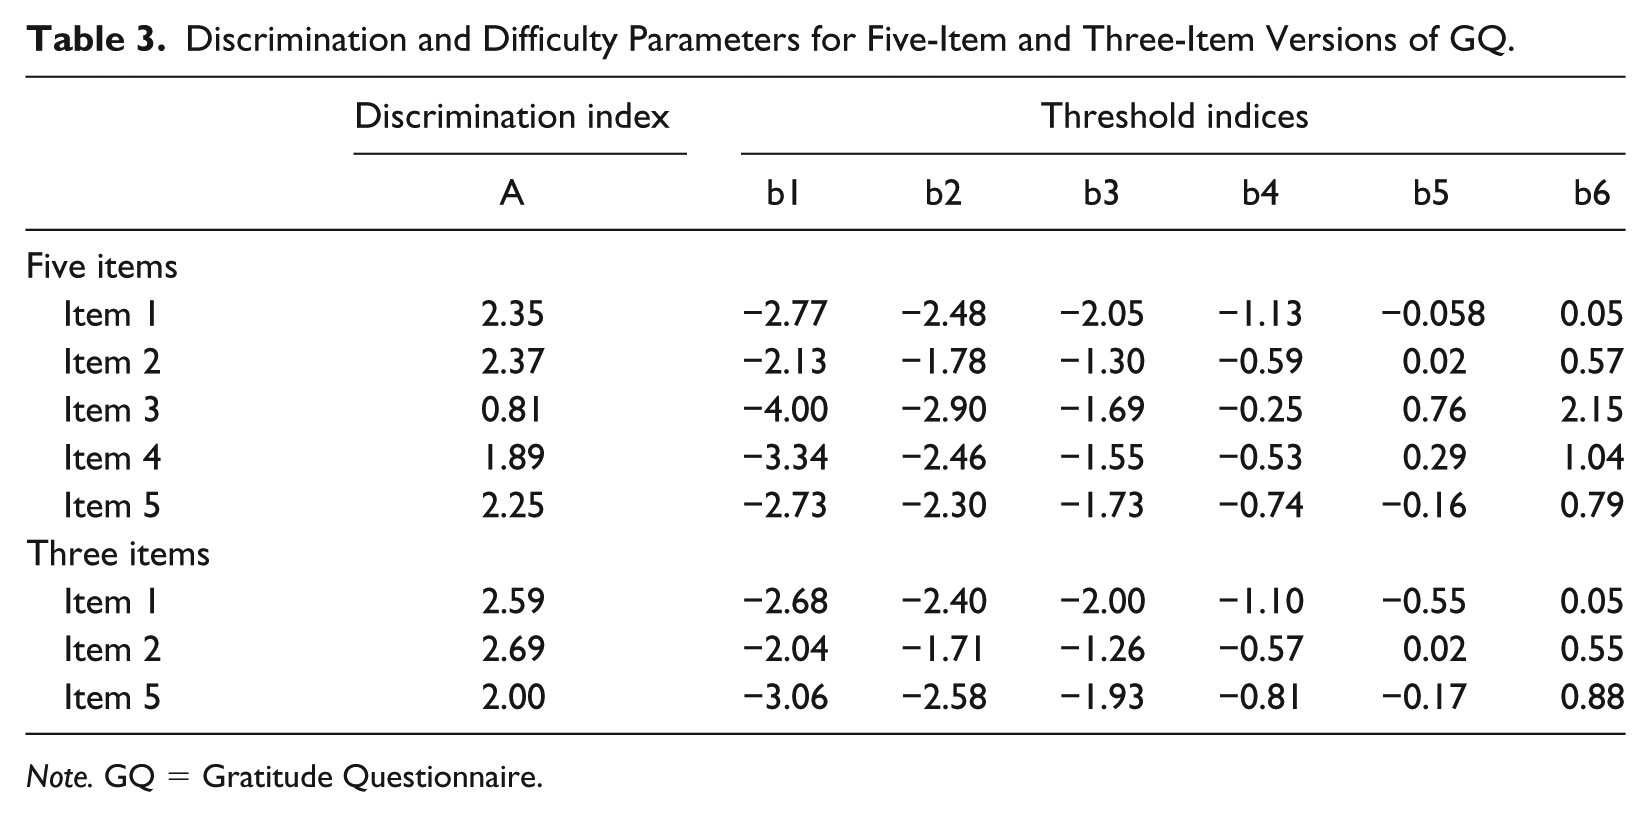
The discrimination and threshold indices revealed by the GRM analyses are shown in Table 3. Figure 1 indicates that almost all the item information functions tail off at the higher end of the latent trait continuum. The discrimination indices of Item 3 and Item 4 are 0.81 and 1.89, respectively, which suggest that such items could not distinguish individuals who had either lower or higher scores in gratitude. The discrimination indices of Items 1, 2, and 5 fell within the acceptable range of values for discrimination parameters.
Discrimination and Difficulty Parameters for Five-Item and Three-Item Versions of GQ.
Note. GQ = Gratitude Questionnaire.
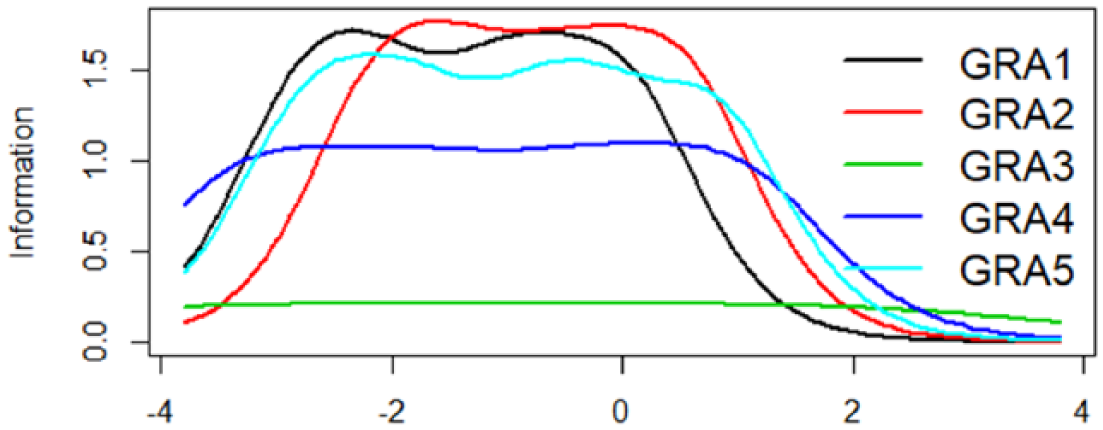
Item information curves of GQ-5 items.
Figure 2 describes the item–response option curves that can detect excessive or redundant as well as rarely endorsed response options. Findings suggest that there were too many response options for the scale. Response Option 2 was hardly endorsed by participants in the lower region of the latent trait. Results also indicate that it is hard to distinguish the usage of Response Options 2, 3, and 4. This problem was very evident in Item 3.

Response option curves for GQ-5 items.
Hence, GRM analysis was performed again after removing Items 3 and 4 as they had low discrimination indices. The difficulty and discrimination parameters of the three-item scale are shown in Table 3. The item information curve of the three-item version of the scale (Figure 3) appears to be comparable with the information curve of the original version of GQ-5. Even the response option curve of the three-item scale was also equivalent to the graphical curve of the five-item scale (See Figure 4). These results suggest that the removal of Item 3 and Item 4 did not have an impact on assessing the latent gratitude construct.
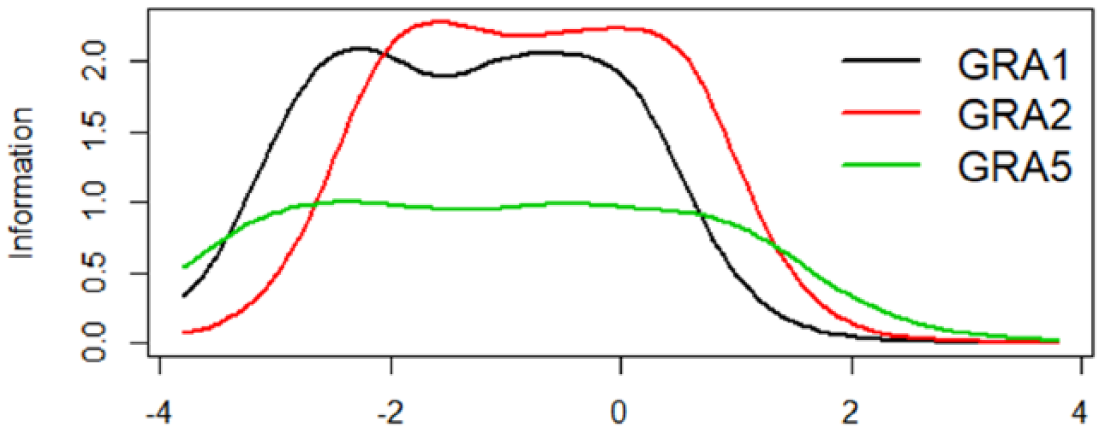
Item information curves of the three-item Gratitude Scale.

Response option curves for the three-item scale.
In terms of between-network construct validity, correlational analyses were conducted to examine how the scores from the revised three-item Gratitude Questionnaire may be linked to academic motivation dimensions. Results demonstrated that gratitude was positively correlated to both autonomous and controlled motivation. As expected, gratitude was negatively correlated to amotivation (See Table 4).
Correlation Between Gratitude and Criterion-Related Measures.

p = <.01.
Discussion
The aim of the study was to examine the psychometric properties of GQ-5 using a construct validation approach in a collectivist, school-aged sample. IRT analyses were performed to provide evidence about the within-network construct validity, whereas correlational analyses were carried out between gratitude and academic motivation.
Results of IRT analysis via GRM showed that this scale could not discriminate individuals who score high in gratitude. Two of the items in the scale offered less psychometric information compared with the remaining three items. The low discrimination power of GQ-5 in the higher end of the latent trait indicates that it may be difficult to interpret the differences in the scores of people who belong to the upper end of gratitude trait continuum. This implies that distinctions in the gratitude scores of people in the high-end region may have no conceptual meaning. Therefore, it is challenging to provide an accurate effect size indices between gratitude and relevant criterion measures.
Furthermore, the study suggests that the 7-point response option is considered excessive and unnecessary. Specifically, results demonstrated that Response 2 was not frequently endorsed by the participants. This points to the potential advantages of adopting a 6-point response option in future research that will use this Gratitude Scale as the participants may not comprehend the distinction of each response category. Results from the IRT via GRM shows that having a 6-point Likert-type scale, the midpoint response (i.e., neutral) can be omitted. Thus, the headers could be from strongly agree to strongly disagree.
Findings also showed that Item 3 (“When I look at the world, I don’t see much to be grateful for”) and Item 4 (“I am grateful to a wide variety of people”) had poor psychometric information. A possible reason for the weak performance of Item 3 is the wording of the item. The item is asking the participants about the extent to which they are not thankful about certain aspects of the world, an item that deviates significantly from the remaining items that are assessing students’ sense of thankfulness. Moreover, it is likely that problem in wording can explain Item 4’s poor performance as the item involves an unclear phrase (“a wide variety of people”). The phrase “a wide variety of people” may potentially leave the reader clueless on which group of people or specific person are the item referring to which makes it more problematic. Inter-item correlational coefficients indicate that these two items were weakly correlated with the remaining items (r = .19 to .22). These items performed poorly across the entire range of the latent trait continuum. These findings emphasize the necessity to revise these items to improve their respective psychometric information. In addition, the scores from the final GQ-3 were also reliable (α = .77).
Gratitude was also negatively related to amotivation and positively correlated to autonomous and controlled motivation. These results imply that gratitude may be linked to lack or absence of desire to perform academic activities. Furthermore, gratitude may also be related to higher levels of intrinsic and extrinsic motives for learning. Indeed, our study indicates that offering opportunities for students to express gratitude may potentially boost their drive to perform academic tasks in the school context. These findings can serve as a springboard for future research on looking at how gratitude can lead to more effective learning processes or outcomes, such as academic engagement, and achievement. To date, it seems that there is only one study that investigated the relationship between gratitude and academic motivation. These results were in line with the findings of Valdez and her colleagues (2017) which demonstrated that gratitude was linked to academic motivation and engagement. However, unlike the study of Valdez and her colleagues (2017) that employed classical test theory approach, this study utilized a latent trait theory approach which yielded additional psychometric information about the Gratitude Scale.
The current research indicates that a three-item version had a comparable performance with the five-item version of the Gratitude Scale that was suggested by Valdez and her colleagues (2017). Results suggest that Item 3 and Item 4 do not significantly contribute to the assessment of gratitude. It is also expected that removal of such items may not result in underestimated effect size indices between gratitude and pertinent academic criterion measures.
Existing studies, despite having similar participants (collectivist and school-aged samples) who provided evidence about the psychometric validity of GQ-5 in different school contexts, have relied on classical test theory approaches in examining the validity and reliability of this scale. The present study builds on this line of research through exploring the psychometric properties of GQ-5 via an IRT approach. Results imply that dropping two items and eliminating a response option category in the scale may improve the assessment of students’ sense of gratitude.
Footnotes
Authors’ Note
The manuscript is based on the PhD dissertation project of the first author under the supervision of the second author.
Declaration of Conflicting Interests
The author(s) declared no potential conflicts of interest with respect to the research, authorship, and/or publication of this article.
Funding
The author(s) received no financial support for the research, authorship, and/or publication of this article.