
Abstract
According to (inter)national policy and curriculum documents, the acquisition of research skills is an important objective of secondary education. However, the conceptualization and hence the operationalization of this concept seems ambiguous. Furthermore, no test exists to assess students’ proficiency in (a broad range of) research skills in a 11th- and 12th-grade behavioral sciences classroom context. This article first elaborates on what constitutes research skills in this educational context. Second, the development and testing process of the Leuven Research Skills Test (LRST) is described. Third, the psychometric properties and the dimensional structure of the LRST are presented, based on a large-scale sample (n = 405) of Belgian students in 11th and 12th grade. The results revealed that (a) the LRST is an internal consistent instrument and that (b) a hierarchical model with eight subordinate factors and one single uniting upper level factor appears to be the best fit to the data (in comparison with a unidimensional model and an eight-factor multidimensional model). It is argued that the LRST can be used to assess (individual differences in) overall research skills proficiency and to investigate the effect of particular interventions to foster research skills in future studies.
In the 21st century, enabling students “to use scientific concepts and methods to address problems in research, professional practice, and daily life” (Opitz, Heene, & Fischer, 2017, p. 1) is considered an important goal. In other words, education aims (among other things) at empowering students to acquire a broad set of skills and abilities to understand how scientific knowledge is generated in different scientific disciplines, to evaluate the validity of science-related claims, to assess the relevance of new scientific concepts, methods, and findings, and to generate new knowledge using these concepts and methods. (Fischer et al., 2014, p. 29)
In this article, this broad set of skills is referred to as research skills. As an indication of this international trend, the emphasis on research skills is reflected in highly valued outcomes in secondary and higher education (Engelmann, Neuhaus, & Fischer, 2016; Fischer et al., 2014; Osborne & Dillon, 2008). Accordingly, in the Flemish educational guidelines for the general track, 1 which “focuses on broad general education” (Education, Audiovisual and Culture Executive Agency, 2014, p. 2.2) three specific objectives related to research are formulated for students in the 11th and 12th grade. These curriculum standards state that students have to be able to (a) orientate themselves toward a research problem by collecting, organizing, and editing information in a well-considered way; (2) prepare, carry out, and evaluate research; and (c) report the research results and conclusions and confront them with other points of view (Departement Onderwijs en Vorming, 2017).
To explore ways to effectively support the acquisition of research skills, first one needs to find a reliable way to assess these skills (Opitz et al., 2017). In this article, it is argued that, given the importance of the development of research skills in general secondary education (as reflected by Flemish and international curriculum standards) and the lack of instruments to assess these skills in particular contexts (and, more specific, in a behavioral sciences context), there is a need for a test measuring research skills in a broad (covering all subskills theoretically linked to research skills), but domain-specific way (Fischer et al., 2014). Therefore, drawing upon the theoretical framework of Fischer et al. (2014), a new instrument for this specific target group is developed, meeting the criteria for internal consistency reliability, content, and construct validity (Leuven Research Skills Test, further on referred to as LRST). The main focus of this study is to examine the psychometric properties and the underlying dimensionality of the LRST.
In what follows, first, the term research skills is conceptualized. Second, existing tests assessing research skills are identified and evaluated in view of this study. Third, the development process of the LRST, and the format of the resulting instrument is clarified. Fourth, based on confirmatory factor analyses (CFAs), three models with a different dimensional structure (based on the review of Opitz et al., 2017) are presented and compared in view of their model fit. To conclude, the results regarding the psychometric properties and the dimensional structure of the LRST are discussed.
Assessing Research Skills
Conceptualization
Despite the (international) consensus that the acquisition of research skills is an important goal of secondary education, there still exist numerous terms referring to variants of this complex set of skills (Kestens, Elen, & Verburgh, 2016; Koslowski, 2012), such as scientific reasoning skills (Engelmann et al., 2016; Fischer et al., 2014; Opitz et al., 2017; Zimmerman, 2000), scientific literacy (Norris, Phillips, & Burns, 2014), or research methods skills (Earley, 2014). In the present study, the term research skills is used, as it adequately reflects the target concept as a broad set of skills (not merely referring to reasoning, literacy or research methods skills). In addition, many researchers seem to focus on different aspects of research skills (Koslowski, 2012). To operationalize this broad set of skills (covering all subskills theoretically linked to research skills, see instrument development), this study draws upon the theoretical framework of Fischer et al. (2014; Opitz et al., 2017), labeling research skills as a comprehensive set of eight scientific activities in which students have to be able to engage, namely, (a) problem identification, (b) questioning, (c) hypothesis generation, (d) construction and redesign of artifacts, (e) evidence generation, (f) evidence evaluation, (g) drawing conclusions, and (h) communicating and scrutinizing (Table 1 offers a short description of each of these skills).
Conceptualization of Research Skills (Based on Fischer et al., 2014; Opitz, Heene, & Fischer, 2017).

Existing test instruments
Although to date several tests have been developed to assess students’ research skills (Opitz et al., 2017), their conceptual base and the skills they address differ widely (Gormally, Brickman, & Lut, 2012; Osborne & Dillon, 2008). In their review, Opitz et al. (2017) analyzed several tests measuring research skills, with respect to the following features: target group(s), theoretical background, psychometric properties, test format, and the skills addressed.
In view of the current study, a first important finding of the review of Opitz et al. (2017) is that only two tests were found to measure research skills in a behavioral sciences context (Frederiksen & Ward, 1978; Heene, 2007). It is observed that most instruments focus on specific natural science domain contexts, mainly in biology, chemistry, and physics (Opitz et al., 2017). The authors argued that, “if you only want to measure scientific reasoning in relation to one subject area, it is advisable to choose a test that is set in this specific context and aims to measure scientific reasoning in a domain-specific way” (Opitz et al., 2017, p. 17). As such, for the specific purpose of this study, there is a need for a test focusing on the behavioral sciences domains. Therefore, the following two comments refer to the two tests developed for a behavioral sciences context: Test of Scientific Thinking (Frederiksen & Ward, 1978) and Empirical-based reasoning (Heene, 2007). Both tests target university students and only use open-ended questions.
As a second important finding, Opitz et al. (2017) argued that an explicit aim of tests should be to include all the skills that are perceived relevant in the scientific reasoning conceptualization that is used (Opitz et al., 2017). It is noticed that the two tests for behavioral sciences (Frederiksen & Ward, 1978; Heene, 2007) only focus on, respectively, three (hypotheses generation, evidence generation, communicating and scrutinizing) to two (evidence generation, evidence evaluation) skills (Opitz et al., 2017). In view of the specific purpose of this study, it is thus observed that a broad domain-specific test for behavioral sciences, covering all skills mentioned in the conceptualization used in this study (Fischer et al., 2014), is lacking.
Third, it is noticed that the target groups in the two existing tests differ from the target group in this study (students in 11th and 12th grade). The two studies focus respectively on candidates for admission to graduate school in psychology, often senior psychology major students planning to attain a doctorate (Frederiksen & Ward, 1978), and on students with a mean age of 23 years (Heene, 2007). As such, the adaptation of these tests to the (much younger) sample of this study might cause problems, such as floor effects. In addition, the specific goals of the tests differ from the goal of this study (developing a test as an instrument for intervention studies). In the case of Heene (2007), the test served as a subtest (with one open question on how to empirically investigate a specific casus) in a selection instrument for higher education. In the case of Frederiksen and Ward (1978), the purpose was to develop a set of tests that could serve as criterion measures in subsequent investigations of creative thinking.
As a fourth comment, Opitz et al. (2017) observed that, next to psychometric properties (such as internal consistency reliability), it should also become a standard procedure to check dimensionality as a construct validity measure. The authors pointed out that, overall, results from factor analyses on current tests are few in number and differ widely in their outcomes (ranging from 1- to 11-factor models). In addition, the number of factors depends on the number of skills included in the test. Overall, Opitz et al. (2017) concluded that a multidimensional structure seems to be slightly more probable compared with a unidimensional one. However, a conclusive answer to the question of dimensionality, and the exact number of research skills factors, is lacking at the moment. Therefore, the authors argued that as long as we cannot exclude the possibility that scientific reasoning is multidimensional, we should measure several aspects of the construct if we want a broad assessment because we cannot assume that a single sum score will accurately predict the performance of subskills. (Opitz et al., 2017, p. 17)
In addition, because of the conceptual differences, the different aims (Frederiksen & Ward, 1978) or the single-item format (Heene, 2007) of the existing tests for behavioral sciences, no clear factorial structures (interpretable in this study) can be deduced. As such, for the specific objective of the present study, neither test (for behavioral sciences, nor in other contexts) is satisfactory. Thus, based on the important comments mentioned above, there is a need for a new instrument with good psychometric properties and clear construct validity, measuring research skills in a broad way, suitable for a behavioral sciences context, which is LRST.
Instrument Development
The development process of the LRST followed four phases outlined in the Standards for Psychological and Educational testing (American Educational Research Association, American Psychological Association, & National Council on Measurement in Education, 2014).
Purpose and scope
In the first and second phase, the purpose of the test and scope of the domain to be measured was delineated, and the test specifications were developed and evaluated. The purpose was to construct an instrument (a) assessing research skills (b) designed for students in 11th and 12th grade, (c) with a domain-specific focus on behavioral sciences (d) in view of testing the effects of interventions. Although the current administration takes place in Flemish schools, the idea of this study is that, if successful, the test can be used in schools beyond Belgium. As indicated above, the intended use of the instrument is to assess research skills in an internal consistent way, to be able to design instruction based on intervention studies. Establishing content validity was an important part of the development process. Gormally, Brickman, and Lutz (2012) described content validity as “the extent to which the instrument measures all facets of a given social construct” (p. 365). As such, the present study refers to the eight skills mentioned by Fischer et al. (2014, see Table 1) as eight essential facets of research skills. Several experts in the field of psychometrics or in the field of complex skills revised whether all eight subskills were represented in the LRST. In addition, the alignment with the three educational objectives related to research skills in 11th and 12th grade of general education (as the described in the introduction) was confirmed by the reviewers.
Item construction
In the third phase, the test items were developed, scoring guides and procedures were formulated, followed by a field-testing and evaluation phase. Based on the theoretical framework (Fischer et al., 2014), the eight skills were articulated as outcomes measurable by means of multiple choice or short open answer questions. The format of the question (multiple choice or short open answer) depended on the characteristics of the skill to be measured (for evidence evaluation, e.g., a short argumentation is needed, while this is not necessary when a student has to organize several parts of an abstract). Because expert opinions can promote content validity, the items were reviewed by several experts. First, an existing test previously used within the research group (the LOC-test; Sermeus, Janssen, Claes, Depaepe, & Elen, 2017) was discussed with the test developers (experts in the field of research skills and critical thinking). Because this test had a low internal consistency score (Sermeus et al., 2017), several problems of the LOC-test (such as bottom effects, misinterpretations, or small variances between student scores) were discussed. Second, the same experts reviewed the items of the LRST. These three experts, and three coauthors of this article, individually read and commented on the items. Comments were made on the question formats, the difficulty level of the questions, and possible interpretation problems were addressed. Based on this feedback, the test was revised. Third, a cognitive interview was administered with three adolescents, aged 16 years to 18 years, who studied or had studied in the general track (see Note 1). Two students had studied behavioral sciences, and one student studied mathematics-sciences. Cognitive interviewing can play an important role answering the validity question (Castillo-Díaz & Padilla, 2013). A probing method was used to explore the respondents’ interpretation processes while answering the questions (Collins, 2003). For example, the students were asked to rephrase the items in their own words (comprehension), and to explain their answers (response; Collins, 2003). Based on the feedback received during these different phases, modifications were made to various test items.
Field testing
In the fourth phase, the test was assembled, piloted, and prepared for a large-scale assessment (see “Method” section; Adams & Wieman, 2011). In November 2017, the test was administered in a field-testing during a class period of 100 min. In total, 80 11th-grade students and 88 12th-grade students in a behavioral sciences-track (nested in 10 classes in five schools) participated in the study. In addition, several recommendations were made by an expert in test construction and psychometrics. Again, comments were made on the question formats, the difficulty level of the items and possible interpretation problems were addressed. The LRST was revised accordingly. An extensive overview of the items in the LRST can be found in Table 2.
Test Design of the LRST.

Note. LRST = Leuven Research Skills Test.
The current study
The purpose of the present study is to investigate the psychometric properties and the underlying dimensionality of the LRST. To this end, the LRST was administered to 405 students in 11th and 12th grade. Next, a CFA was performed to confirm the construct validity of the LRST. Based on the overview of Opitz et al. (2017), three models were compared considering their model fit indices: a unidimensional model with one factor, a multidimensional model with eight factors, and a hierarchical model with eight subordinate factors and one single uniting upper level factor. In addition, the internal consistency reliability was calculated.
Method
Participants
The LRST was administered to 405 students in 11th (41%) and 12th (59%) grade. The cohort consisted of students in four types of secondary education: (a) general secondary education, behavioral sciences track; (b) general secondary education, nonbehavioral sciences track; (c) technical secondary education, and (d) secondary education in the arts. Because of the specific interest in students in the behavioral sciences track, a purposive sample was used with 55% students coming from the behavioral sciences track in general secondary education. To ensure variation, the other students in the sample followed other tracks, namely, other tracks in general secondary education (32%), technical secondary education or secondary education in the arts (13%). The sample consisted of 68% girls, which is in line with the expectations of prevalence of sexes based on the formulated strata (because the behavioral sciences track in Flanders is mainly populated by girls).
Instrument
The LRST contains 59 items, each related to a (sub)skill (see Table 1, Fischer et al., 2014). Each item (in all three item formats) was scored as 0 or 1, relying on a strict scoring guide. Students could not get partial credit (e.g., answers in the multiple choice with clarification format were only scored as 1 if the multiple choice answer and the clarification were correct). The total score on the LRST is calculated by adding all eight mean subscale scores, and dividing them by the number of subscales. The number of items per skill, their item format, and item examples are visualized in Table 2. The corresponding author scored the test, and a second rater independently coded the answers of 10% of the students to check interrater reliability.
Procedure
Completing the test took maximum 100 min. The LRST was administered under supervision, by means of an online web survey. An informed consent form notified each participant about the duration of the test and the specific goal of the study.
Data Analysis
As Gormally et al. (2012) indicated “construct validity involves statistical analyses to evaluate item validity and relationships between instrument items” (p. 366). Therefore, first, an item analysis was done on the 59 items (Table 3). Item-scale correlations (to check item consistency within each subscale) and p values (to investigate item difficulty) were examined and reported. Second, using the lavaan package (Rosseel, 2012) in R, a series of CFAs (estimation method: WLSMV) was carried out on the 59 items, to investigate the construct validity of the LRST. The CFA method was chosen (instead of an exploratory method) because of the specific interest in the testing of the structures of three hypothesized models (Field, 2013). Thus, it is a theory-driven (Schreiber, Nora, Stage, Barlow, & King, 2006) technique allowing to test and compare several models. Three models were specified based on the overview of Opitz et al. (2017). Model 1 is a unidimensional (single factor) model, with one latent factor (research skills) and 59 observed variables (items). Model 2 is a multidimensional (eight-factor) model, with eight latent factors (see eight subskills in Table 1) and 59 observed variables (each related to one latent factor, see Table 2). Model 3 is a hierarchical model with eight subordinate latent factors (as described above), one single uniting upper level latent factor (research skills) and 59 observed variables (each related to one latent factor, see Table 2). The adequacy of these three competing models was assessed through an examination of a variety of fit indices. Although the most frequently used fit index is the model’s χ² (if significant, χ² suggests that the data differ significantly from the hypothesized model), it is argued that “trivial” variations in fit can easily produce a statistically significant χ² statistic, especially with large sample sizes (Chen, Curran, Bollen, Kirby, & Paxton, 2008; Hu & Bentler, 1999). Therefore, the three models were compared based on other model fit indices and cutoffs (a cutoff value close to .95 for Tucker–Lewis index [TLI] and comparative fit index [CFI], a cutoff value close to .08 for standardized root mean square residual [SRMR], and a cutoff value close to .06 for root mean square error approximation [RMSEA]) identified by Hu and Bentler (1999). However, as will be further pointed out in the “Discussion” section, the use of these cutoff values in personality and ability research are not without controversy, as correlations between items are typically low or moderate in this type of research, often leading to low or moderate factor loadings (Beauducel & Wittmann, 2005). In addition, the critics on the use of cutoff values in any case are pointed out in the “Discussion” section (Chen et al., 2008; Yuan, Chan, Marcoulides, & Bentler, 2016). Third, the internal consistency reliability measures were calculated for each of the subskills of the multidimensional models and for the total test. Because it is not assumed that the loadings of the items are equal in the factor analysis, (and thus tau equivalence is not assumed), Omega total is used as a measure for internal consistency reliability (McNeish, 2018).
Item Analysis.

Note. PI = problem identification; CR = constructed response; HG = hypothesis generation; Q = questioning; MC = multiple choice; EG = evidence generation; CA = construction and redesign of artifacts; MCCR = multiple choice with constructed response as argumentation; EE = evidence evaluation; DC = drawing conclusion; CS = communicating and scrutinizing.
Results
The difficulty level of the items varies between 15% and 89%. The overall test mean is 57% (based on 59 items). Questions related to hypotheses generation and evidence evaluation yield the lowest results, while items related to evidence generation and problem identification yield the highest results. The means, item format, and item-scale correlations are outlined in Table 3.
Results on the model fit indices described in the “Method” section are summarized in Table 4. The single-factor model (Model 1) proved to be the poorest fit to the data, with CFI and TLI values much below the cutoff point of .95 (Hu & Bentler, 1999). Furthermore, RMSEA and SRMR values are too high. The multidimensional eight-factor model (Model 2) proved to be a better fit to the data than Model 1 for all model fit indices. The hierarchical model with eight first-order factors and one overall second-order factor (Model 3) proved to be the best fit to the data. Overall, ranking the models in terms of their overall fit suggests that a hierarchical model (Model 3) performed best.
Results of CFA Based on 59 Items (Models 1, 2, and 3) and 37 Items (Model 4).
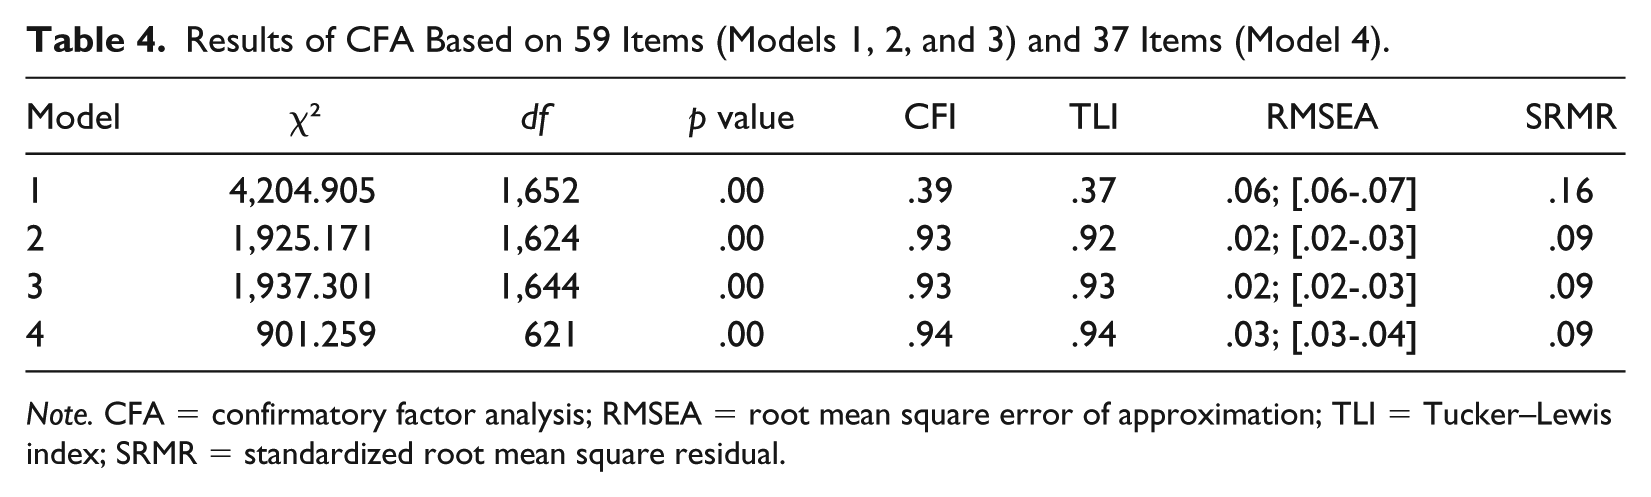
Note. CFA = confirmatory factor analysis; RMSEA = root mean square error of approximation; TLI = Tucker–Lewis index; SRMR = standardized root mean square residual.
Modifications to the best-fitted model (Model 3) were investigated, as long as content validity was ensured by the remaining items. Items without significant (or with very low = −.40) factor loadings were discarded from the model (one item related to problem identification, five items related to questioning, five items related to evidence evaluation, two items related to evidence generation, two items related to drawing conclusions, and seven items related to communicating and scrutinizing). The item analysis helped to understand why these items loaded low on the factor (one or several problems with these items, such as low item-scale correlations and/or very low or very high p values had been noticed during the item analysis). However, content validity was not flawed by deleting these items as the remaining items were representative for the skill. Despite low factor loadings, two items were retained in the definitive model because of theoretical reasons: In view of content validity, the authors chose to retain item EG3 and EG5. 2 As such, all items deemed relevant are included in the subscale.
As Schreiber et al. (2006) indicated, a good fit is probable if the vast majority of the indexes are good. Thus, for the 37 remaining items, overall, the adapted model showed good model fit results (χ2 = 901.259, df = 621, p < .001, CFI = .94, TLI = .94, RMSEA = .03 with a 90% CI = [.03, .04], SRMR = .09; Hu & Bentler, 1999). The factor loadings can be found in Table 5.
Item Loadings of CFA.
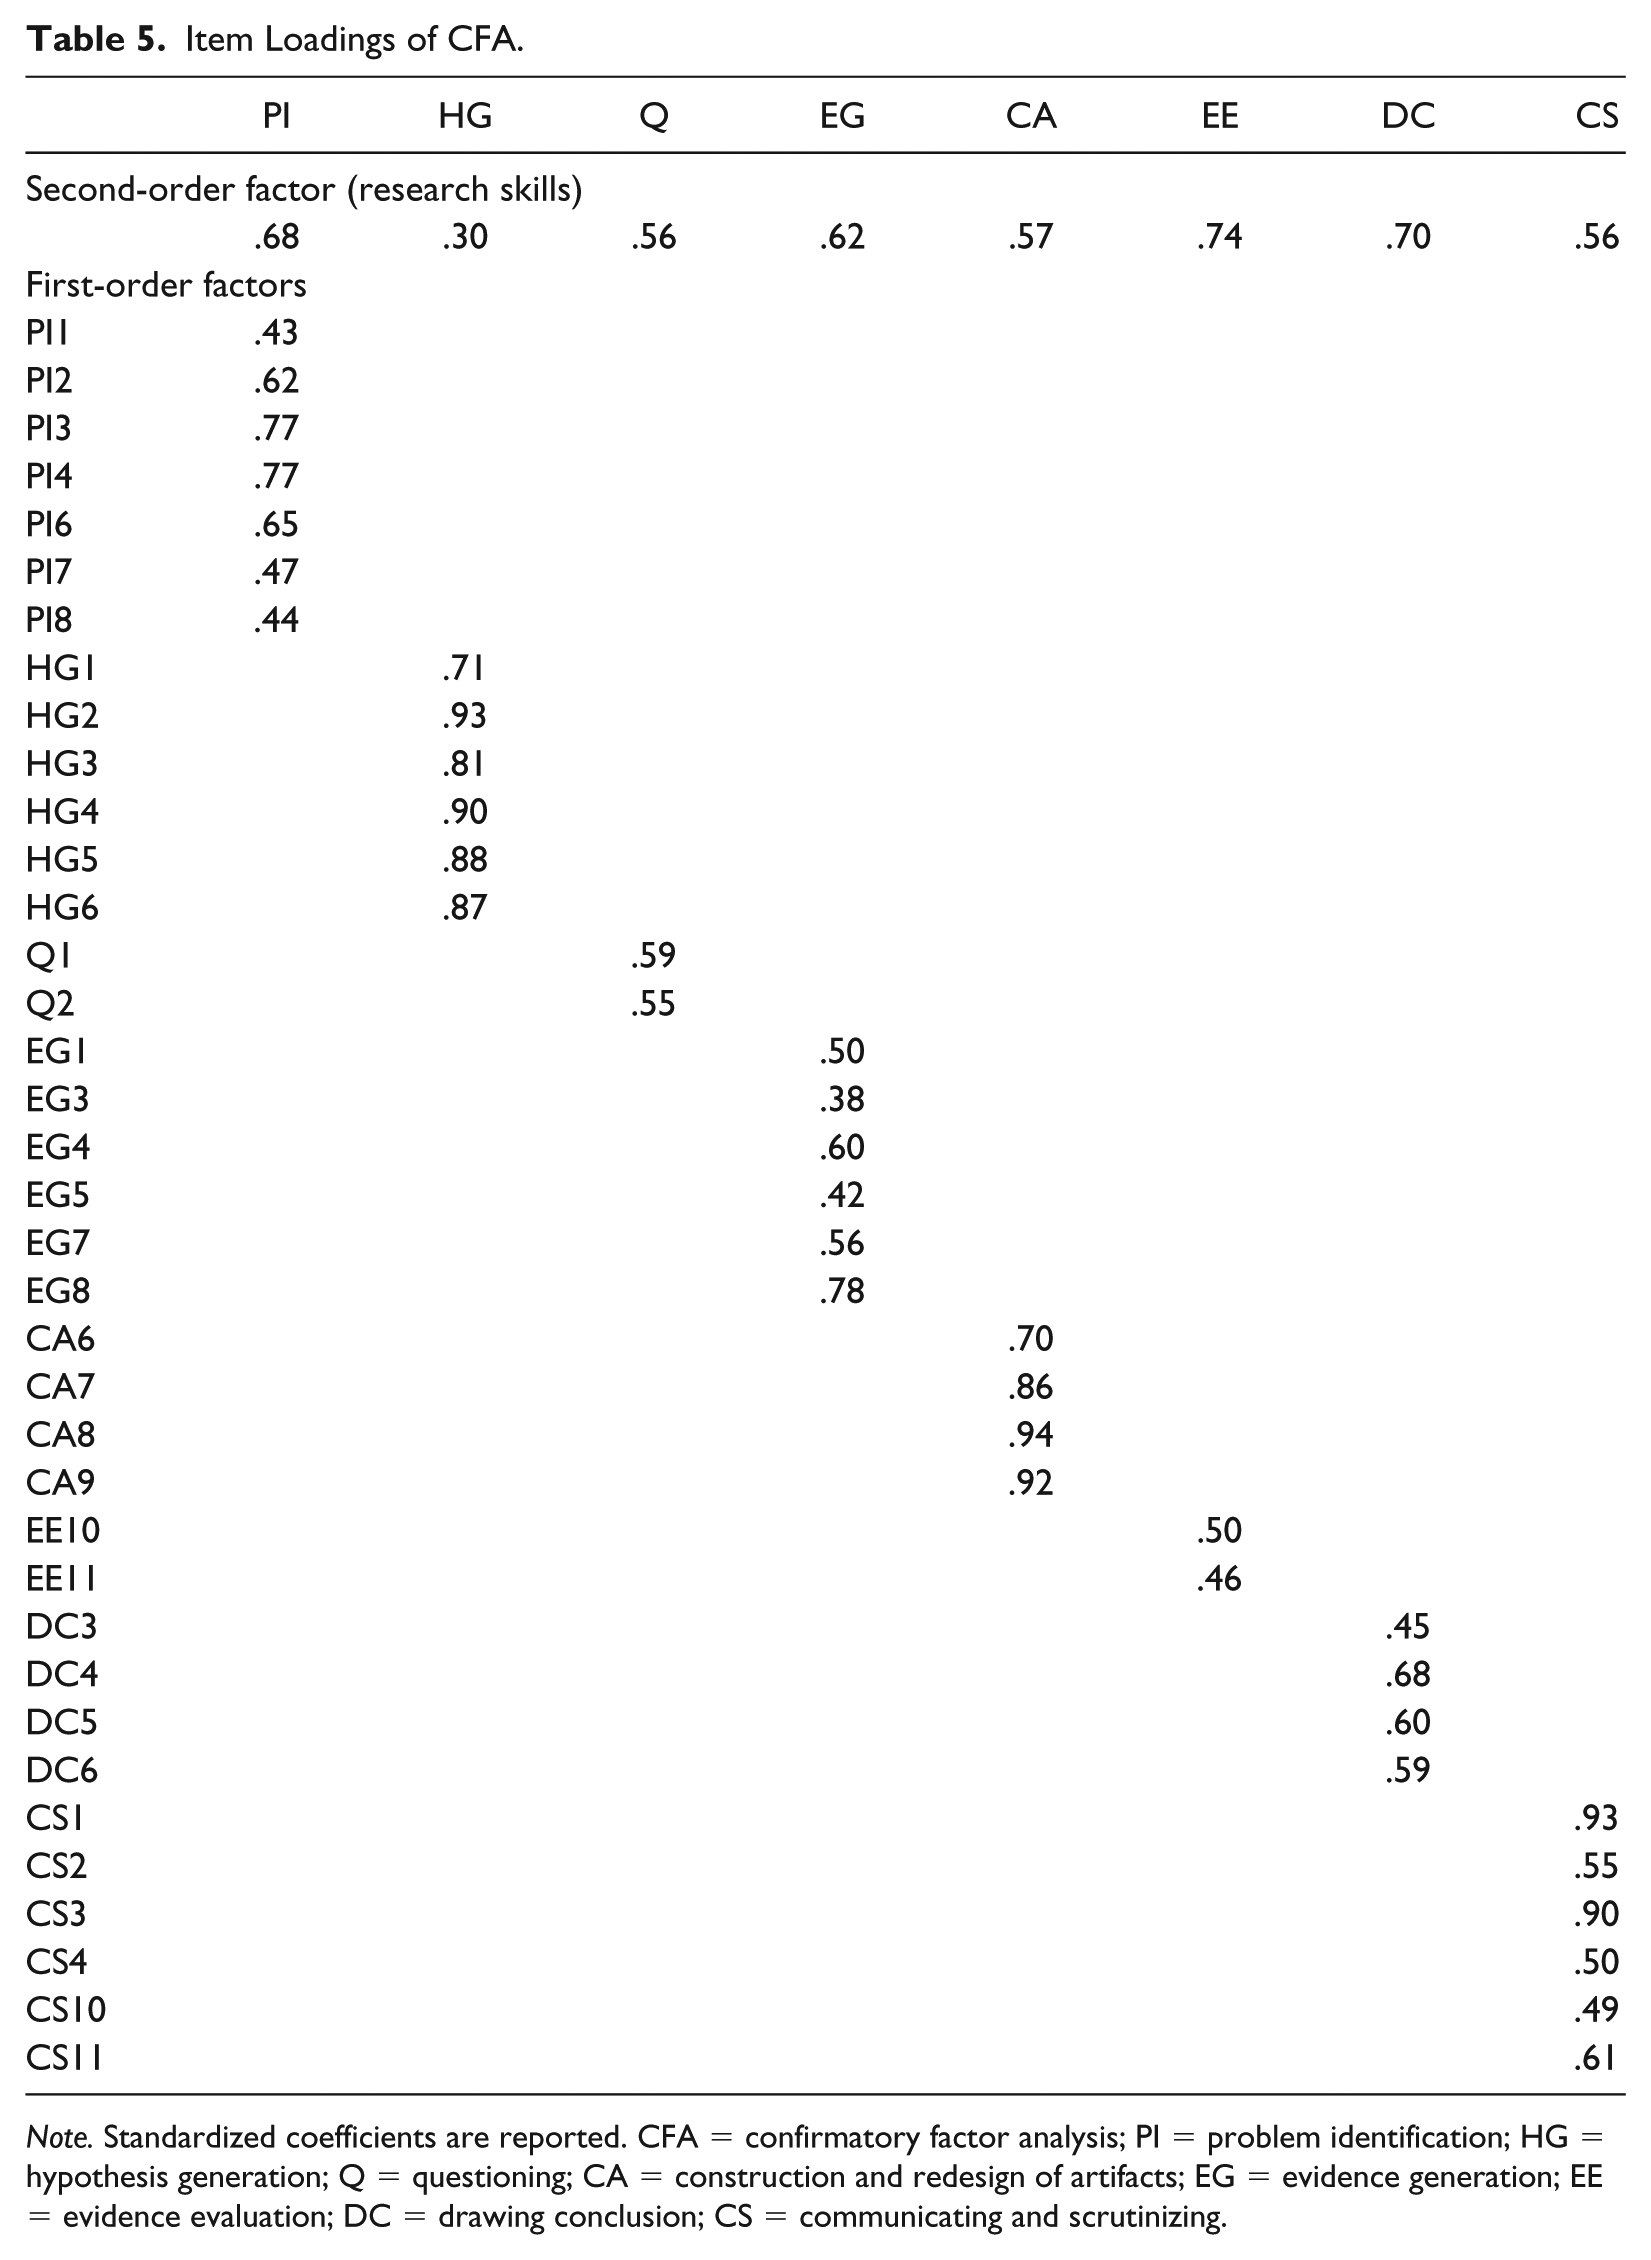
Note. Standardized coefficients are reported. CFA = confirmatory factor analysis; PI = problem identification; HG = hypothesis generation; Q = questioning; CA = construction and redesign of artifacts; EG = evidence generation; EE = evidence evaluation; DC = drawing conclusion; CS = communicating and scrutinizing.
The internal consistency reliability of the subscales of Model 4 was calculated by means of Ordinal Omega Total, and was .79 for problem identification; .90 for hypotheses generation; .71 for questioning; .71 for evidence generation; .93 for construction and redesign of artifacts; .66 for evidence evaluation; and .70 for communicating and scrutinizing. Due to a limited number of items in the scales questioning and evidence evaluation, omega total could not be computed for these scales. For the total test, based on 37 items, ordinal omega total was .87. The interrater reliability, which was measured with Cohen’s kappa, was κ = .89 for the total test, and the κs for the subskills varied between .70 and .96.
Discussion and Conclusion
This study aimed to develop and evaluate an instrument to measure 11th- and 12th-grade students’ research skills in a behavioral sciences context: the LRST. The final LRST consists of 37 items, each related to a (sub)skill (see Table 1, Fischer et al., 2014). In this article, the psychometric quality and the factorial structure of the LRST, administered to 405 11th- and 12th-grade students, are investigated.
The item analysis revealed that the LRST can be considered as an achievement test with medium-level difficulty. In addition, relying on the theoretical framework of Fischer et al. (2014) and drawing upon the Flemish educational guidelines, the content validity of the LRST was established. Furthermore, concerning construct validity, results from factor analyses supported a hierarchical model with eight subordinate latent factors (corresponding to the eight subskills of Fischer et al., 2014), one single uniting upper level latent factor (research skills) and 37 observed variables (each related to one latent factor), producing the closest fit to the data (compared with a unidimensional and an eight-dimensional model). The inadequacy of the unidimensional model is similar to the results reported by Opitz et al. (2017), arguing a multidimensional model to be more probable. After item deletion (based on low factor loadings), the hierarchical model produced reasonable model fit. Furthermore, results from the internal consistency reliability analysis revealed a good value for the total LRST (ordinal omega total = .87). In addition, the internal consistency reliability coefficients varied between .66 and .93 for the subscales.
The results provide initial evidence for using the LRST as a valid measure for research skills proficiency with 11th- and 12th-grade students in general tracks. In addition, the LRST can be administered to further investigate individual differences in research skills proficiency. Furthermore, the LRST can be used as a tool in intervention research, to measure the effects of experimental instructional interventions aiming to foster research skills.
Despite these important theoretical and practical implications, some important limitations of this study need to be addressed. First, it should be noted that, because of item deletion, two scales only consist of two items. Future research should try to optimize or construct (new) items to make a stronger scale.
Second, despite the fact that the hierarchical model was found to be the best fit to the data, and all model fit indices reach (or are very close to) the cutoff values formulated by Hu and Bentler (1999), one could argue that the CFI and TLI values are still (.01) too low (.94 instead of .95), and that the SRMR value is (.01) too high (.09 instead of .08). However, it is argued that the fit indexes used in this study, initially developed to overcome limitations of the χ² statistic (Beauducel & Wittmann, 2005), are based on studies with loadings between .70 and .80 (Hu & Bentler, 1999). As Beauducel and Wittmann (2005) indicated, in psychometric research and in many areas of psychology (because of its complexity and its nonexhaustive character), lower loadings (between .40 and .60) are not rare in CFA. Therefore, Raykov and Marcoulides (1999) suggested the use of RMSEA in such research, because RMSEA does not assume a perfect (and thus unrealistic) model fit. It is clear that, in this study, the confidence interval of the RMSEA is situated below the cutoff point of Hu and Bentler (1999). However, it should be noted that the use of cutoff values is criticized in recent literature by Yuan et al. (2016), although these authors do not want to propose an alternative set of cutoff values as these would be sensitive to similar disadvantages. As such, Chen et al. (2008) questioned whether any fit indices are needed to evaluate a model, but argue that, if used, one must never rely on a single fit index, but examine multiple indices instead. As such, the authors of this article used several fit indices in combination with human judgment (Chen et al., 2008) when reaching the final decision about the evaluation of the model fit.
Third, the question must be raised whether the superiority of the eight-factor and the hierarchical solution (compared with the one-factor solution with one scientific reasoning skill) results purely from the underlying dependence of the items (measuring the same construct), or also results partly from an alternative explanation regarding question format. The fact that the items within a factor are similarly formatted can contribute to the existence of eight distinct factors. As such, these questions call for further investigation.
Fourth, a hierarchical model (compared with a unidimensional and an eight-factor model) seems to be the best fit to the data. However, because the low number of items for two of the eight subscales, and a rather low internal consistency rate for one subscale, the authors recommend to consider the LRST as an instrument measuring research skills with eight theoretically distinct constructs, but to make no distinction between the subskills at an operational level (yet; and thus to rely on the total test scores). This recommendation holds until all subscales are optimized and consists of minimum three items. Furthermore, future research should check for additional construct validity measures. As Boomsma (2000) indicated, testing the validity of the proposed modified models, asks for some sort of cross-validation (ideally with an independent sample from the same population). Although the current sample was too small to cross-validate the model, the authors plan to test the model with an independent sample in the future. Unfortunately, there is no concurrent test to be used for this specific focus to establish convergent validity. Still, discriminant validity can be ensured in future studies by means of an IQ test, or a test measuring language or mathematical skills. To conclude, it would be useful to have some knowledge about the predictive value of research skills proficiency for several measures (such as professional preferences or study success in university; as also recommended by Opitz et al., 2017).
Footnotes
Acknowledgements
This study was carried out within imec’s Smart Education research programme, with support from the Flemish government.
Declaration of Conflicting Interests
The author(s) declared no potential conflicts of interest with respect to the research, authorship, and/or publication of this article.
Funding
The author(s) disclosed receipt of the following financial support for the research, authorship, and/or publication of this article: This research was supported by ITEC, KU Leuven, Belgium; also at imec Kapeldreef 75, B-3001 Leuven, Belgium.