
Abstract
Truancy can have a detrimental impact on student outcomes. Risk assessments are used to identify behavioral and emotional problems associated with school truancy. Although imperative for informing decisions about student’s welfare, risk assessments generally lack substantial validity evidence. Specifically, supporting score interpretation across cultural groups through measurement invariance (MI) is needed for such assessments. This study examined MI, specifically factor invariance (FI), of the Washington Assessment of the Risks and Needs of Students (WARNS) across African American, Latinx, and Caucasian students using confirmatory factor analysis with traditional FI criteria and the equivalence testing (ET) procedure. Results from traditional criteria suggested that the factor structure is similar across groups. The ET procedure demonstrated minor model misspecifications.
Truancy, defined as unexcused absences from school, is linked to risky behaviors, including substance abuse, poor emotional wellbeing, and criminal activity. The U.S. juvenile court system had approximately 50,000 petitioned truancy cases in 2016 (Hockenberry & Puzzanchera, 2018). In response, efforts have increased to identify factors that predict risks and needs among students (Case & Haines, 2010), which continue to be a formidable challenge for researchers, school counselors, and youth service providers. The identification of these factors often involves risk assessments to aid the identification of trajectories of offending behaviors.
School administrators and juvenile justice practitioners have adopted various student standardized risk assessments. The assessment scores help guide the type and level of intervention needed for youth who are chronically absent from school. Despite widespread use, risk assessment scores must have evidence to support intended uses. Many risk assessments lack information supporting validity inferences. Evidence has focused on scoring inferences via factor analysis (e.g., Olver et al., 2009) and extrapolation inferences via correlations of scores with theoretically related variables (e.g., criminal outcomes; Schwalbe, 2007). Even within this evidence, the assumption is that a risk assessment performs similarly across groups or has the property of measurement invariance (MI; Millsap, 2011). Without evidence of MI, risk scores may lack precision, resulting in imprecise decisions for individuals in different groups.
Present Study
The Washington Assessment of the Risks and Needs of Students (WARNS; George et al., 2015) is used by school administrators, courts, and youth service providers to understand behaviors related to truancy. For the WARNS, evidence for a scoring inference (e.g., French & Vo, 2019), and an extrapolation inference (e.g., Iverson et al., 2016) exist. However, the WARNS lacks factor invariance (FI), a form of MI, evidence across diverse groups. We evaluate an extrapolation inference (e.g., Kane, 2013) via FI at the internal factor structure level among African American, Latinx, and Caucasian students. We employ multiple group confirmatory factor analysis with traditional FI dichotomous criteria (e.g., Δχ2, ΔCFI), as well as the equivalence testing (ET) procedure criteria, which recognizes fit as a degree of model misspecification. This dual criteria reporting provides more information about model misfit compared with traditional indices alone (Marcoulides & Yuan, 2017).
Method
Participants
High school participants (N = 1,468) aged 13–20 years in Grades 8–12 from Washington (83.6%; ndistricts = 41) and Georgia (16.4%, ndistricts = 1) schools completed the WARNS in 2018–2019. Schools engaged with the WARNS system (a) as an information-gathering tool or (b) as required by school policy when students surpassed an unexcused absence threshold. Thus, our sample reflects the students who would be assessed given the purpose of the WARNS. The ethnic groups examined included African American (n = 335, 46.6% female), Hispanic (n = 588, 51.3% female), and Caucasian (n = 524, 47.2% female). The average time of completion was 13 min.
Instrument
The WARNS is a 40-item self-report instrument with six specific factors (i.e., aggression-defiance, depression-anxiety, substance abuse, peer deviance, family environment, and school engagement) and a general factor supported via a bifactor model (Strand et al., 2019). Response options range from 0 = Never or hardly ever to 3 = Always or almost always.
Analysis
First, a bifactor model, supported by evidence and use (Strand et al., 2019) was fit for each group with diagonally weighted least squares estimation with the lavaan package in R. Model fit was assessed via (a) fit criteria, χ2 test, comparative fit index (CFI ≥ .90), and root mean squared error of approximation (RMSEA ≤ .08; Brown, 2015), (b) out of bound parameter values, and (c) theory for interpretation and use. Internal consistency reliability was estimated via omega (ω; McDonald, 1999), ω hierarchical (ωH), and ω hierarchical subscale (ωHS; Rodriguez et al., 2016) to highlight reliability differences when accounting for the general factor.
Second, we examined FI via multigroup confirmatory factor analysis (CFA) with pairwise comparisons to allow direct comparison across criteria. Configural invariance (i.e., free parameters and equal factor form), metric invariance (i.e., equal pattern coefficients), and scalar invariance (i.e., equal loadings and intercepts) were examined. Changes (Δ) in χ2, CFI, and RMSEA were used to compare models, where a non-significant Δχ2, ΔCFI < .01, and ΔRMSEA < .01 supported metric invariance, and a non-significant Δχ2, ΔCFI < .01, and ΔRMSEA < .015 supported scalar invariance (Chen, 2007).
Third, we applied the ET procedure to the same models. The procedure estimates adjusted RMSEA values conditioned on N, the number of groups, and df. RMSEA values were obtained for the configural, metric, and scalar models, and for the model comparisons. The RMSEA criteria were: RMSEA <.01 = Excellent; .01–.05 = Close, .05–.08 = Fair; .08–.10 = Mediocre; and >.10 = Poor (Yuan & Chan, 2016).
Results and Discussion
Table 1 contains the model fit for each group. A bifactor model met fit criteria, except for the CFI for the African American sample. However, we continued with the bifactor model, as it was consistent with the WARNS use and practice (Strand et al., 2019). Table 2 provides reliability estimates by group, showing much variability. For instance, the ωHS for the subscale scores ranged .06–.67, .33–.52, and .27–.54 for African American, Caucasian, and Latinx, respectively. The standardized pattern coefficients for the general factor ranged from .18 to .86 for African American, .35 to .78 for Caucasian, and .36 to .83 for Latinx students. Results support the WARNS’ bifactor structure across groups, with a caution about subscale score unique information, given low reliability. However, a minimum ωHS of .50 for specific factors may support score use (Reise et al., 2013).
WARNS Bifactor Model Fit for All Groups.
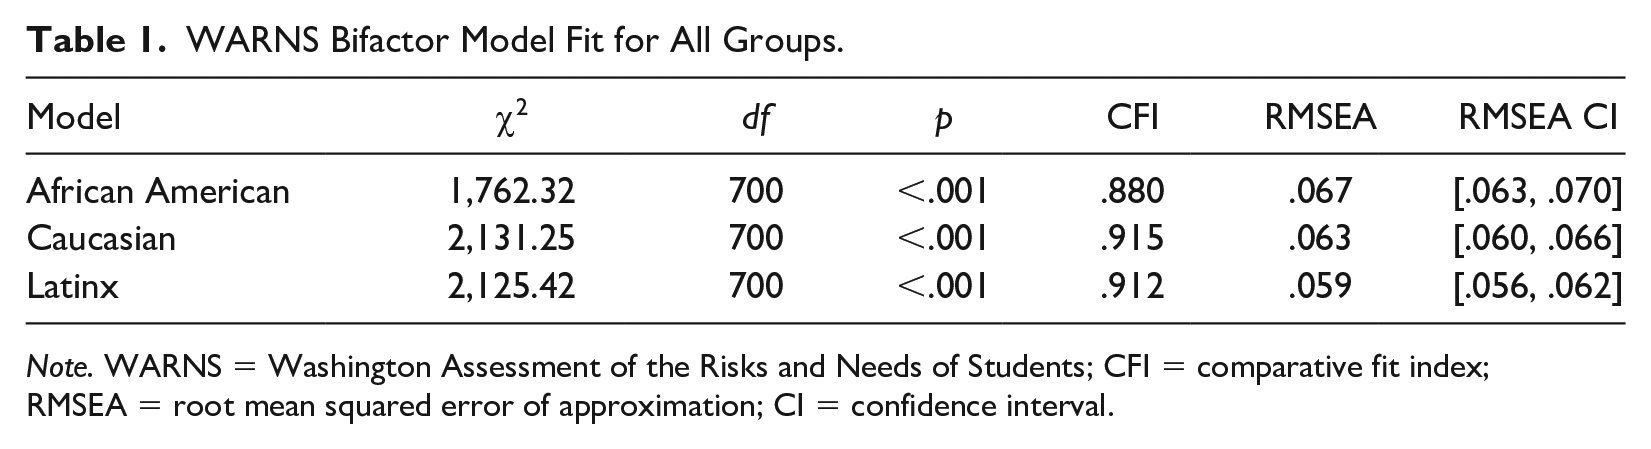
Note. WARNS = Washington Assessment of the Risks and Needs of Students; CFI = comparative fit index; RMSEA = root mean squared error of approximation; CI = confidence interval.
Internal Consistency Reliability Estimates of the Bifactor Model for WARNS Scores.
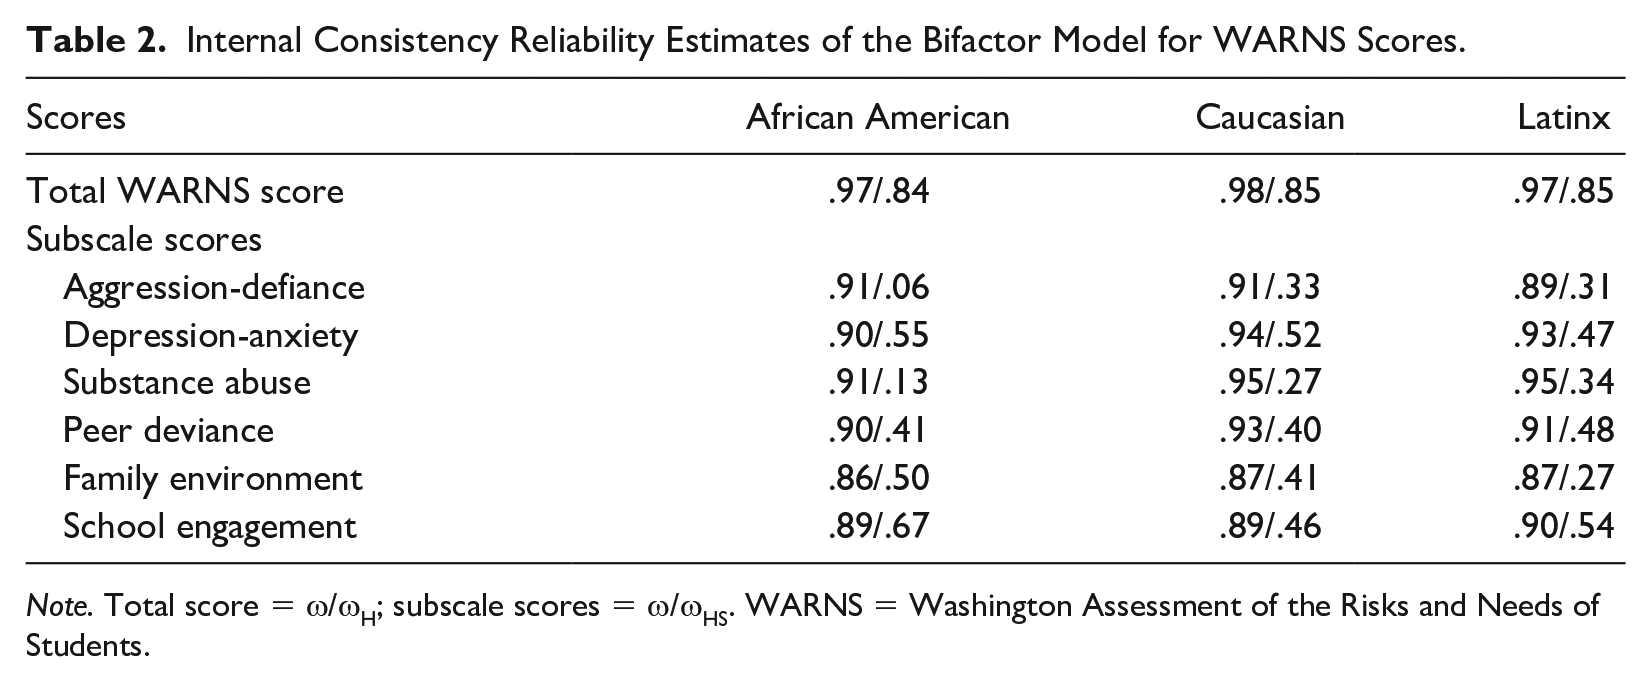
Note. Total score = ω/ωH; subscale scores = ω/ωHS. WARNS = Washington Assessment of the Risks and Needs of Students.
Table 3 contains the results for FI for both the traditional and ET criteria. Configural, metric, and scalar invariance were fully supported with the traditional criteria, indicating the factors structure was the same across groups. For the ET procedure, the configural models had Fair fit for all comparisons. For metric invariance, Excellent fit for all comparisons was observed, whereas for scalar invariance Excellent fit was only observed for the Caucasians versus Latinx comparison. For the remaining comparisons, Close fit was observed. These results support the usefulness of the dual criteria because, for example, ET’s results may point to the small amounts of differential item functioning on the WARNS across these groups (French & Vo, 2019). Given the results of the two procedures, the use of the WARNS total score for decisions for these groups is likely not influenced by the degree of model misfit or FI.
Factor Invariance (FI) Indices by Method for African American (A), Latinx (L), and Caucasian (C) Students.
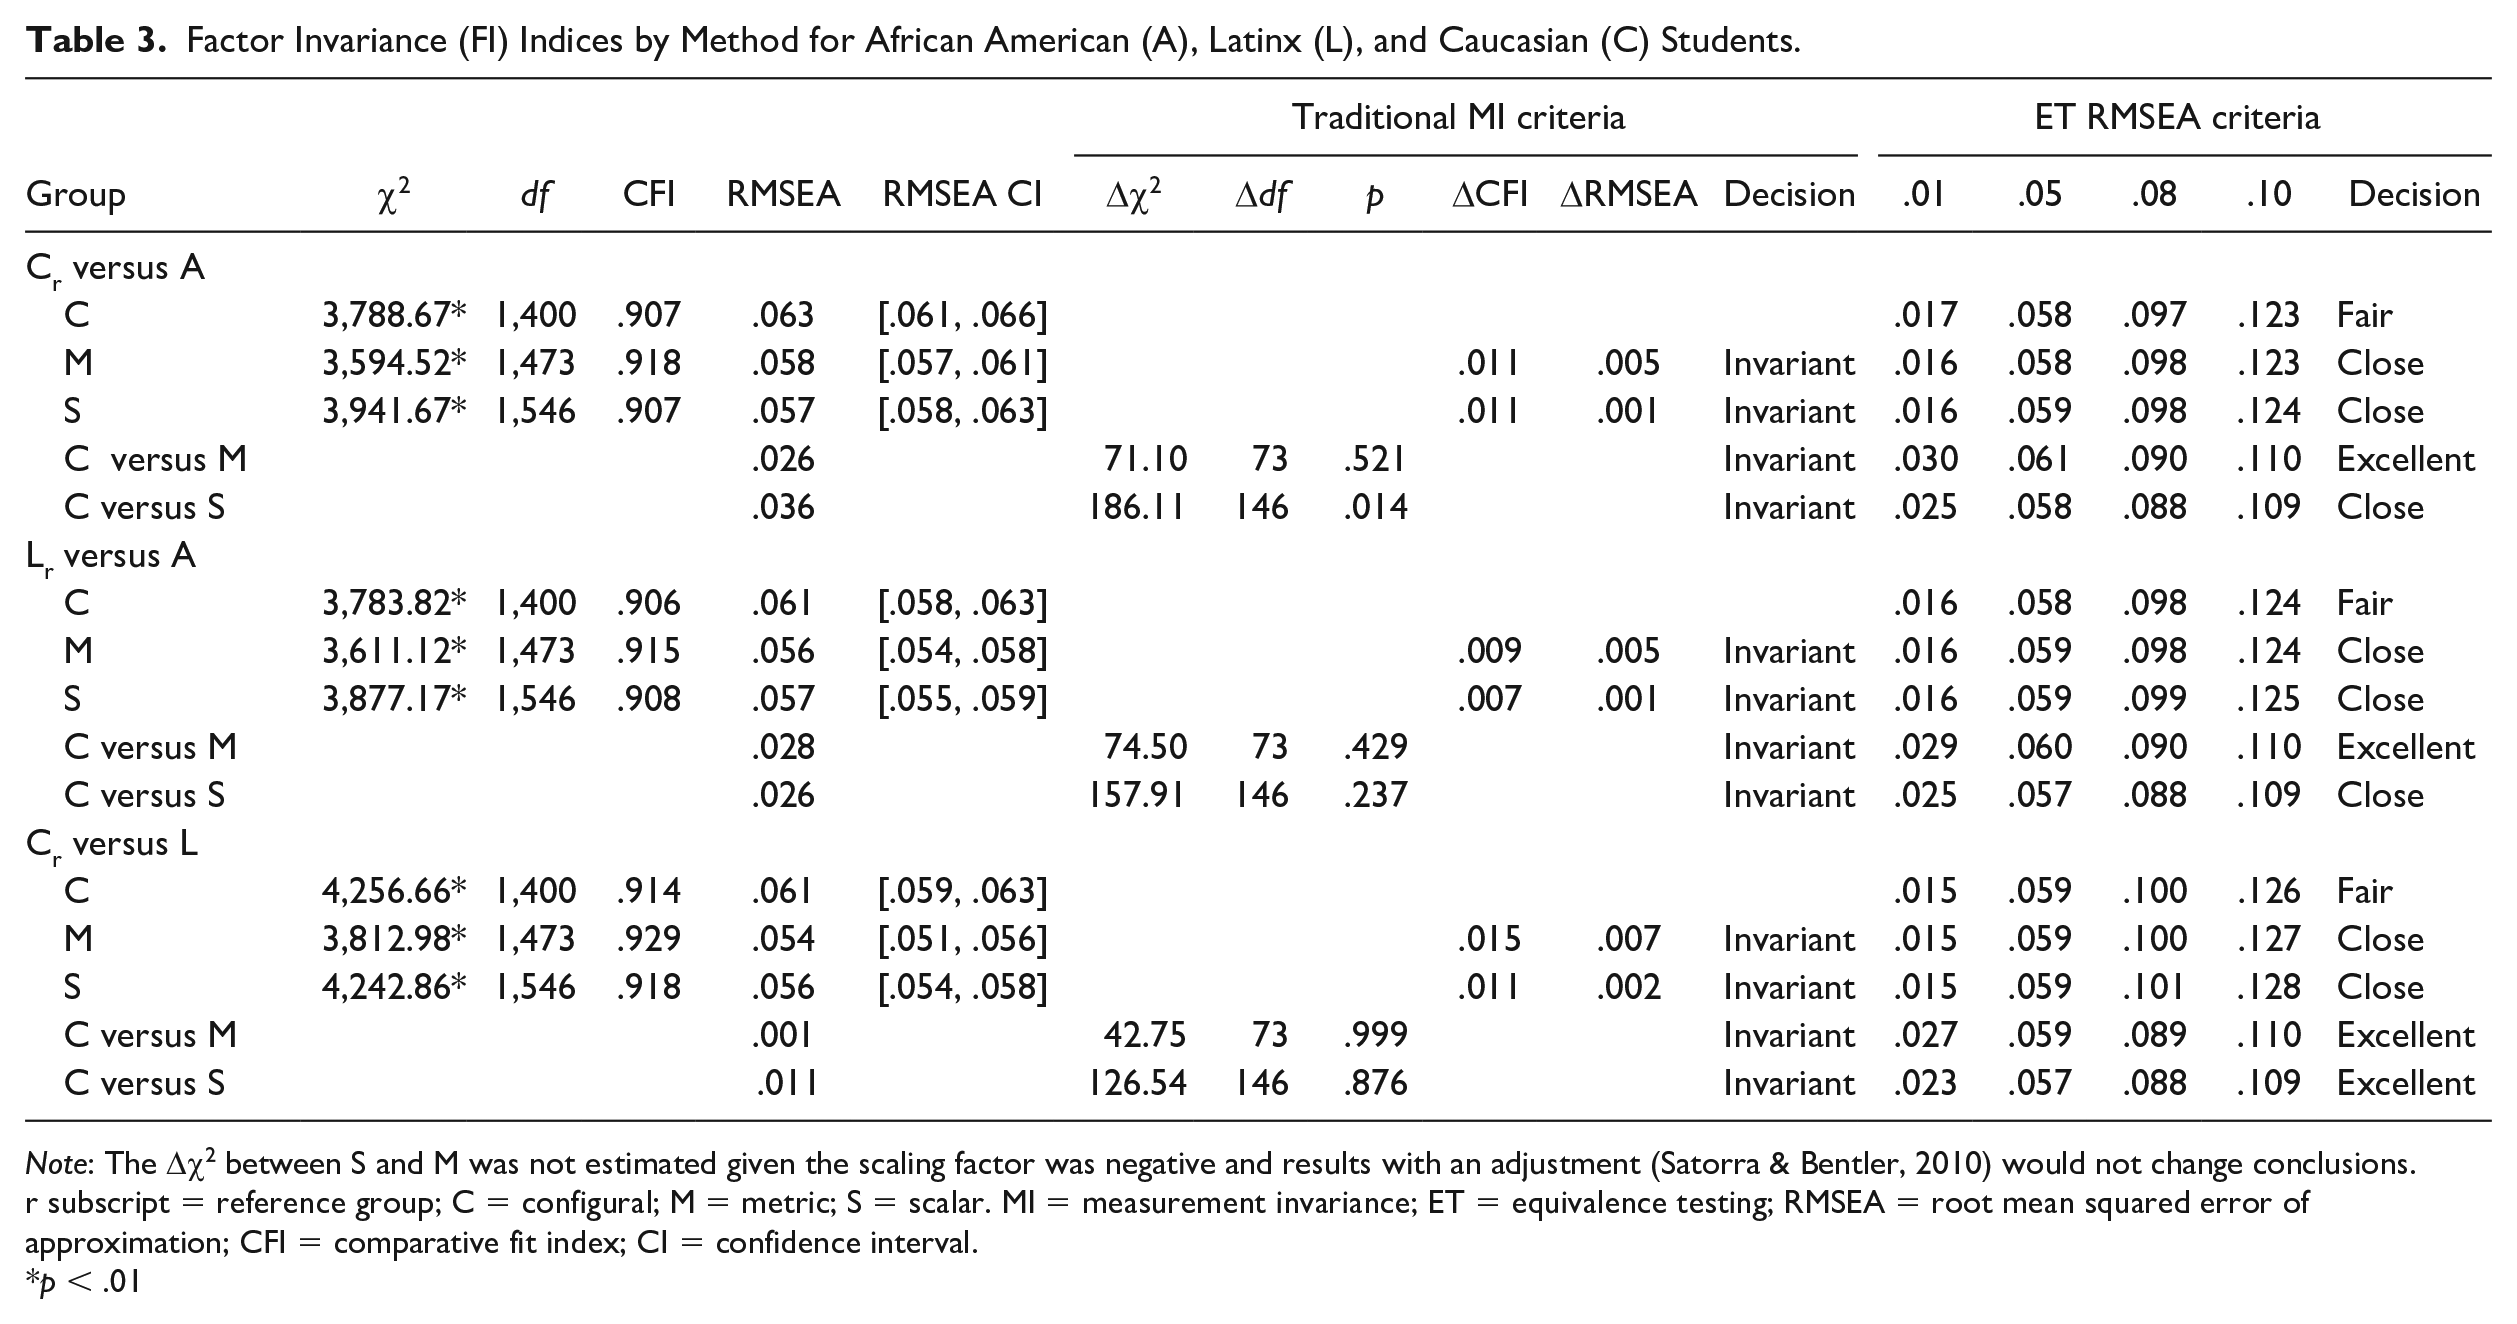
Note: The Δχ2 between S and M was not estimated given the scaling factor was negative and results with an adjustment (Satorra & Bentler, 2010) would not change conclusions. r subscript = reference group; C = configural; M = metric; S = scalar. MI = measurement invariance; ET = equivalence testing; RMSEA = root mean squared error of approximation; CFI = comparative fit index; CI = confidence interval.
p < .01
The results are limited by a few factors. First, the generalizability of results is limited given the sample is mainly from Washington State, and the African American sample is primarily from Georgia. Replication with a more heterogeneous sample is warranted, as the student context could influence responses. Second, existing general ET guidelines for misfit were employed. Additional work to understand the sensitivity of the ET criteria to detect meaningful factor variance across groups is needed. Third, the use of the dual criteria is a relatively new approach, and its application is not fully integrated into MI studies. Additional methodological work may help to understand how criteria can identify meaningful model misfit.
The study supports a bifactor model for the WARNS across three high school ethnic groups, which represents the intended population assessed by the instrument. The combined use of traditional FI and ET criteria can benefit such work. The combination of methods allows for a fine-grained examination of FI to understand, in this case, where the content may need to be reviewed for certain groups. For example, where Fair criteria are indicated, cognitive think-aloud protocols with those groups can probe if the content of the assessment is understood as intended. That said, our results provided evidence to support an extrapolation inference for the WARNS scores for these groups. Such work can aid practitioners in their work to support youth.
Footnotes
Acknowledgements
We acknowledge the assistance of Cihan Demir in the production of this work.
Author’s Note
B.F.F. was the lead researcher of the project including all aspects from the idea to the final manuscript. D.A. was the lead analyst and contributed to the writing of the manuscript. T.T.V. assisted with analyses and writing of the manuscript.
Declaration of Conflicting Interests
The author(s) declared no potential conflicts of interest with respect to the research, authorship, and/or publication of this article.
Funding
The author(s) received no financial support for the research, authorship, and/or publication of this article.