
Abstract
This study explored the underlying latent structure of items on the Mindset Assessment Profile (MAP) tool, explored whether subgroups of students exist based on the latent structure of MAP items, and tested whether subgroups were differentiated on standardized measures of reading comprehension, vocabulary, and word reading. Participants included 431 fourth-grade students. Confirmatory factor analysis revealed that a three-factor model provided the most parsimonious fit to the data. Results of exploratory finite mixture model analysis with auxiliary regression suggested five classes of students, with the students categorized as growth mindset—high effort profile having the highest observed reading comprehension (M = 451.98 and SD = 38.88) and vocabulary (M = 454.37 and SD = 34.74) scores. By contrast, students categorized as fixed mindset—higher effort had the lowest observed reading comprehension and vocabulary scores. Limitations and directions for future research, and implications for using MAP assessment to inform intervention are discussed.
Introduction
Self-theories, such as Dweck’s theory of intelligence, are focused on the extent to which individuals believe that aspects of who they are can be changed. Dweck and Leggett (1988) postulated a social cognitive model that suggests that implicit beliefs may hold different assumptions about the malleability and nature of traits or abilities. In the context of Dweck’s theory of intelligence (2006), individuals who believe that an ability or trait is malleable and can be changed conform to an incremental theory of intelligence known as a growth mindset. Conversely, individuals who believe that a given ability or trait is fixed and cannot be changed are characterized as having a fixed mindset (i.e., an entity theory of intelligence (Chiu, Hong, & Dweck, 1997; Dweck, Chiu, & Hong, 1995). There is increasing interest in understanding students’ mindset or their belief that their intelligence and academic skills can be grown or are fixed (e.g., Dweck, 2006; Dweck & Leggett, 1988). Dweck and her colleagues have hypothesized that when students believe that these skills are fixed, they have less motivation for effort and practice. When they make errors or struggle, for example, in the domain of learning to read, they attribute this to a static condition of being a poor reader or having limited intelligence. By contrast, Dweck and colleagues posit that students with a growth mindset of intelligence (hereafter referred to as growth or fixed mindset) believe intelligence and academic skills can develop through effort and can be improved by incorporating feedback (e.g., Hong, Chiu, Dweck, Lin and Wan (1999) and Yeager and Dweck (2012)).
Current Status of Growth Mindset of Intelligence Research
A recently published set of meta-analyses by Sisk, Burgoyne, Sun, Butler, and Macnamara (2018) of growth mindsets explored the correlations between mindsets and academic achievement to estimate the average correlation and potential moderators (e.g., developmental stage and academic risk status) to shed light on individual differences. The average correlation between growth mindset and academic achievement was weak (r = .10), reflecting findings from a prior meta-analysis (Burnette et al., 2013). The effect was not significantly moderated by the academic risk status or socioeconomic status, but the developmental stage was a moderator (i.e., r = .19 for children). Sisk et al. noted the high degree of heterogeneity of effects. Beyond the importance of the findings presented in terms of effect sizes, there are at least two aspects of the meta-analyses that have bearing on the state of growth mindset research. First, of the 273 effect sizes that were used for the first meta-analysis focused on the study of individual differences, only 18% of the sample stemmed from studies focused on elementary-aged students. Petscher, Al Otaiba, Wanzek, Rivas, and Jones (2017) summarized the state of growth mindset research for elementary students as minimal and noted that the corpus of existing studies for this population frequently lacks (a) normative, standardized outcomes; (b) the formation of latent factors of mindset and outcomes; and (c) outcomes such as reading and language that are key to developmental skill acquisition for children at this age level. Second, Sisk et al. (2018) did not evaluate the type of mindset measures used in the reviewed studies, and specifically noted that they found few studies reporting reliability estimates, instead assuming a reliability of .80, citing Dweck et al. (1995) as a resource for this level. They did note that most studies reviewed used Likert scales to ask the extent to which participants agreed or disagreed with statements about the degree to which intelligence is malleable. However, it is notable that for some studies, mindset was measured only by asking one to three items; in contrast, one study (Blackwell, Trzesniewski & Dweck, 2007) used eight items that comprise the Mindset Assessment Profile (MAP).
In addition to underscoring the lack of consistent measurement for mindset broadly, it is critically important to note the lack of psychometric data for the MAP, which is needed to inform work to understand the relations between mindset and important academic outcomes, and specifically to understand these relations for children. For example, at the fourth grade, when children are expected to read to learn and apply reading to a variety of genres in content area reading, there might be a relatively higher association between mindset and reading. An understanding of the relation of mindset to reading could inform reading intervention and could also inform how to group students for instruction. In one preliminary study of the MAP in a sample of fourth-grade students, Petscher et al. (2017) used the MAP (described in the measures section) and a researcher-developed tool of domain-specific growth mindset related to reading. A bifactor model that included a general factor called global mindset (i.e., a factor indicated by the MAP items and the reading mindset items) as well as specific factors of general mindset (MAP items only) and reading mindset (reading mindset items only) provided the best fit to the data compared to a single-factor model or a correlated trait model. The confluence of MAP factors was significantly related to end-of-year reading comprehension above and beyond students’ initial word reading, and explained 15% unique variance in reading comprehension above the word reading ability.
Why additional research is needed on the MAP is four-fold. First, the MAP tool is a key component of the Mindset Works® program that purports to “lay the foundation with growing early mindsets and SEL competencies” and provides a “blended learning approach [that] allows time for classroom discussions, reflection, and application of mindset principles” in schools (Mindset Works, 2019). Second, robust estimates of reliability and validity are not available on scores from the assessment. Moreover, total scores on the eight-item MAP result in assignment to one of ten profiles, five profiles that are associated with fixed mindset (called F1-F5) and five profiles that are associated with growth mindset (called G1-G5) with nuanced heterogeneity across each. See Appendix A for a description of the profile groupings from Mindset Works (2019).
To date, there appears to be no empirical support for the separation of profiles and whether individuals in the profiles are meaningfully distinguished on important, educationally relevant outcomes. Third, as districts around the United States adopt the Mindset Works® program or advocate for growth mindset measurement (e.g., Chartiers Valley School District, Pennsylvania; Jefferson County School District, OR; Manhattan Beach Unified School District, CA; Mineola Union Free School District, NY; and San Juan Unified District, CA), psychometric integrity is critical to ensure that scores are reliable and valid, and demonstrates an empirical capability of classifying students into mutually orthogonal groups. Fourth, given the potential links among mindset, emotional well-being, anxiety, and educational outcomes, it is critical to understand how scores from a widely used assessment can and should be used for understanding individual differences as well as in thinking about clinical applications of scores. Therefore, we proposed three research aims in this study to extend and contribute uniquely to the literature. First, we described the underlying latent structure of scores from the MAP tool. Second, we explored whether subgroups of students exist based on the latent structure of MAP scores. Third, we explored whether the subgroups were differentiated on standardized measures of reading comprehension, vocabulary, and word reading.
Method
Participants
Participants were 431 fourth-grade students from the south and southeast regions of the United States. Female students made up 51% of the sample. With regard to ethnicity, 26% of the sample were identified as Hispanic. The racial composition of the sample was 51% black, 33% white, 7% Native American, 4% Asian, and 5% not reported. The vast majority of the sample were considered low income (82%), 42% were English learners, and 7% were identified as having a disability.
Measures
MAP (Mindset Works, 2019). The MAP is an eight-item assessment from the student mindset survey that measures students’ level of fixed or growth mindset. Students respond to items on a scale of 1–6 based on their self-beliefs of intelligence including “No matter how much intelligence you have, you can always change it a good amount (Item 1),” “You can learn new things, but you cannot really change your basic intelligence (Item 2),” “I like school work best when it makes me work hard (Item 3),” “I like school work best when I can do it really well without too much trouble (Item 4),” “I like school work that I will learn from even if I make a lot of mistakes (Item 5),” “I like school work best when I can do it perfectly without any mistakes (Item 6),” “When something is hard, it just makes me want to work more on it, not less (Item 7),” and “To tell the truth, when I work hard at my schoolwork, it makes me feel like I am not very smart (Item 8).” Total scores from the MAP are then used to classify students into 1 of 10 MAPs. No reliability or validity is reported for this assessment.
Woodcock–Johnson III Tests of Achievement (WJ-III; Woodcock, Mcgrew, & Mather, 2001). Students’ word reading ability was assessed via the individually administered letter-word identification (LWID) subtest. LWID requires students to name individual letters and read real words presented. Test–retest reliabilities for the subtest are .81 for the fourth grade.
Gates–MacGinitie Reading Test (GMRT; MacGinitie, MacGinitie, Maria, Dreyer, & Hughes, 2006). The GMRT is a group-administered, norm-referenced test. The reading comprehension and vocabulary subtests were administered. During the reading comprehension subtest, students are presented with multiple paragraph-length reading passages and related multiple-choice questions. Passages include both narrative and expository texts. Test–retest reliabilities are above .85; alternate-form reliability is .86 for the fourth-grade level. The vocabulary subtest presents words in context, and the student chooses the correct meaning of the target word. Test–retest reliabilities are above .85. Construct validity estimates range from .79 to .81.
Procedure
Fourth-grade students at the 10 schools were administered the reading comprehension subtest of the GMRT during the fourth or fifth week of school. Over three and half weeks, trained research staff administered the reading assessments to students in a quiet area of their schools. Members of the research team read standardized instructions aloud to the students, then read each item aloud as the students read along silently. The first set of items consisted of practice prompts designed to ensure that participants understood the survey format and response patterns. In case any students had struggled with the online format or use of the mouse or keyboard, teams were provided an identical paper version of the survey. Participants took approximately 10 minutes to complete the survey, and no students elected to or were identified as needing the paper version. Participants were administered assessments in a counter-balanced order at the end of September and beginning of October during a class period.
Data Analysis
Confirmatory factor analysis (CFA) initially tested the viability of the MAP items as a unidimensional model. The current version of the MAP does not delineate among the items as subscales; thus, a one-factor model (Model 1) served as a baseline configuration for estimation. A review of the items suggested that question 1 from the assessment was worded positively for growth mindset (i.e., “No matter how much intelligence you have, you can always change it a good deal”), question 2 was worded for fixed mindset (i.e., “You can learn new things, but you cannot really change your basic level of intelligence”), and the remaining six items were worded in such a way to reflect on effort perceptions (e.g., Item 3 = “I like my work best when it makes me think hard”). One alternative factor model included a two-factor model with questions 1 and 2 loading on a factor reflective of mindset, and the other items loading on a perceived effort factor (Model 2). A third model was a three-factor model where each of questions 1 and 2 were set as single-item indicators of separate growth and fixed mindset constructs, respectively, and questions 3–8 loading on the perceived effort construct (Model 3). Last, a bifactor model was specified, where the questions loaded on the specific constructs of Model 3 as well as a global factor that was indicated by all questions (Model 4). The comparative fit index (CFI) and Tucker–Lewis index (TLI) were used to evaluate incremental fit with values of at least .95 commensurate with acceptable fit. The root mean square error of approximation (RMSEA) was also used for judging acceptable model fit with values <.05 frequently used as an optimal target.
Exploratory factor mixture models (E-FMMs; Muthen, 2008) estimated the number of subgroups that best reflected categorical individual differences on the latent constructs. E-FMM can be used to model distinctions in latent variables as opposed to continua (Borsboom, Rhemtulla, Cramer, van der Maas, Scheffer, & Dolan, 2016) and is useful in the psychometric process to evaluate the presence of types in developed measures. Clark, Muthén, Kaprio, D'Onofrio, Viken, & Rose (2013) offered a sequence of five steps to build E-FMM with the broad goal as selecting the best factor mixture model in light of the best factor analytic model. Our modeling process began with identifying the best factor model through the CFA. We then estimated 2–6 classes assuming measurement invariance to facilitate a consistent interpretation of factors across classes (Lubke & Muthen, 2005). Akaike information criterion (AIC), Bayesian information criterion (BIC), the Vuong–Lo–Mendell–Rubin (VLMR), and the adjusted Lo–Mendell–Rubin (LMR) ratio tests were used to judge whether model c or model c-1 provides better fit. A nonsignificant p-value for the VLMR and LMR is indicative that model c does not significantly improve upon the fit of model c-1, and lower AIC and BIC models reflect better fitting solutions. Entropy was used as a measure of model usefulness with values closer to 1.0 representing greater model usefulness. Auxiliary regression analysis for the final E-FMM tested group differences among the c profiles on the distal outcomes of GMRT reading comprehension and vocabulary as well as the WJ-III LWID task. Hedges’ g was used to compute the standardized effect size difference between pairwise c profiles for each of the three distal outcomes. Items were treated as categorical in the estimation of the latent constructs using the weighted least squares multivariate estimator. Mplus 8 software was used for all latent variable models.
Results
Descriptive Statistics
Descriptive Statistics and Correlations for Observed Measures.

Note. MAP = Mindset Assessment Profile tool; reading comp = GMRT—reading comprehension; vocab = GMRT—vocabulary; LWID = WJ-III letter-word identification; GMRT = Gates–MacGinitie Reading Test.

Quantile estimates of the conditional relation between GMRT reading comprehension (upper left), GMRT vocabulary (upper right), and WJ-III letter-word identification (lower center) with MAP total scores.
Confirmatory Factor Analysis
Confirmatory Factor Analysis Model Fit Indices.

Note. Model 1 = one-factor model; Model 2= two-factor model; Model 3 = three-factor model; Model 4 = three-factor, bifactor model; Model 5 = Model 4 + residual covariance; Model 6 = Model 1 + residual covariance; Model 7 = Model 2 + residual covariance; Model 8 = Model 3 + residual covariance. Models 2, 4, and 7 did not converge to a solution. RMSEA = root mean square error of approximation; LB = lower bound estimate for the 90% confidence interval of the RMSEA; UB = upper bound estimate for the 90% confidence interval of the RMSEA; CFI = comparative fit index; TLI = Tucker–Lewis index.
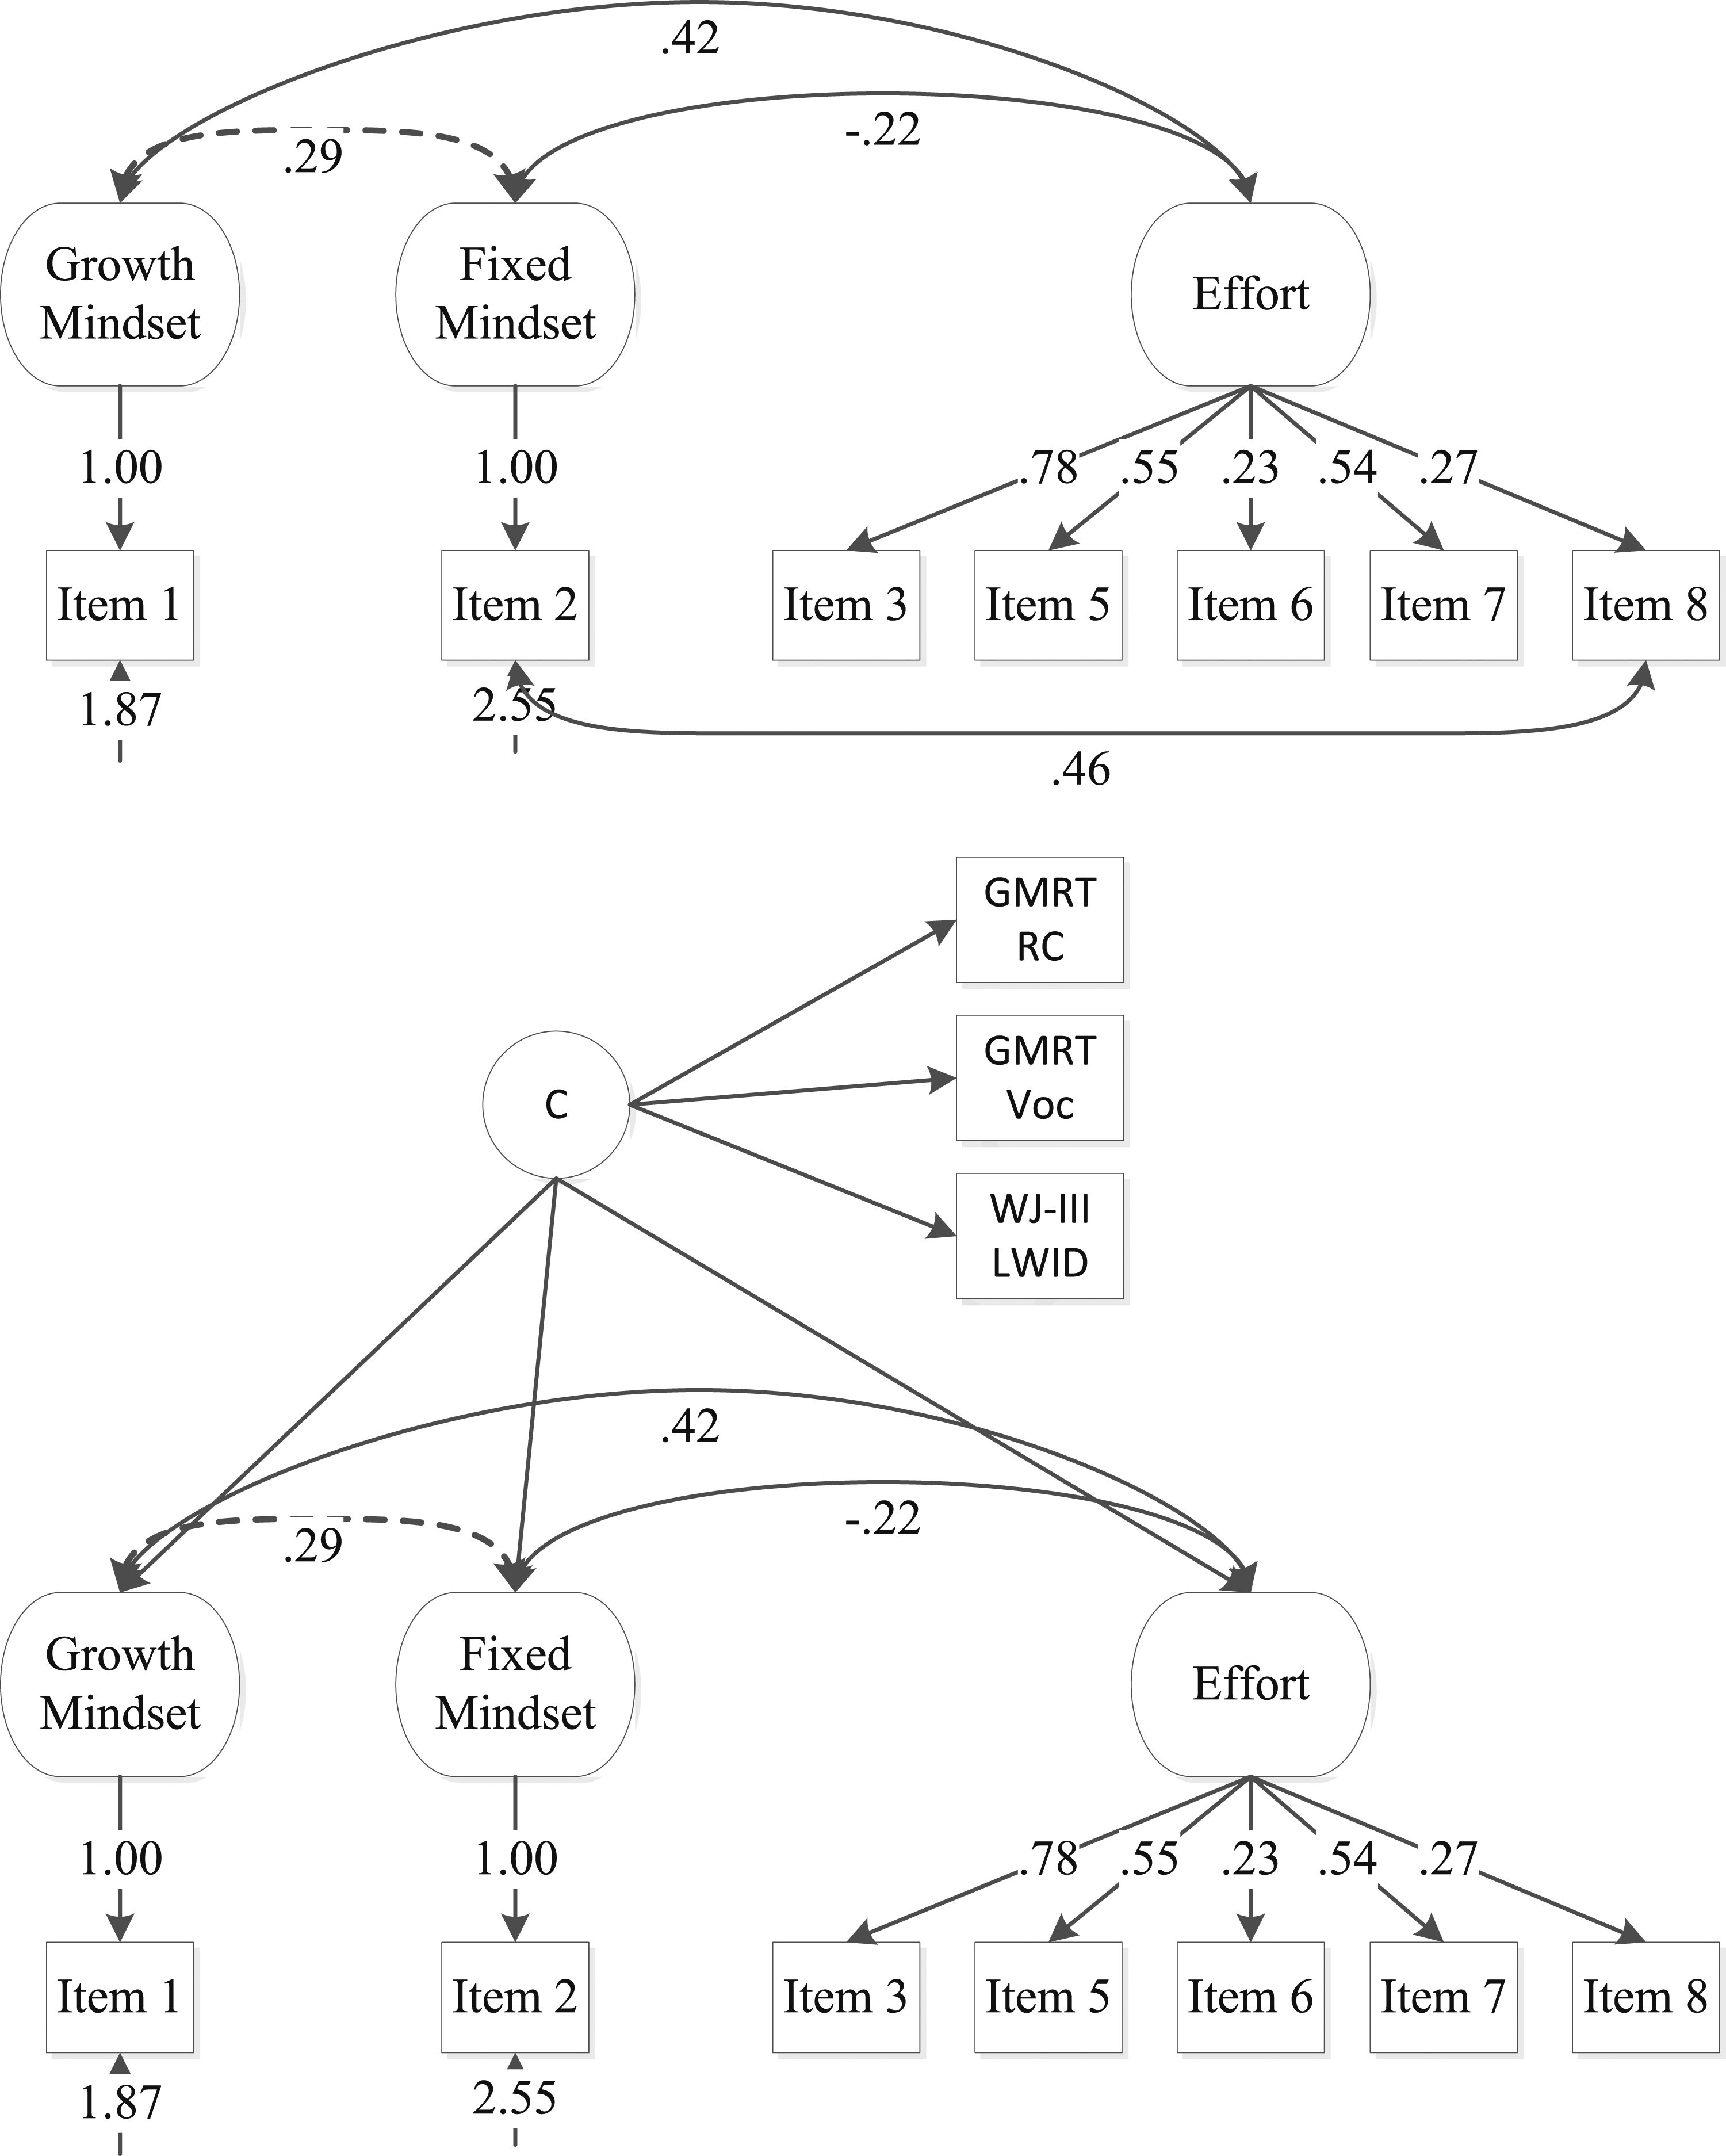
Mindset Assessment Profile three-factor model result (top) and factor mixture model with auxiliary regression (bottom).
Exploratory Factor Mixture Models
Factor Mixture Model Fit Results for 2- to 6-Class Solutions.
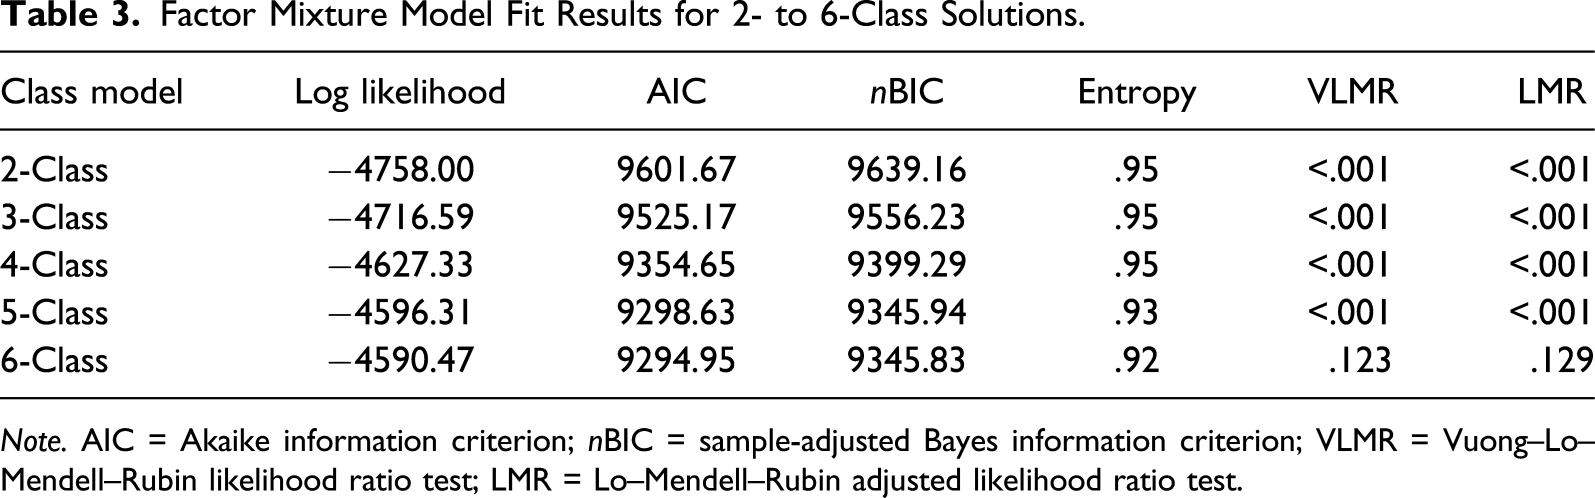
Note. AIC = Akaike information criterion; nBIC = sample-adjusted Bayes information criterion; VLMR = Vuong–Lo–Mendell–Rubin likelihood ratio test; LMR = Lo–Mendell–Rubin adjusted likelihood ratio test.

Factor mixture model Mindset Assessment Profile means for Class 1 (fixed mindset, high effort; n = 44), Class 2 (growth mindset with fixed ideas, high effort; n = 152), Class 3 (growth mindset, high effort; n =148), Class 4 (low mindset, average effort; n = 33), and Class 5 (referent, n = 54).
Latent MAP Assessment Profile Means of Auxiliary Variables and MAP Total Scores.
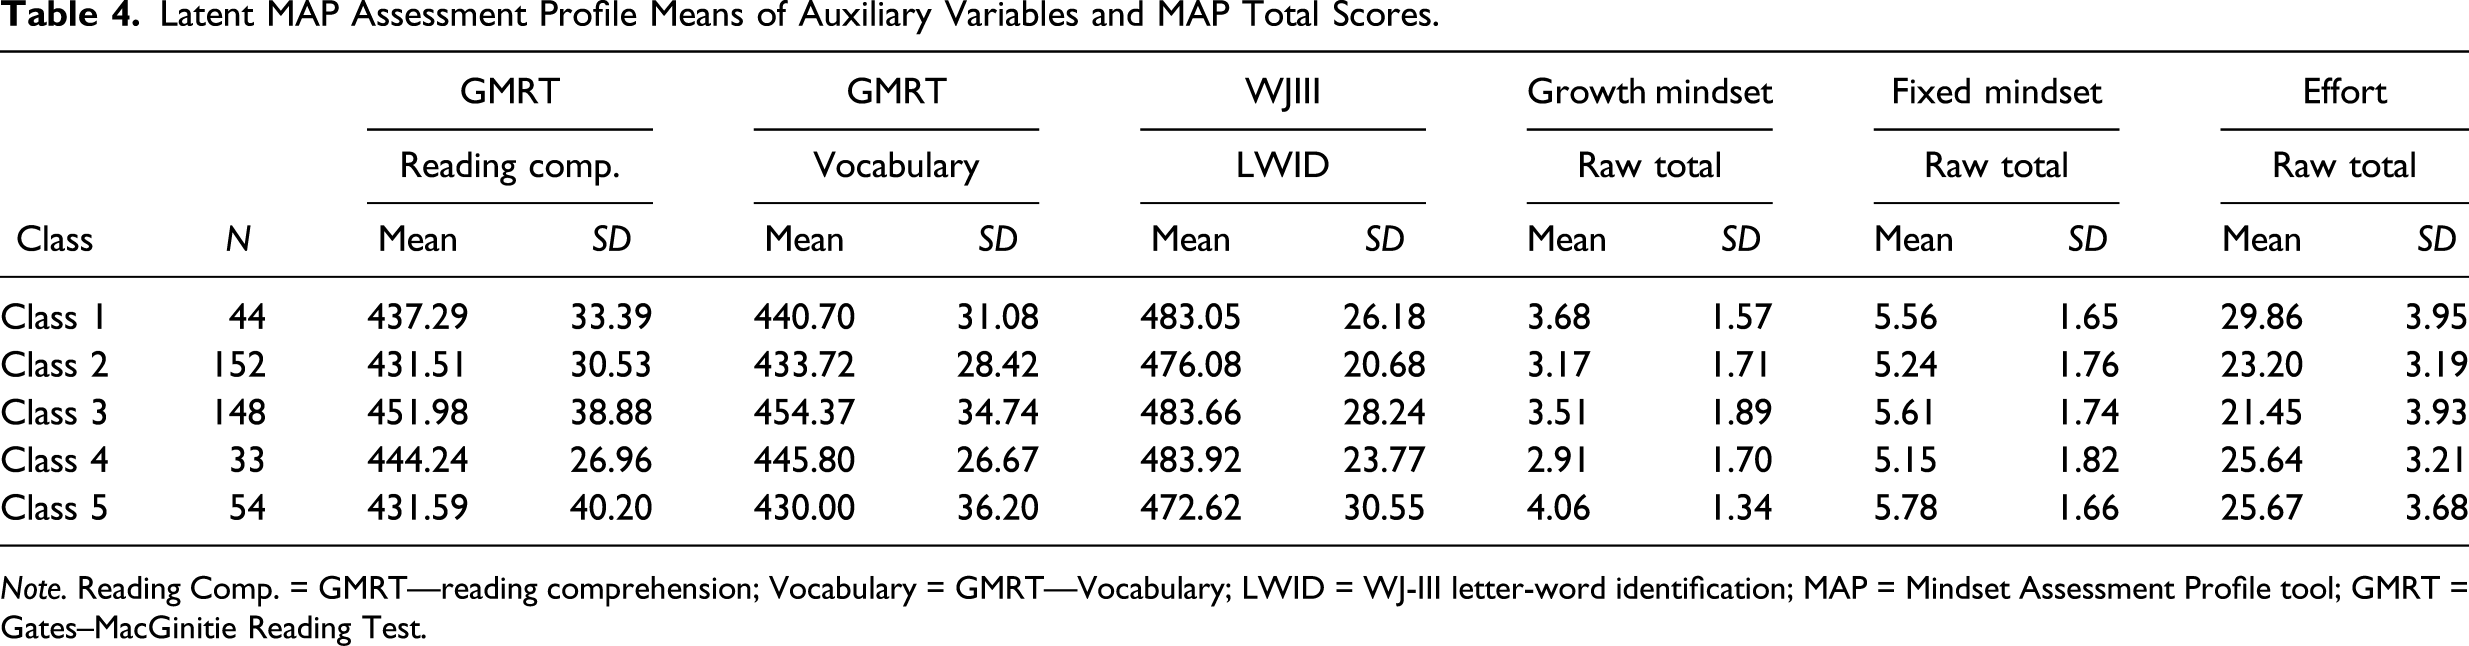
Note. Reading Comp. = GMRT—reading comprehension; Vocabulary = GMRT—Vocabulary; LWID = WJ-III letter-word identification; MAP = Mindset Assessment Profile tool; GMRT = Gates–MacGinitie Reading Test.
Auxiliary Mixture Model Contrasts among Latent MAP Profiles on Reading Comprehension, Vocabulary, and Word Reading Outcomes.

Note. Small standardized effect sizes are in bold; moderate standardized effect sizes are bold and italicized. The first class listed in each contrast is the referent such that a positive effect size is in favor of the second class, and a negative effect size reflects mean differences in favor of the first class. p-values in bold are statistically significant after applying Benjamini–Hochberg correction for the false-discovery rate. MAP = Mindset Assessment Profile tool; GMRT = Gates–MacGinitie Reading Test; WJIII-LWID = Woodcock–Johnson III letter-word identification.
Discussion
The results of the present study provide initial evidence of the reliability, factor structure, and estimated profiles for the MAP in elementary school and the relations between empirically estimated profiles and key reading outcomes. Contrary to the current recommendation that the 8-item assessment conforms to a unidimensional construct, findings suggested that a multidimensional structure provided better fit via a three-factor model of growth mindset (MAP Item 1), fixed mindset (MAP Item 2), and effort (MAP Items 3–8) where the mindset factors were reflective of single-item indicators. The growth and fixed mindset factors were not statistically correlated with each other (ψ = .29, p = .354), whereas growth mindset was moderately related to effort (ψ = .42, p < .001), and fixed mindset was weakly related to effort (ψ = −.22, p < .05). That our sample was powered to detect a smaller correlation as significant for fixed mindset effort (−.22) and not a larger correlation (.29) suggests that the point estimate of .29 is more reflective of error (due in part to single-item indicators) than merely a power issue for detecting the effect as significant. The findings here for elementary students largely corroborate what has been found in research on theories of intelligence for adults, namely, that individuals with a fixed mindset have negative perceptions of effort and that individuals with a growth mindset believe intelligence may increase and may do so through higher effort (Blackwell et al., 2007).
This study also reported the first empirical estimation of how well individuals might be classified into groups, with five clusters of individuals extracted. Although the MAP suggests that 10 profiles may be used to classify students, these profiles have not been tested empirically and the relative orthogonality of profile membership from the current version of the assessment is unknown. Findings in this study not only provided strong statistical evidence for the usefulness of a five-profile solution (i.e., entropy = .93), and the salience of choosing five profiles over six profiles (i.e., VLMR p = .123; LMR p = .129) but also the average latent class probabilities for likely class membership were very strong for each of the five profiles (i.e., Profile 1 = .99, Profile 2 = .91, Profile 3 = .94, Profile 4 = .97, and Profile 5 = .97). The resulting profiles were differentiated on standardized word reading, vocabulary, and reading comprehension measures. Individuals who were predicted to be in Class 3 (approximately 33% of the sample), which was characterized by high growth mindset and above average effort, consistently outperformed their peers in all areas of literacy skills, compared to individuals in Classes 1 and 2 that both had higher fixed mindset and lower overall reading comprehension and vocabulary scores. Thus, a relation between the belief that academic skills can develop through effort and be improved over time and reading achievement in the upper elementary grades was noted, consistent with the incremental theory of intelligence (Yeager & Dweck, 2012). Alternatively, profiles with more fixed mindsets were related to lower reading achievement scores.
Together, the findings from the factor analysis and finite mixture model suggest that the MAP should be used differently in elementary school in both how scores are created and how individuals are classified into groups. Because the MAP is used as part of a broader tool set in terms of class-based curriculum on teaching growth mindset, as well as for interventions, it is critical that decisions made about students are driven by sound measurement. In this way, total scores from the MAP should be multidimensional and not unidimensional and the classification of students should reflect the compensatory aspects of fixed and growth mindset along with effort so that effective recommendations and strategies may be provided to teachers and clinicians who use the MAP to guide instruction and interventions. The psychometric and individual difference results set a foundation of better measurement. Improved measurement is critical and foundational to studies of individual differences and causality; thus, findings here may be useful to researchers looking at the role of growth mindset related to key educational outcomes.
This study is limited by factors such as the data being self-reported and importantly that the resulting three-factor structure was inclusive of two factors indicated by single items. Although such representations are statistically allowable and practical (Petrescu, 2013), the findings may speak to the need to expand the item pool on the MAP to more robustly test construct relevant or irrelevant variance. Further, that the correlated three-factor and bifactor solutions provided acceptable incremental fit suggest that the structure may be more complex than what was estimated here, and an increased item pool may bear out whether findings here can be replicated. Future research may wish to not only replicate the findings of this study but also to evaluate differential item functioning and prediction to a wider range of standardized outcomes. Further, it will be important to engage in rigorous testing of the measurement invariance in finite mixture models. Regardless of these limitations and suggestions for future directions, the current research provides new evidence of how the MAP may be used in practice to support individuals’ understanding of growth mindset as part of more robust social–emotional learning in elementary education.
Footnotes
Appendix A
Declaration of Conflicting Interests
The authors declared no potential conflicts of interest with respect to the research, authorship, and/or publication of this article.
Funding
The authors disclosed receipt of the following financial support for the research, authorship, and/or publication of this article: This work was supported by the Institute of Education Sciences (R324A130262). The opinions expressed are those of the authors and do not represent views of the funding agencies or the universities.