
Abstract
Numerous studies have been conducted using the Survey of Attitudes Toward Statistics-36 (SATS-36). Recently, large-scale assessment studies have begun to examine the extent to which students vary in their statistics attitudes across instructors. Yet, empirical evidence linking student responses to the SATS items to instructor-level constructs is still lacking. Using multilevel confirmatory factor analysis, we investigated the factor structure underlying the measure of students’ statistics attitudes at both the student and instructor levels. Results from 13,507 college students taught by 160 introductory statistics instructors support a correlated six-factor model at each level. Additionally, there is evidence for the structural validity of a shared teacher–student attitude impacts construct that may capture meaningful patterns of teaching characteristics and competencies tied to student development of statistics attitudes. These findings provide empirical support for the use of the SATS-36 in studying contextual variables in relation to statistics instructors. Implications for educational practice are discussed.
Keywords
Students’ academic attitudes, as an important learning outcome, have received considerable attention in the education research literature with strong interest in both students’ and their teachers’ perspectives (Blazar & Kraft, 2017; Eccles & Roeser, 1999; Muenks, Wigfield, & Eccles, 2018; Pianta & Hamre, 2009; Ramirez, Schau, & Emmioğlu, 2012; Schau, 2003). Education researchers typically study academic attitudes with student surveys. Mounting evidence suggests that factor structures underlying the same psychological constructs may be different at individual and group levels (Marsh et al., 2012; Schweig, 2014; Stapleton, Yang, & Hancock, 2016). Disparate factor structures may yield different results in answering questions concerning the nature and size of group (e.g., teacher) effects on student outcomes. Using multilevel confirmatory factor analysis (CFA), we examined the multilevel (i.e., students and teachers) factor structure of multidimensional students’ statistics attitudes as measured by the Survey of Attitudes Toward Statistics-36 (SATS-36; Schau, 2003). Specifically, the following two research questions guide the present study: Is there evidence of instructor-level constructs underlying student responses to the SATS-36 items? If so, what is the reliability of the scores from the SATS-36 at the student and instructor levels?
Research on Students’ Statistics Attitudes using the SATS
As many studies have recognized (Nolan, Beran, & Hecker, 2012; Xu & Schau, 2019), the SATS-36 and its predecessor, the SATS-28 (Schau, Stevens, Dauphinee, & Vecchio, 1995), are the most widely used survey instruments assessing students’ attitudes toward statistics. Broadly, three traditions of empirical research on students’ statistics attitudes using the SATS-36 have emerged in the literature. The first tradition has primarily focused on examining the psychometric properties of the SATS-36. Studies using single-level CFA, including those with focus on the ordinal nature of the item responses, have largely confirmed the six-factor structure of the SATS-36 across different populations of college students, although revision on some items has been suggested (Persson, Kraus, Hansson, & Wallentin, 2019; Xu & Schau, 2019). Additional studies have provided evidence on the property of measurement invariance across gender for the SATS-36 (Sarikaya, Ok, Aydin, & Schau, 2018).
The second research tradition has focused on assessing students’ statistics attitudes in response to course interventions. Some studies have found that statistics attitudes were generally recalcitrant to change over one semester (Schau & Emmioğlu, 2012), even when students were exposed to whole-class interventions (Lesser, Pearl, & Weber, 2016). Others have shown that improving students’ statistics attitudes is possible when using a variety of instructional approaches grounded in major educational and psychological theories (Carlson & Winquist, 2011; Lai, Livings, D’Amico, Hayat, & Williams, 2018).
The third has focused on examining the relationships between students’ statistics attitudes and other learning outcomes (Emmioğlu & Capa-Aydin, 2012; Lavidas, Barkatsas, Manesis, & Gialamas, 2020; Paul & Cunnington, 2017; Tempelaar, van der Loeff, & Gijselaers, 2007). Findings have demonstrated that students’ statistics attitudes predict their academic achievement.
Using the SATS-36, Xu, Peters, and Brown (2020) found that students’ statistics attitudes at the end of introductory statistics courses vary across instructors, after controlling for pre-course attitude scores, classroom peer effects, and a range of student-level covariates relevant to statistics attitudes. Additionally, several instructional dimensions assumed to arise from students’ interactions with statistics instructors were found to partially account for such effects. However, the researchers conducted multilevel regression analysis with a focus on variation in SATS-36 component scale scores to answer substantive questions and did not examine whether the factor structure of the SATS-36 was adequate at the instructor level.
Necessity of Examining Attitude Constructs at Teacher Level
Teacher as a level of analysis is of great interest for a range of instructional and accountability purposes, in that teachers “add value” to student outcomes. It is well established that group-level constructs need to be attended to in answering substantively important questions about effects of group contexts (Marsh et al., 2012; Schweig, 2014; Stapleton et al., 2016). Central to the conceptual issues in multilevel factor structure is whether the sources of a group-dependent structure can be addressed in observed scores (Kozlowski & Klein, 2000; Stapleton et al., 2016). Pertinent to research on students’ attitudes and behaviors, students taught by the same teachers share similar instructional experiences and, thus, are more likely to develop similar academic attitudes and behaviors than those taught by different teachers (Blazar & Kraft, 2017).
Empirical research has documented the large effects that teachers have on students’ academic attitudes, motivation, and social and behavioral skills (e.g., Blazar & Kraft, 2017; Kraft, 2019; Xu et al., 2020). Importantly, a few teacher-level instructional dimensions were found to contribute to the prediction of students’ attitude outcomes over and above what can be accounted for by student characteristics and classroom peer effects. Blazar and Kraft (2017) found sizable teacher effects on students’ attitudinal and behavioral outcomes between .14 and .31 SDs in upper elementary settings. Using data from a classroom roster randomization experiment, Kraft (2019) provided added information regarding the sizes of teacher effects on students’ social and emotional skills, ranging between .10 and .16 SDs. Xu et al. (2020) found instructor effects on college students’ attitudes toward statistics ranging between .09 and .36 SDs. Taken together, prior studies lend strong support to the existence of a degree of homogeneity in academic attitudes among students taught by the same teachers.
Due to the importance of students’ academic attitudes as a learning outcome, there is a fast-growing interest in assessing students’ attitudes as a means of evaluating teacher effectiveness (Blazar & Kraft, 2017). Evidence-based instructional innovation and policy-making render research on the multilevel factor structure of attitude data; a necessary step before more conclusive statements can be made regarding the nature and size of teacher effects on students’ attitudes.
Present Study and Rationale
We hypothesized that, besides individual-level constructs, there is a mix of instructor-level constructs underlying students’ responses to the SATS-36 items. In the conceptual model (see Figure 1), we differentiated the instructor-level constructs into six substantive constructs and one shared construct. Following the terminology used in Stapleton et al. (2016), the six instructor-level substantive constructs (with the factor loadings constrained to be equal across levels) are referred to as configural constructs hereafter. The configural constructs are measured using students’ responses to the SATS-36 items aggregated to the instructor level. Therefore, they simply represent the average levels of statistics attitudes of a given instructor’s students within each of the six substantive constructs. The shared construct is measured using the same student item responses that may measure instructors’ impacts on students’ statistics attitudes. Conceptually, the shared construct refers to similar attitudes toward statistics developed collectively among students taught by the same instructors due to the same characteristic(s) to which each student has been exposed (e.g., instructor attitudes, content delivery approach, and emotional support). In the rest of this section, we provide both the theoretical basis and empirical considerations for testing the hypothesized model. Hypothesized multilevel Model 4 of the present study. Residual variance for each parcel is not shown in the interest of visual ease. The factor loading of each parcel, denoted by a subscripted λ, is constrained to be equal across the student and instructor levels. The six substantive constructs at the instructor level are what Stapleton et al. (2016) called configural constructs, on the condition that equal loading constraints are imposed.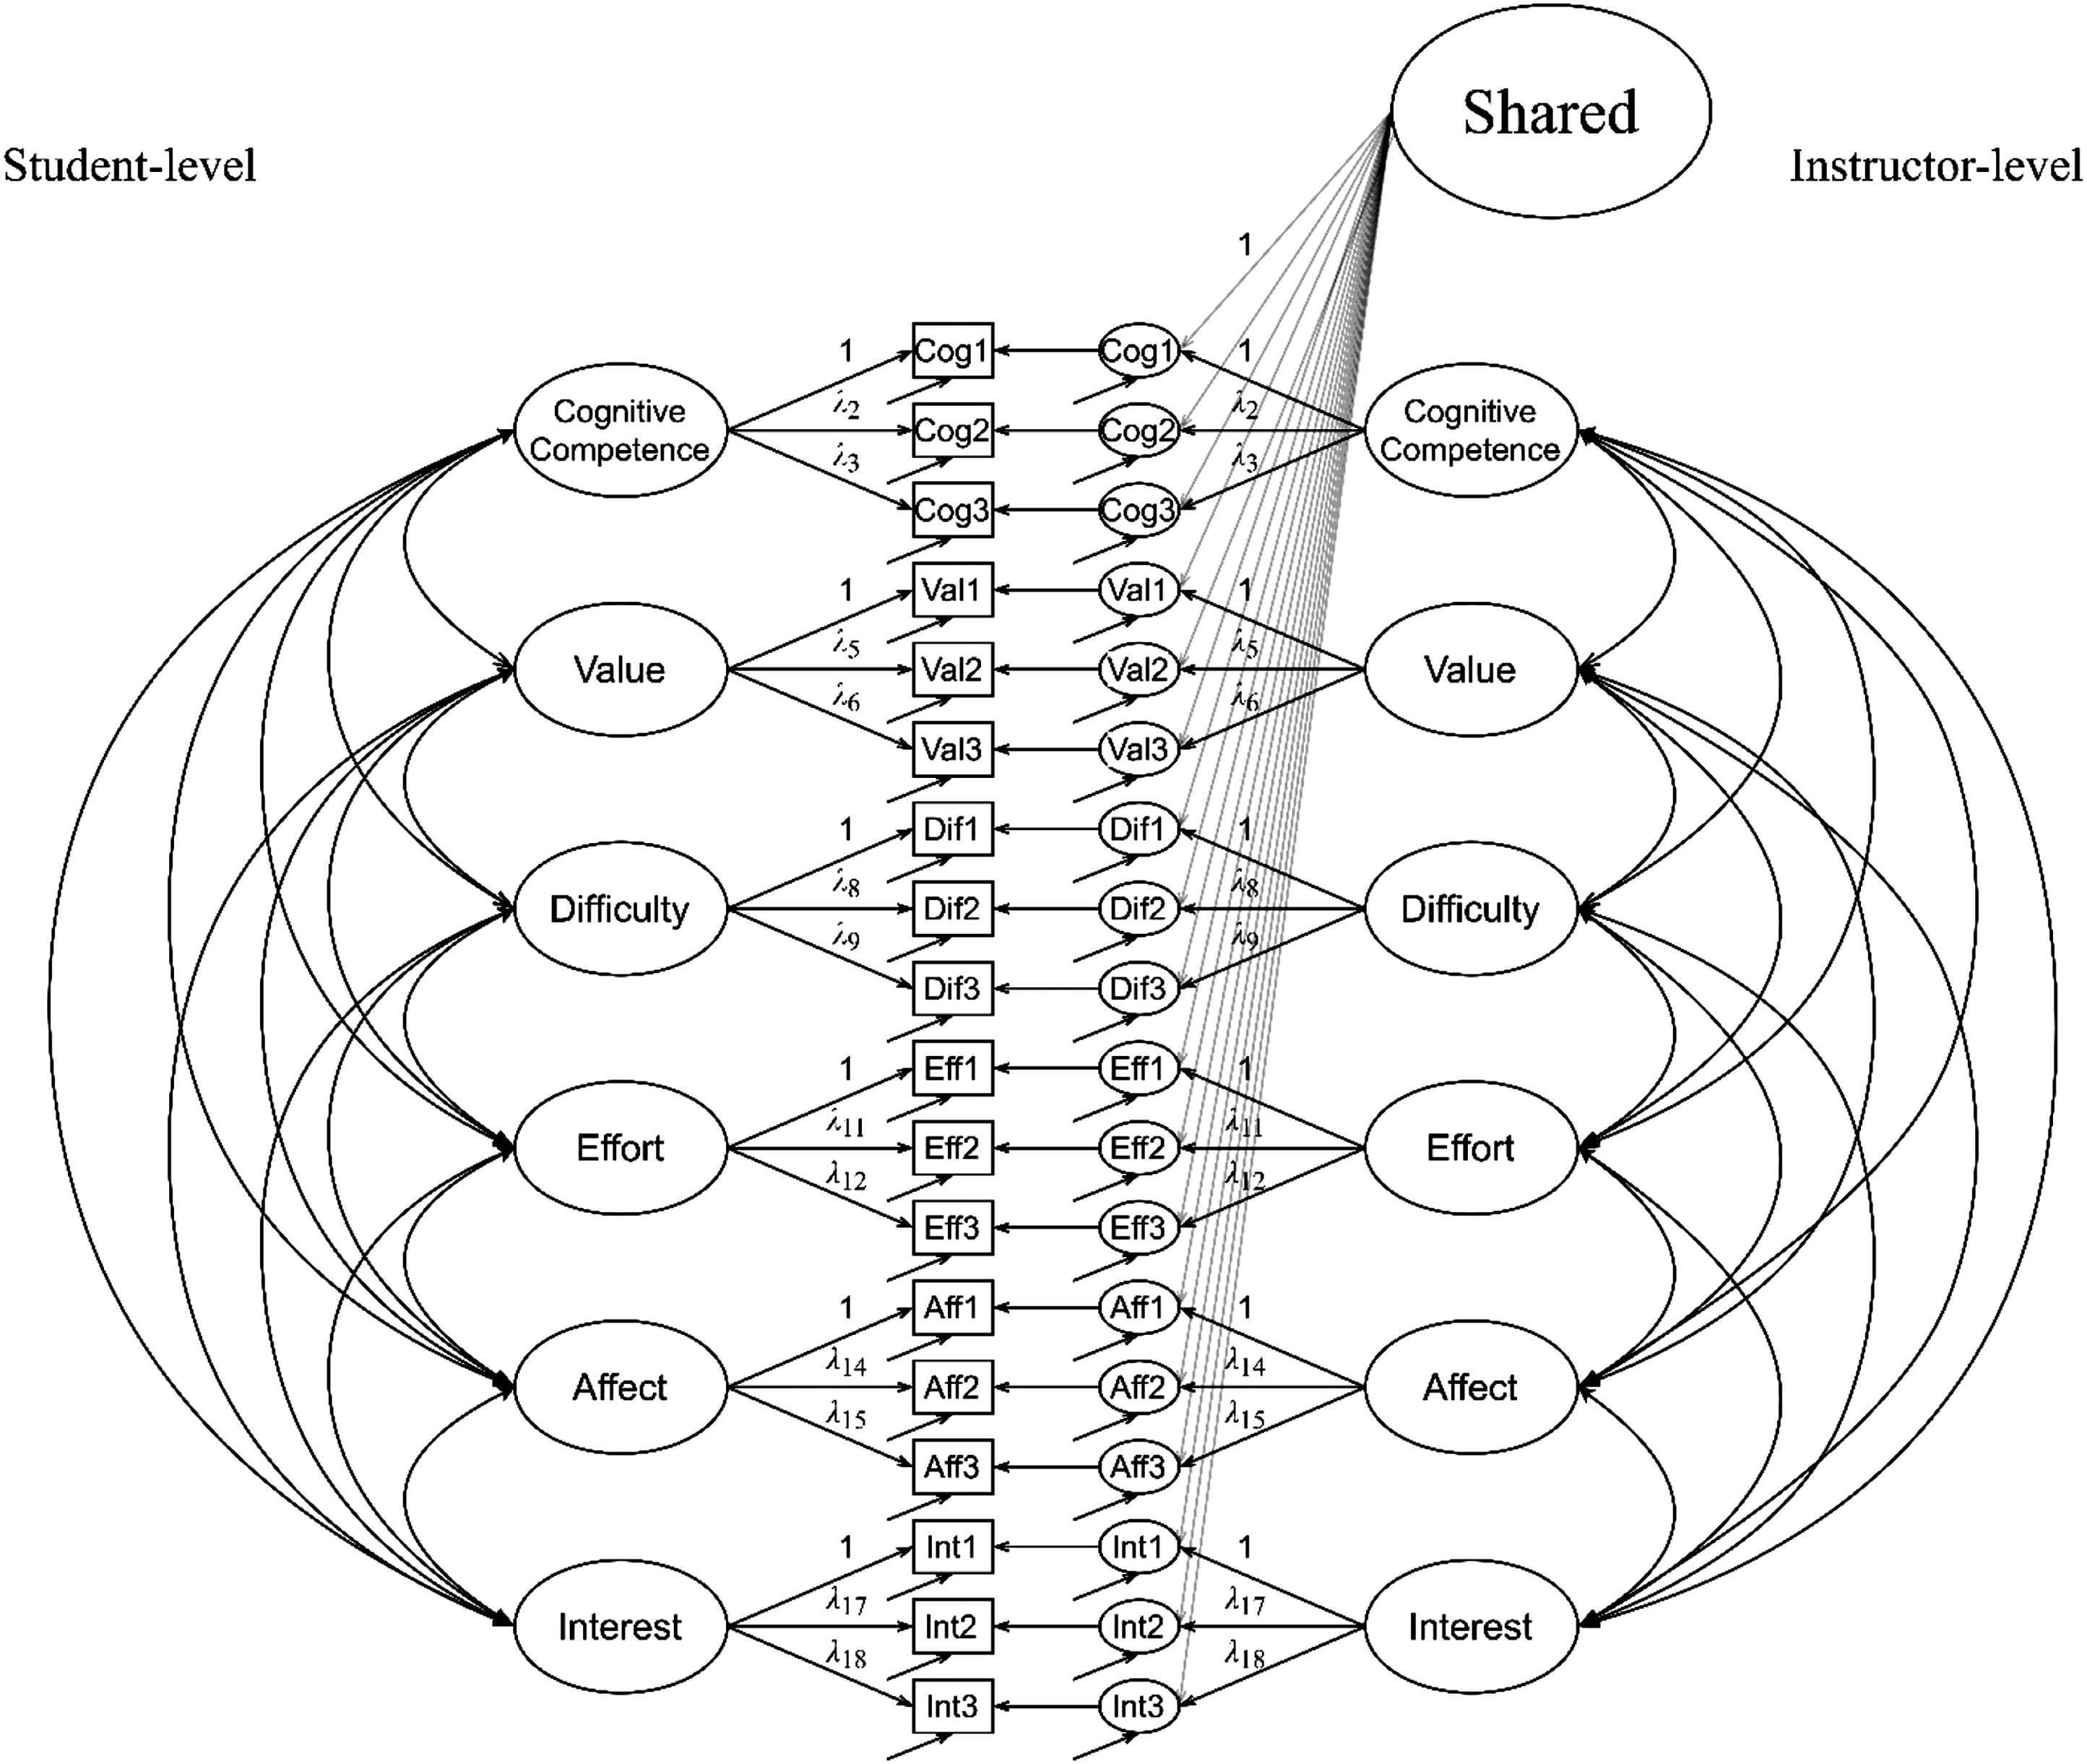
Unlike student surveys with items that refer to both students and teachers, the SATS-36 does not link teaching characteristics and competencies with students’ statistics attitudes explicitly; namely, none of the SATS-36 items are purposefully worded to elicit students’ responses reflecting teacher characteristics and teaching quality in relation to statistics attitudes. Yet, this characteristic does not limit the usefulness of the SATS-36 in studying whether statistics instructors intersect with their students’ attitudes, as the SATS-36 has considerable theoretical strength grounded in Eccles and colleagues’ expectancy-value theory (Ramirez et al., 2012). A thorough explanation of expectancy-value theory as well as of its inextricable link to the overall development of students’ academic attitudes (comprising expectancy value and competence beliefs) is beyond the scope of this study. Interested readers can refer to the significant literature for a comprehensive treatment of these two topics (Eccles & Roeser, 1999; Eccles & Wigfield, 2002; Muenks et al., 2018; Wigfield & Cambria, 2010).
However, in its simplest form, a central tenet of expectancy-value theory posits that schooling is characterized by social and instructional processes (Eccles & Roeser, 1999), thus tying many dimensions of teaching behaviors to students’ development across behavioral, cognitive, and social-emotional domains. Particularly, expectancy-value theory incorporates contextual factors (such as teachers) and recognizes the importance of teachers in shaping students’ achievement motivation (Muenks et al., 2018). For example, students who perceive that their teachers are supportive in particular domains are on average more likely to develop positive academic attitudes than other students who do not hold this perspective. Hence, expectancy-value theory helps in explaining the potential dependency of item responses of students linked with the same teachers. Directly relevant for the present study, when students taught by the same instructors are asked to rate their attitudes toward statistics at the end of the term, each of them has been exposed to the same teacher and teaching characteristics for nearly one full semester. Those characteristics are expected to elicit similar item responses, in addition to the unique student-level responses, to the statistics attitude measure.
Besides theoretical arguments, empirical evidence also supports the idea that students’ statistics attitudes are influenced by instructors. Xu et al. (2020) found that average post-attitude scores vary significantly across 23 instructors, conditional on several student-level variables. Importantly, between-instructor variability is substantially greater in average attitude scores at the end of the courses than at the beginning, implying that the SATS-36 may be used to capture variation and covariation among item responses that would reflect instructor-level constructs. In addition, Schau (2003) identified instructor and instructional characteristics as one determinant of students’ statistics attitudes using a mixed methods approach. Taken together, both theories and empirical data support the idea that responses to the SATS-36 items reflect teachers’ ability to impact students’ statistics attitudes, thereby providing the rationale for testing the main hypothesis that there is a mix of configural and shared constructs underlying the item responses in the attitude data.
Method
Data Sources and Procedure
The original data contained 15,979 students who took the course and 287 instructors who taught introductory statistics courses across 135 institutions in the United States. In all, the institutional types included high schools, community colleges, baccalaureate colleges, master’s colleges and universities, and doctoral/research universities. As part of a National Science Foundation-funded project seeking to understand the impact of innovation in statistics curriculum on a range of learning outcomes, the data were collected across 2014–2015, 2015–2016, and 2016–2017 academic years as well as across different statistics curricula (i.e., traditional vs. innovative computer simulation based). All data were compiled together for this study, such that there would be a sufficiently large sample of instructors for the multilevel CFA.
Statistics instructors were asked to administer a combined instrument, including the SATS-36, during the final week of class. Students took the assessment outside of class after their instructors sent them an email link of SurveyMonkey, a survey software program. The assessment took approximately 35 minutes. The implementation of this combined instrument varied across instructors to some extent, including whether they offered student incentives for participation. In all, 259 instructors (90.2%) reported giving small student incentives, mostly in the form of extra credit or quiz or homework credit for completion, while 28 instructors did not give/report. It was stressed that no penalty would be imposed if students decided not to complete the instrument.
Sample
Data from high school students were omitted as the first step of data processing, leaving the sample composed only of college students and instructors. Frequently, 10% or less missing data have been suggested as an empirical cutoff indicating that the missing data are likely to be missing completely at random (MCAR; Bennett, 2001; Dong & Peng, 2013). Given this consideration, our analytic sample was constructed to only include students who had no more than 10% missing responses (i.e., four items). In addition, following Chance, Wong, and Tintle (2016), instructors with student response rates above 40% were retained. These restrictions yielded a sample of 13,507 college students nested within 160 introductory statistics instructors. The racial/ethnic information for the students was not summarized due to an excessive amount of missing values on this item. The student sample consisted of 8170 female students (60.5%), 5006 male students (37.2%), and 331 students (2.3%) with missing information on gender. The age of the students ranged from 18 to 48 years with an average of 19.96 years (SD = 3.12). Of the 160 instructors, 88 were women and 72 were men. The number of students nested within individual instructors ranged from 24 to 654, with a median size of 57 students for each statistics instructor.
Instrument
Students’ statistics attitudes were measured by the post-course version of the SATS-36, comprising 36 seven-point Likert scale items (1 = strongly disagree, 4 = neutral/no opinion, and 7 = strongly agree). The six SATS-36 subscales as well as sample items are as follows: (1) Affect (6-items; e.g., “I enjoyed taking statistics courses.”), (2) Cognitive Competence (6-items; e.g., “I had trouble understanding statistics because of how I think.”), (3) Value (9-items; e.g., “Statistical skills will make me more employable.”), (4) Difficulty (7-items; e.g., “Statistics involves massive computations.”), (5) Interest (4-items; e.g., “I am interested in learning statistics.”), and (6) Effort (4-items; e.g., “I studied hard for every statistics test.”). The responses to negatively worded items were reversed before scoring. The students who gave higher numerical responses to any item had more positive attitudes than those who gave lower responses. Those who had higher scores on Difficulty perceived statistics to be less difficult. Cronbach’s coefficient alpha values for Affect, Interest, Value, Effort, Difficulty, and Cognitive Competence in the post-version of the SATS-36 are .85, .92, .91, .72, .76, and .86, respectively. The SATS-36 can be acquired through https://www.evaluationandstatistics.com/.
Analyses
Missing data
The analytical sample (n = 13,507) consists of 11,787 students with complete data (87.3%), 1435 students with one missing value (10.6%), 214 students with two missing values (1.6%), and 71 students with three or four missing values (.5%). The percentage of missing data by item ranged from .1% to 2.3%. Little’s MCAR test done at the item level revealed that the missing data were not MCAR (χ2 = 10,170.64, df = 7819, p < .001). Because it was impossible to obtain follow-up data on survey nonresponses, we were not able to test whether missing at random (MAR), a less stringent assumption about the pattern of missingness, holds in our dataset. To handle missing data, this study used hot deck imputation, one of the most recognized methods for imputing survey nonresponses (Andridge & Little, 2010). Hot deck imputation is not a model-based method and, thus, may be not as sensitive to a possible MAR violation as imputation methods based on parametric models. The core imputation algorithm, including the choice of distance metric to match donor data to recipient data, is detailed in Kowarik and Templ (2016), and its implementation was via the visualizing and imputation of missing values package in R programming language. The values of sample means and SDs for the 36 items in the imputed data were nearly identical to those in the data with missing values. Thus, we used the imputed data for item parceling and multilevel CFA. The final dataset is available upon request.
Item parceling
To adequately estimate a full model at the item level would require a very large number of instructors, which exceeded the capacity of this study, even though we combined several sets of data from different introductory statistics curricula across three academic years. We addressed this problem using item parceling. Item parceling techniques have been used with multilevel CFA when the number of units is moderately relative to the number of model parameters at the between-group level (e.g., Martin, Malmberg, & Liem, 2010). This is true for the present research.
In line with the recommendation that each factor should have a minimum of three indicators (Marsh, Hau, Balla, & Grayson, 1998), item parcels in this study were constructed such that the parceling solution contains three parcels for each of the six attitude subscales. Other considerations for the parceling of the SATS data included counterbalancing skewness and kurtosis, SDs, and distribution of positively and negatively worded items. Except for parcels containing a single item, a parcel score is the mean of the component items in that parcel. More information on the parceling scheme adopted in this study is available in Tempelaar et al. (2007). A table detailing item assignment within each of the six subscales is included in the online supplementary materials.
Model specification, estimation, and evaluation
We examined the fit of four multilevel measurement models with a priori specified structures to the attitude data. The first model comprises six factors at each level with factor loadings unconstrained across levels (Model 1). Next, we tested the second model with six factors at the student level and one factor at the instructor level (Model 2). Because Model 2 represents the most parsimonious factor solution at the instructor level, it is generally recommended that the fit of this model be evaluated (e.g., Dedrick & Greenbaum, 2011; Huang & Cornell, 2016; Little, 2013). The third model is the same as Model 1, except that factor loadings are constrained to be equal across levels (i.e., cross-level invariance; Model 3). When this constraint is considered, the latent variables can simply be conceived of as being decomposed into level-specific components (Jak & Jorgensen, 2017; Zyphur, Kaplan, & Christian, 2008), meaning that the six constructs at the instructor level (i.e., configural constructs) are just a reflection of the student-level constructs. This simplification is not possible without assuming cross-level invariance. Next, Model 3 is expanded to include a shared construct at the instructor level (Model 4). Statistically, the shared construct is assumed to model sources of variation and covariation at the instructor level in addition to that which has been accounted for by the configural constructs. Model 4 corresponds to the conceptual model, as illustrated in Figure 1, and is referred to as the simultaneous shared and configural cluster construct model in Stapleton et al. (2016). We also examined the correlations among factors for Model 4 (the conceptual model). Based on these correlations, we examined one additional model (Model 5) that was more parsimonious at the instructor level.
For each model, the first loading for each factor is fixed to one. In addition, error covariances are fixed to zero among parcels. Last, the shared factor is set to be uncorrelated with the six configural factors, a condition required for model identifiability. These multilevel models are estimated using the robust maximum likelihood (MLR) approach. The algorithm is implemented via the lavaan package in R (Rosseel, 2012).
Model-fitting indices include the chi-square statistic, comparative fit index (CFI), root-mean-square error of approximation (RMSEA), and level-specific standardized root-mean-square residual (SRMR). Both within- and between-level SRMR values are available in the lavaan package. In large sample size applications, interpretation of factor analysis based on a significant chi-square statistic often leads researchers to reject a model even when this model has only a small degree of lack of fit to the data (Hu & Bentler, 1999). Under these circumstances, alternative fit indices are used to evaluate fit of the model and, mirroring the tradition, the chi-square statistics are still reported. Using the recommended criteria in Hu and Bentler (1999), a measurement model provides a good fit to the data when CFI is about .95 or larger, RMSEA is close to .06 or smaller, and SRMR is close to .08 or smaller. These cutoffs are specific to single-level CFA; there is a relative absence of recommendations for cutoffs specific to multilevel CFA (Kim, Dedrick, Cao, & Ferron, 2016).
Another potential issue associated with model evaluation and comparison is the fact that models with different levels of complexity may yield very similar fit indices. Under these circumstances, we decide upon the favored model by following the general recommendations that the factor solutions be inspected with consideration of theory, the uniqueness of the factors, the interpretability of the results, and the intended use of the measure (Stapleton et al., 2016; Zyphur et al., 2008).
Composite reliability
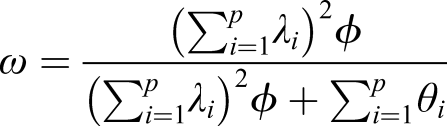
Aside from Cronbach’s alpha, we assessed reliability of the factor scores using both within- and between-group measures of composite reliability as suggested by Stapleton et al. (2016). The composite reliability can be estimated as
Results
Summary Statistics
Descriptive Statistics for Item Parcels.
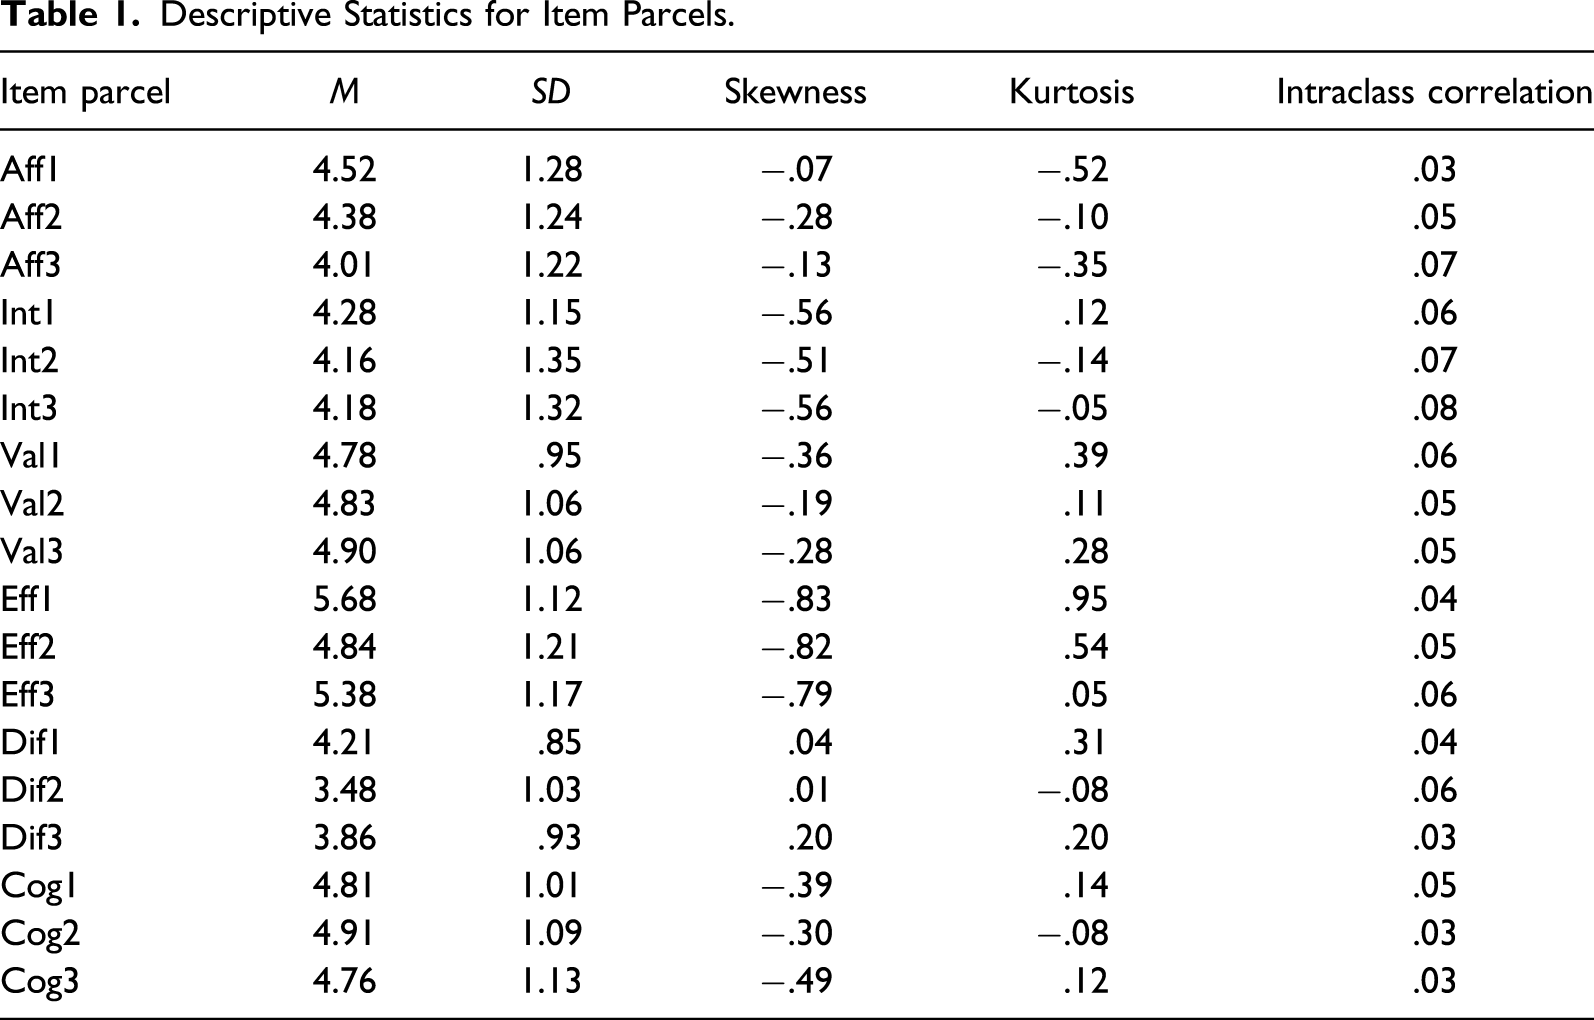
Of importance to the multilevel CFA is the variability between and within instructors in each item parcel; the intraclass correlation (ICC) provides a measure of the dependency of attitude scores among students with given instructors. The ICC for an item is defined as the ratio of the variation between clusters to the total variation comprising the within- and between-group variation. ICC values equal to .05 or larger indicate enough sample variation to effectively conduct multilevel analysis (Geldhof, Preacher, & Zyphur, 2014). In the present research, the ICCs for each of the item parcels range from .03 to .08 with a median value of .05 (see Table 1). These values suggest that there is a sufficient amount of sample variation to be productively modeled as a function of the latent variables hypothesized at the instructor level.
Level-Specific Factor Structure
Fit Indices for Five Models.

CFI = comparative fit index; RMSEA = root-mean-square error of approximation; SRMR = standardized root-mean-square residual.
Next, Model 2 was estimated with six student-level factors and one overall instructor-level factor. The between-level SRMR is substantial at .223, suggesting a poor fit of this model to the attitude data at the instructor level.
Further, we tested the assumption of cross-level invariance. Model 3 was estimated with cross-level factor loadings constrained to be equal. Model-fitting indices show that Model 3 fits the data almost as well as Model 1 does at the student level, although with a larger between-level SRMR (see Table 2). Thus, Model 3 with constrained factor loadings yields a slightly poorer fit at the instructor level relative to Model 1 with freely estimated loadings.
In Model 4, we then tested for the presence of a shared teacher–student attitude impacts construct, which is assumed to account for a portion of the instructor-level variability and results in the cross-level noninvariance we found in Model 3. Model 4—the simultaneous shared and configural cluster construct model—provides a good fit to the attitude data at both the student and instructor levels (see Table 2). Model-fitting indices are similar to the previous three models except the between-level SRMR which now falls slightly below .08.
Multilevel Correlations Between Latent Factors for Model 4.
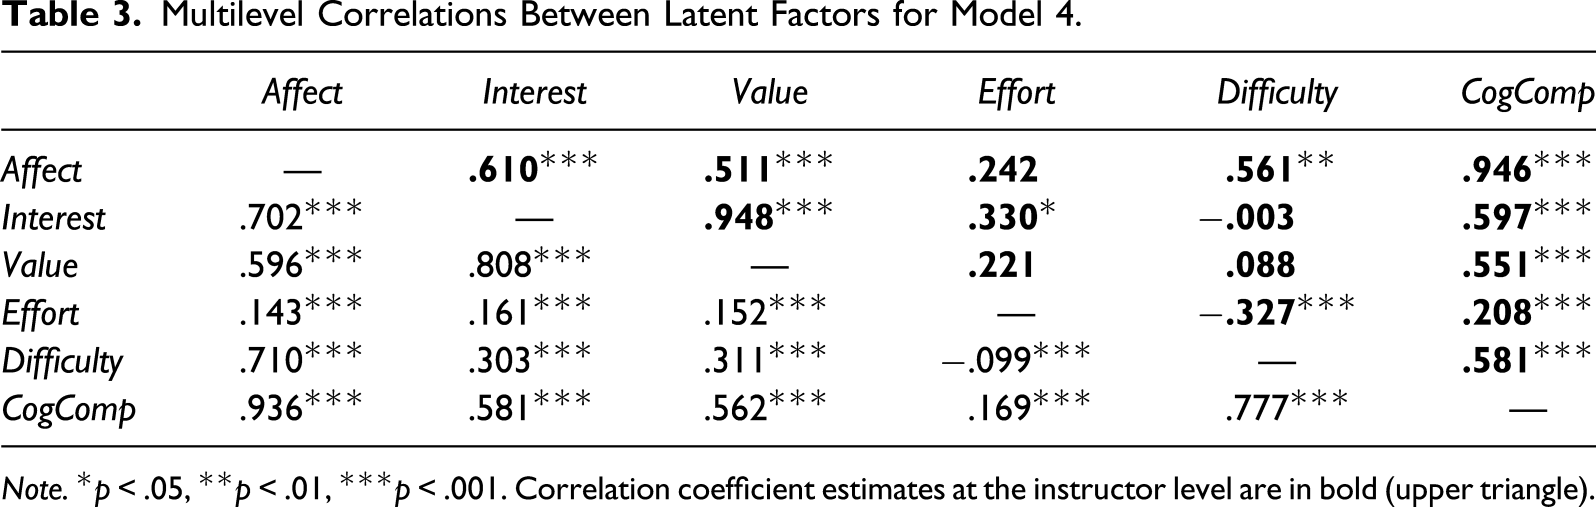
Note. *p < .05, **p < .01, ***p < .001. Correlation coefficient estimates at the instructor level are in bold (upper triangle).
Unstandardized Factor Loadings and Residual Variances for Model 4.
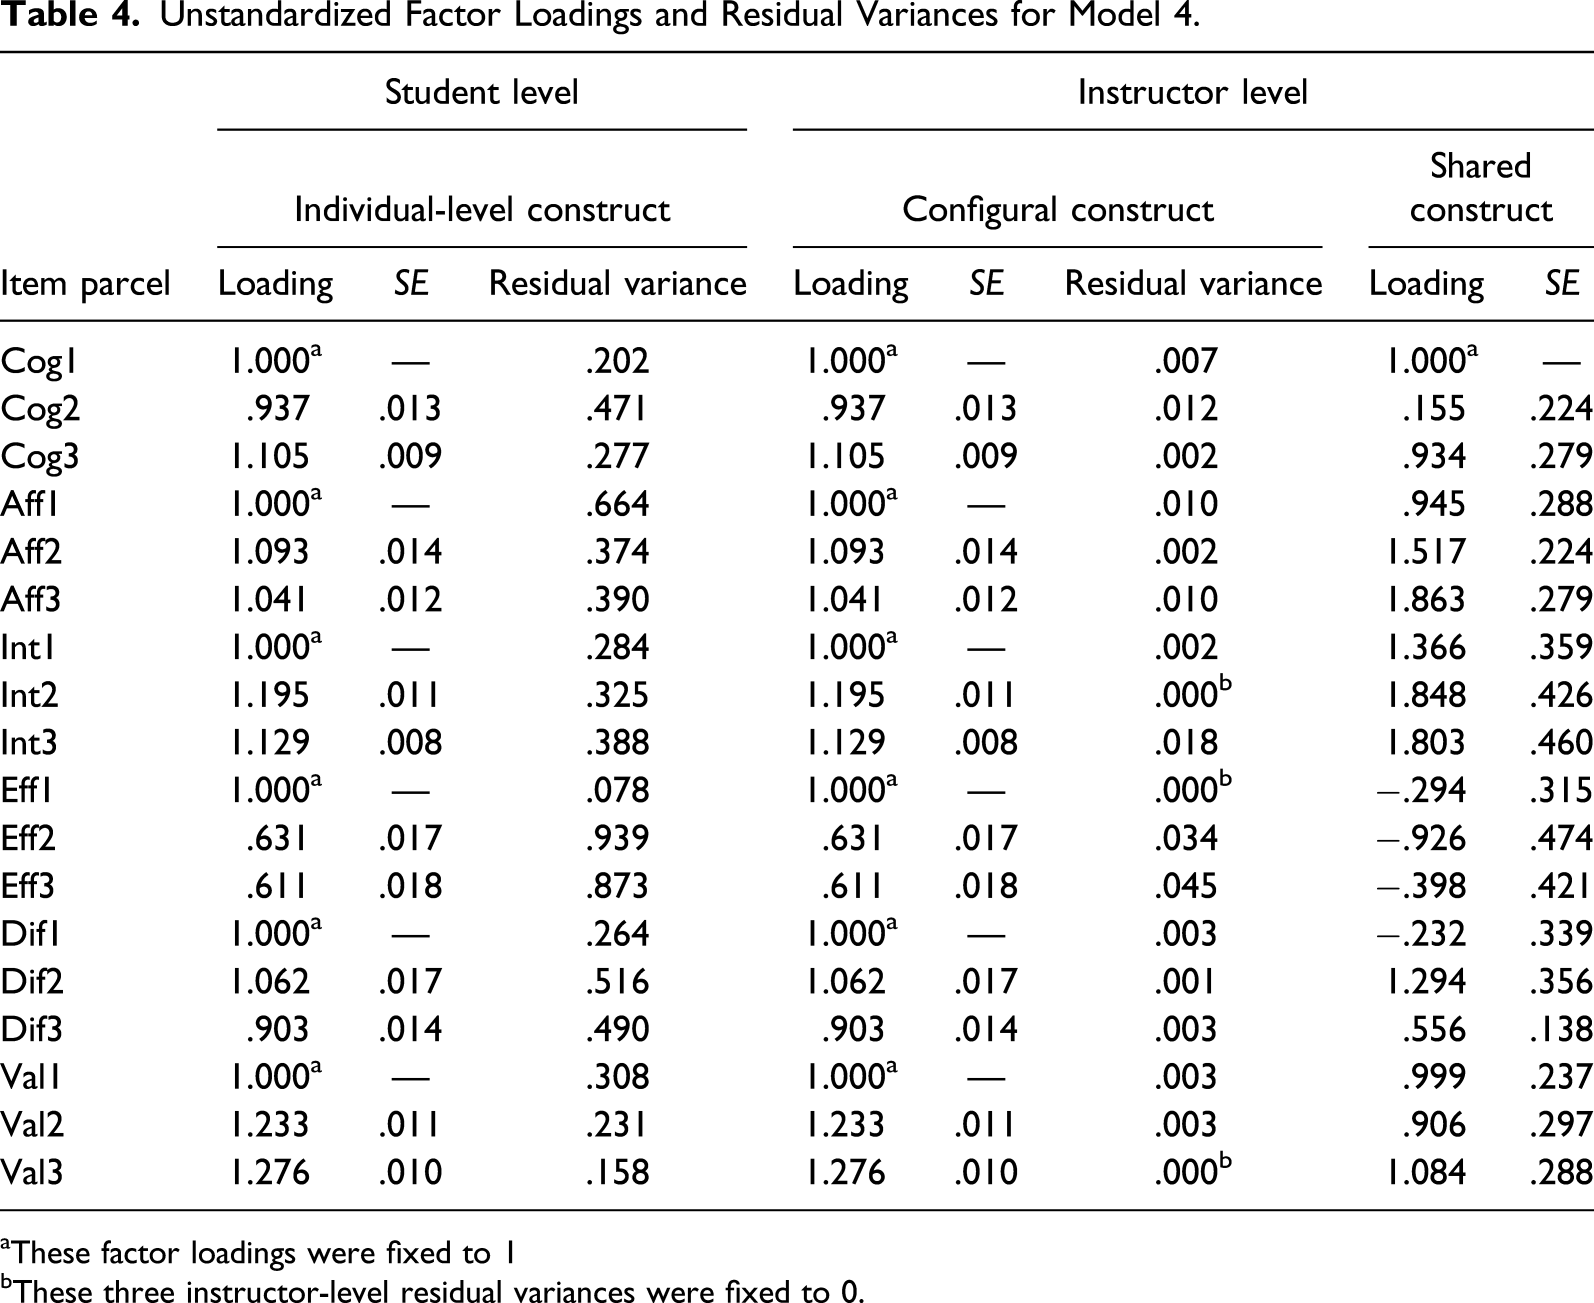
aThese factor loadings were fixed to 1
bThese three instructor-level residual variances were fixed to 0.
Level-Specific Composite Reliability
By partitioning the variance in the attitude scores into student- and instructor-level components, reliability estimates for each of the six factors can be obtained at each level. Geldhof et al. (2014) suggested that composite reliability has an advantage over Cronbach’s alpha, as the former is a function of actual factor loadings, while the latter puts equal weight on all items that load on a latent construct. Here, we computed level-specific composite reliabilities based on parameters from estimating Model 4.
Level-specific Factor Variances and Composite Reliabilities for Model 4.

Discussion
Drawing on a rich set of assessment data, the primary purpose of the present research was to investigate the multilevel factor structure of multidimensional students’ statistics attitudes as assessed by the SATS-36 simultaneously across students and instructors. Upon examination using multilevel CFA approaches, the conceptual framework presented in Figure 1 comprises a good fit to the attitude data, adequate multilevel factor structure, a validated shared factor, and broadly strong factor loadings associated with individual and configural factors. Other findings include largely parallel factor correlations across student and teacher levels. The patterns of correlations are consistent with those from previous student-level CFA results conducted at the item level (Persson et al., 2019; Xu & Schau, 2019). Taken together, these can be considered clear evidence of the concurrent nature of students’ statistics attitudes at both the student and instructor levels.
Affect and Cognitive Competence, as well as Interest and Value, exhibit high correlations (i.e., >.90) at the instructor level. The student-level correlation between Interest and Value falls close to .80, indicating acceptable discriminant validity of these two constructs at that level. Some researchers have called for combining the SATS subscales into a smaller set of subscales (Cashin & Elmore, 2005; VanHoof, Kuppens, Sotos, Verschaffel, & Onghena, 2011). For the present analysis, we continued to assume that the SATS-36 has a six-factor structure as originally conceived. Chiesi and Primi (2009) recognized the importance of separating Affect from Cognitive Competence due to both empirical and theoretical interests in the nature of the distinctiveness between these two constructs. Theoretically, the Cognitive Competence subscale belongs to self-efficacy measures, while Affect belongs to affective measures; hence, they have distinct theoretical underpinnings. Empirically, newer studies utilizing path analysis have provided added evidence related to the predictive validity and differential relationships of these statistics attitude constructs. Paul and Cunnington (2017) showed that Value and Interest influence students’ course achievement through distinct paths; in addition, Value is more predictive of final course achievement than Interest. Taken together, these findings support the distinctiveness of Value from Interest and that of Affect from Cognitive Competence.
Findings from examining the multilevel psychometric properties of the SATS-36 suggest that researchers can use this measure of students’ statistics attitudes in the following ways, given the substantive and/or applied purposes of their research. Some researchers may continue to use the SATS-36 across students with a clear view to investigate the effectiveness of educational interventions at improving students’ statistics attitudes. Others may administer the SATS-36 across instructors and then aggregate the attitude outcome measures to the instructor level for any subsequent regression analyses. These researchers can have confidence in doing so because our findings suggest that averaging students’ responses to the SATS-36 items into the six factors yields reliable and valid configural constructs (i.e., cross-level invariance holds in Model 4). Still others may pool data across instructors to conduct either hierarchical linear modeling with scale composite scores or multilevel structural equation modeling. One of the overarching goals of large-scale education science is to identify important variables that (causally) account for the portion of between-instructor variability, as reflected in the shared teacher–student attitude impacts construct, over and above what can be attributed to the differences in average attitude scores between instructors.
A shared construct arises from similar individuals’ responses to survey items when each individual has been exposed to one or more characteristics of the cluster (Marsh et al., 2012; Stapleton et al., 2016). In the context of the present research, the sources of the instructor-level variability constituting the shared teacher–student attitude impacts construct can be eclectic. For example, some teachers are expected to be more skilled than the others at organizing classrooms and providing supportive environments that effectively contribute to students’ development in social and emotional skills (Blazar & Kraft, 2017; Pianta & Hamre, 2009). Some have better attitudes about teaching introductory statistics to students. It is also possible that some college instructors tend to “buy” positive student outcomes through a policy of easy grading (Tippin, Lafreniere, & Page, 2012). This possibility is implied by prior findings that instructor-associated changes in students’ statistics attitudes and changes in their expected grades are positively correlated (Xu et al., 2020). As a result, the attitude data would then contain at least three sources of instructor-level variation that constitute the shared teacher–student attitude impacts construct—variation due to instructors’ attitudes, instructors’ inclination for easy grading, and characteristics of truly motivating instructors. Future studies may expand on the present study to distinguish sources of instructor-level variation in the attitude data.
Last, ICCs for the 18-item parcels range between .03 and .08 in this study. This magnitude warrants the use of multilevel CFA (Geldhof et al., 2014) but is still relatively small. Nonetheless, given the concurrent nature of statistics attitudes at student and instructor levels, the findings on ICCs have implications for instructional practice and intervention aimed at improving students’ statistics attitudes. In statistics education, intervention work has been directed at each of the two levels. Instructor-level interventions such as teacher training are implemented with the aim of helping statistics instructors develop the abilities to create classroom environments in which students have the opportunity to not only build conceptual understanding but also develop positive statistics attitudes (Chance et al., 2016). On the other hand, student-level interventions such as active learning approaches often have been implemented with a clear view to improving students’ statistics attitudes in class (Carlson & Winquist, 2011; Lai et al., 2018; Lesser et al., 2016). Due to the large amount of variation that amasses at the student level, we propose that, pertinent to college introductory statistics courses, allocation of education resources is more effective when intervention work is directed at the student level. Such whole-class intervention should aim to sustain strong students’ statistics attitudes, while improving weaker students’ attitudes.
Limitations and Future Directions
Several limitations in this study need to be addressed before recommendations for future areas of research can be made. First, we used the item parceling technique. While numerous studies have defended this methodology from either a theoretical or empirical perspective (Lau, Chiesi, Hofmann, Ruch, & Saklofske, 2020; Little, Rhemtulla, Gibson, & Schoemann, 2013; Martin et al., 2010), using parcels may obscure sources of sample variance (Little et al., 2013). Future studies may explore the possibility of item-level analysis of multilevel statistics attitude data using categorical data analytical approaches.
Second, although meaningful instructor-level variance was observed in this study, the SATS-36 items are all in reference to students. Additional student surveys in reference to both students and instructors may be developed along with the SATS-36 to substantiate the usefulness of instructor-level constructs that are validated in the present research. Candidate items include, for example, “My instructor makes statistics interesting.” Such an item would likely elicit responses toward both students’ intrinsic interest in statistics and the extent to which a teacher is able to foster students’ interest in the subject.
Third, the attitude data used in this study are cross-sectional. Future research should try to document longitudinal trends in students’ statistics attitudes. Analysis of longitudinal data will give insight into whether the multilevel factor structure of the statistics attitudes measure is idiosyncratic to the present study or to the specific time points at which the SATS-36 is administered.
Fourth, we used the hot deck method to impute the missing values. Although this imputation method has been frequently used in large-scale survey data applications (Andridge & Little, 2010) and its implementation has been optimized for large datasets (Kowarik & Templ, 2016), evidence linking the performance of the hot deck method (i.e., bias and undercoverage) to hierarchically structured data remains limited. This limitation stresses the importance of future research to fully explore more sophisticated frameworks for data imputation in multilevel settings. Such frameworks include multilevel multiple imputations (Grund, Lüdtke, & Robitzsch, 2018).
Last, although we relied on both theoretical and empirical evidence to validate latent constructs of interest at the instructor level, given the observational nature of the data, our findings on a shared construct should be interpreted as suggestive rather than conclusive. Future research needs to be undertaken by further examining the nature of this shared construct underlying student responses to the SATS items. One possible direction is to investigate whether student subpopulation memberships would impact the multilevel factor structure of the statistics attitudes measure. This research endeavor is important because, with additional information on the functioning of the variables defining student subpopulations, a multilevel structural equation modeling approach could be employed to explore the nature of the shared teacher–student attitude impacts construct. Indicators of student subpopulation in relation to students’ statistics attitudes that may be of practical interest include teacher behaviors (e.g., inclination to offer survey incentives) as well as student characteristics such as fields of study (e.g., natural and applied sciences vs. social sciences), age groups (i.e., traditional vs. nontraditional), and first-year college status. The suggestion for this future direction builds directly on the vision and purpose of testing for measurement equivalence in large-scale cross-cultural/national studies as described by many other researchers (e.g., Byrne & van de Vijver, 2010; Davidov et al., 2018).
Conclusion
Multilevel CFA approaches were used in this study to specifically examine the situation where SATS-36 factor structures may differ at the student and instructor levels. Findings demonstrate the existence of configural constructs at the instructor level that mirror individual-level constructs. As importantly, results also provide evidence for the structural validity of a shared teacher–student attitude impacts construct possibly reflecting meaningful patterns of teaching characteristics and competencies tied to student development of statistics attitudes. Thus, the findings of the present study provide empirical support for the use of the SATS-36 in furthering our understanding of teachers’ effectiveness at improving students’ attitudes toward statistics.
Supplemental Material
Supplement_Table – Supplemental Material for Measuring Statistics Attitudes at the Student and Instructor Levels: A Multilevel Construct Validity Study of the Survey of Attitudes Toward Statistics
Supplemental Material, Supplement_Table for Measuring Statistics Attitudes at the Student and Instructor Levels: A Multilevel Construct Validity Study of the Survey of Attitudes Toward Statistics by Chao Xu and Candace Schau in Journal of Psychoeducational Assessment
Footnotes
Acknowledgments
We are grateful to Beth Chance for providing the data. We thank two anonymous reviewers whose incisive comments helped make a significant improvement to this paper.
Declaration of Conflicting Interests
The author(s) declared no potential conflicts of interest with respect to the research, authorship, and/or publication of this article.
Funding
The author(s) received no financial support for the research, authorship, and/or publication of this article.
Supplemental Material
Supplemental material for this article is available online.
References
Supplementary Material
Please find the following supplemental material available below.
For Open Access articles published under a Creative Commons License, all supplemental material carries the same license as the article it is associated with.
For non-Open Access articles published, all supplemental material carries a non-exclusive license, and permission requests for re-use of supplemental material or any part of supplemental material shall be sent directly to the copyright owner as specified in the copyright notice associated with the article.