



Abstract
Though several studies have been undertaken to explore the correlates of academic achievement, there is a dearth of studies relating to the cognitive profiles of children who show marked discrepancies between their cognitive potential and actual academic achievement. The present study was undertaken in this context. The study was conducted on a sample of 308 students in the age range of 12–16 years, drawn from different schools in Kerala, India. The participants belonged to four groups, that is, Underachievers, Normal achievers, Overachievers, and those with Specific Learning Disorders (SLD). WISC-IV India and Rey Auditory Verbal Learning Test (RAVLT) were used for assessing cognitive functions. Results indicated that the SLD group could be discriminated from the other three groups in terms of Digit span, Letter-Number sequencing, Working Memory Index, and Processing Speed Index. Further, a retention score obtained from RAVLT could discriminate between the SLD and UA groups. Discriminant analysis of the variables resulted in the extraction of two significant functions composed of three variables of WISC and two variables of RAVLT. The results indicated that the different groups of scholastically backward children, though similar in their overall IQ, had distinct and characteristic cognitive profiles.
Keywords
Academic achievement, as an outcome variable, is known to be affected by a multitude of variables belonging to cognitive, affective, and social domains. The most important variable subjected to research in this context is one’s intellectual capacity. Studies have shown that there is a moderate to strong relationship between intelligence and school performance (Quilez-Robres et al., 2021) and that intelligence is the best predictor of academic achievement (Flores-Mendoza et al., 2021). Several meta-analytic studies have also revealed strong positive correlations between intelligence and academic achievement (Kriegbaum et al., 2018; Zaboski et al., 2018). A conservative estimate is that about 25% of the variance in academic achievement could be attributed to variance in intelligence (Peng et al., 2019; Roth et al., 2015).
Though the significant relationship found between mental ability and academic achievement remains valid in the general population, it has never been very strong, and instances of large mismatch between cognitive potential and actual performance are prevalent in the population. A major issue related to this discrepancy is scholastic backwardness (consistently poor performance in academics) which presents serious challenges to educationists, psychologists, and policymakers. There is growing recognition that scholastic backwardness may involve multiple causal factors belonging to different dimensions (Haneesh et al., 2013). One such dimension relates to deficits in specific cognitive functions that may lead to conditions like Specific Learning Disorders (SLD; Tolar et al., 2016). Deficits in motivational, emotional, and social areas is another dimension that may lead to conditions like underachievement (Siegle, 2018). In the academic realm, the term underachievement is used to refer to “school performance, usually measured by grades, that is substantially below what would be predicted based on the student’s mental ability, typically measured by intelligence or standardized academic tests” (Reis & Mc Coach, 2000, p. 157). Two different methods often used for operationalizing underachievement are the “simple difference method” and the “regression method.” In the former, underachievers are defined as those who obtain standardized achievement scores one standard deviation below their standardized ability scores, and in the latter, actual achievement scores lower than one standard error of its regressed estimate is considered as the criterion for defining underachievement (Jackson & Jung, 2022; Lau & Chan, 2001). In the same way, when students achieve higher than what is expected based on their ability, they may be designated as overachievers and those who achieve at par with their ability may be designated as normal achievers (Veas et al., 2017). It is important to note here that all these groups are characterized by average or above-average levels of general intelligence. Much of the research in the past has focused on identifying the correlates of academic achievement in underachievers and children with disabilities (Maki et al., 2020; Toffalini et al., 2017), probably due to its negative impact on the individual and to the society. However, one should consider research on overachievement also as important since it could supplement the insights gained from research on underachievers regarding the correlates of academic achievement. Though there had been some research in this direction, most of them were focused on psychosocial and demographic variables (e.g., Clark, 2014; Dings & Spinath, 2021).
Irrespective of the causal factors involved, very low academic achievement often calls for remedial strategies to facilitate performance. To develop effective strategies of intervention in such situations, it is necessary to understand all the variables involved and the complex interactions among them. The spurt of research in the area of underachievement and learning disabilities evident in recent years may be seen as a response to this need.
It has been shown that the Wechsler scales help to understand a child’s cognitive strengths and weaknesses concerning academic performance rather well (Benson et al., 2019). However, there is a lack of clarity as to which aspect of intellectual capacity determines success in academics. Some research has shown that mental speed and short-term memory are the key indicators of academic performance (Vock et al., 2011). Similarly, IQ has been identified as the single best predictor of word reading ability (Mayes et al., 2018), and auditory working memory as a predictor of reading ability much beyond IQ (Mayes et al., 2009). Scores on Digit Span are shown to predict reading ability, while scores on Coding are found to predict achievement in Mathematics (Mayes et al., 2009). Children with sub-average school achievement have been found to show deficits in working memory (Maehler & Schuchardt, 2016). It has been shown that the working memory of children assessed at 5 years of age was the best predictor of literacy and numeracy skills acquired at the school level and differences in IQ could account for only a small proportion of variance in performance (Alloway & Alloway, 2010). At the same time, several studies have underscored the importance of both intelligence and working memory in determining academic achievement (Cornoldi et al., 2014; Giofrè et al., 2017).
Studies have shown that gifted students are better in learning and memory tasks compared to children with average intelligence (Bucaille et al., 2021). They are also found to perform better in short-term recall, interference tasks, and long-term memory tasks measured by the Rey Auditory Verbal Learning Test (RAVLT; Fard et al., 2016). At the same time, studies on children with Reading Disability using the California Verbal Learning Test indicated that they had less efficient rehearsal and encoding mechanisms resulting in poor performance in recognition and recall and slow rate of learning (Kramer, Knee, & Delis, 2000).
Several studies have indicated that the cognitive profile of children with SLD differs from that of normal children. It is reported that children with SLD are characterized by deficits in cognitive skills related to learning, especially working memory, despite their average intellectual capacity (Cornoldi et al., 2014; Swanson et al., 2010; Swanson, 2006; Peng & Fuchs, 2016; Wechsler, 2003). They are shown to have deficits in central executive functioning (Brandenburg et al., 2015; Passolunghi & Siegel, 2001); visual-spatial sketchpad (Passolunghi & Mammarella, 2010; Schuchardt et al., 2008); auditory memory (Kibby et al., 2004); acquisition of information (Kramer et al., 2000); rehearsal and encoding mechanisms (Oyler et al., 2012); retrieval difficulties (McNamara & Wong, 2003); and impairments in processing speed (Catts et al., 2002; Christopher et al., 2012; Groth-Marnat, 2009; Kail, 2000).
It has been well-recognized that scholastic underachievement can also result from reasons other than SLD and intellectual deficiency. However, a review of studies conducted in the area indicates that there has not been consensus regarding the criteria for the identification of underachievers (Dings & Spinath, 2021). It has been pointed out that underachievement is not a term reserved for gifted students, and that it can be applied to individuals having varying levels of intelligence (Dittrich, 2014). Studies conducted in the area so far have explored the psychosocial factors associated with academic underachievement (Figg et al., 2012; Stankov & Lee, 2014), the cognitive correlates of gifted underachievers (McCoach & Siegle, 2003), and lack of metacognitive abilities (Tibken et al., 2021). Some of these studies have revealed that fine motor skills were significant predictors of academic underachievement (Stoeger et al., 2008) and that underachievers are characterized by lower scores in both attention and fine motor skills (Stoeger et al., 2013). Though it is well-established that the learning and working memory functions are lower for children with SLD (Schuchardt et al., 2010), very few studies have tried to compare them with children who tend to underachieve in academics.
Research on overachievers has shown that they tend to use learning strategies such as elaboration and metacognition to a greater extent compared to normal and underachievers (Veas et al., 2017). It has also been shown that Digit Span was the strongest neurocognitive predictor of overachievement in Reading and Math after IQ (Mayes et al., 2020).
It is evident from the foregoing review of studies that there has been some progress in identifying certain cognitive deficits associated with SLD. At the same time, the review also revealed that there is lack of sufficient information regarding characteristic cognitive profiles of different categories of children showing discrepant academic achievement (like Underachievers, Overachievers, and children with SLD), to enable one to differentiate these groups from each other. The present study was conceived in this context. The study aims to find out the characteristic cognitive profiles, if any, of different groups of children who show a considerable discrepancy between their ability level and academic achievement.
Hypothesis
The study intends to test the tenability of the hypothesis that children with Specific Learning Disorders (SLD), Underachievers (UA), Normal Achievers (NA), and Overachievers (OA) differ among themselves in terms of their characteristic cognitive profiles indexed using variables of WISC-IV and RAVLT.
Method
Participants
The participants for the study included 308 students (201 boys and 107 girls) drawn from different schools in Kerala state, India using the purposive sampling technique. The participants fell under the age category of 12–16 years and belonged to 8th (70.8%), 9th (23.5%), and 10th (5.5%) classes. To control for confounding variables like intellectual handicaps and emotional problems, the participants were screened for intellectual disability and the presence of emotional problems, behavioral disorders, and visual, auditory, or other physical handicaps. Similarly, possible effects of variables like the medium of instruction, curriculum, facilities available, nature of the training received, nature of assessment, etc., were controlled by restricting the sample to one kind of school only, that is, private schools that followed the Central Board syllabus in English medium.
The sample consisted of a group of 42 children (33 boys and 9 girls) diagnosed with Specific Learning Disorder (SLD) by a qualified clinician and another group of 266 children (168 boys and 98 girls) who were free from SLD or other major problems of development. This latter group could be further divided into three categories, that is, Underachievers (UA), Normal Achievers (NA), and Overachievers (OA) based on the discrepancy between their actual academic achievement (percentage of total marks obtained in the previous annual examination) and that predicted based on their IQ. Though conventionally in the regression method, an actual achievement score lower than one standard error of the estimated score is considered indicative of under-achievement, in the present study the researchers decided to make a small modification of this procedure to make it more stringent. Accordingly, it was decided to find out the SD of the absolute values of the discrepancy between obtained and predicted achievement scores and fix two SD of these values as the minimum amount of discrepancy needed to consider an achievement score as significantly different from the predicted score. Thus, those having achievement scores lower than the expected scores by this minimum amount were designated as underachievers and those having higher achievement scores by the same amount were designated as overachievers. All those who had achievement scores within this range were classified as normal achievers. This sub-classification of the non-SLD group was done after completing the collection of data from all the participants. Out of the total of 266 participants without SLD, 29 (11 boys and 18 girls) met the criteria for classification as Overachievers and 40 (35 boys and 5 girls) could be classified as Underachievers. The remaining 197 participants (122 boys and 75 girls) were classified as Normal Achievers. It may be worth noting here that seven cases identified as underachievers and 13 cases identified as overachievers using the traditional regression method were classified as normal achievers by the new method. Thus, the new method adopted in the present study could be considered more stringent.
Materials
The materials used for the study were the following:
(1) Wechsler Intelligence Scale for Children (WISC-IV India, 2012)
Since the latest version of WISC (WISC-V) has not been standardized in the Indian population, it was decided to use the WISC-IV India to assess the cognitive profiles of children in the present study. It may be noted that this version of the WISC is adapted for use among Indian children and provides a measure of the intellectual ability of children aged 6–16 years. It yields a Full-Scale IQ score (FSIQ), as well as four index scores, that is, Verbal Comprehension Index (VCI), Perceptual Reasoning Index (PRI), Working Memory Index (WMI), and Processing Speed Index (PSI). These index scores are derived from 10 subtests, that is, Block Design (BD), Similarities (SI), Digit Span (DS), Picture Concepts (PCn), Coding (CD), Vocabulary (VC), Letter-Number Sequencing (LN), Matrix Reasoning (MR), Comprehension (CO), and Symbol Search (SS).
(2) Rey Auditory Verbal Learning Test (RAVLT)
Since learning and memory are interdependent processes, it was decided to include a direct measure of learning and memory in the study. The scale used for the purpose was the Indian adaptation of RAVLT (Kar et al., 2004) developed for use with children aged up to 16 years. The test provides scores on six different variables, that is, Total Acquisition (total number of words recalled in 5 trials), Learning score (score in trial 5-score in trial 1), Proactive interference (score in trial 1-score in List B), Retroactive interference (score in trial 5-score in trial 6), Delayed recall (score in trial 7), and Intrusions. In addition to these variables, the present researchers decided to derive a new variable from the data to represent the ability to retain information in memory for an extended period. This new variable was named Retention and was obtained by dividing the delayed recall score (trial 7) by the score obtained in trial 6. Thus, the new variable represented the proportion of learned material that could be recalled later after a time gap of about 30 min.
Procedure
To ensure the selection of an unbiased and representative sample for the study, a list of schools to be visited by the investigator was prepared in advance taking into consideration factors like proper management, the strength of students, accessibility, etc. The Heads of the selected schools and class teachers were personally met by the investigator to get their permission and consent. The class teachers helped in identifying students with different levels of academic performance, that is, high performers, moderate performers, and low performers, based on the average marks of students in previous examinations. To ensure the selection of a sufficient number of overachievers and underachievers in the study, the class teachers were requested to identify students who were not performing up to the expected level based on their general ability and also those who were performing surprisingly well. This method of nomination has been used by researchers as a practical method to identify students who tend to perform poorly despite having good potential (Lau & Chan, 2001) and to identify gifted underachievers (Jackson & Jung, 2022). The investigator randomly selected a few students from these groups for inclusion in the study. In the case of the SLD group, the selected participants were regular students of schools who were identified as having SLD by a qualified psychologist at a clinical center. Consent of the parents of the selected children was obtained using a consent form developed by the investigator. The tests were administered individually to each student at school. The testing schedules for individual students were prepared in consultation with the teachers and students making use of the time set apart for extra-curricular activities like Physical Education and Fine Arts. Since more than an hour was required to administer the core subtests of WISC-IV India to a student, it was decided to administer the first five subtests in one session and the next five in another session on the same day, following the standard order of administration as given in the test manual. The RAVLT was administered in a third session on the same day or the next day depending on the availability of time. Information regarding marks obtained by the students in two major examinations conducted at the school level was also obtained from the class teachers using an academic performance blank.
Statistical Analysis
One way analysis of variance followed by post hoc analysis (using Duncan’s test) was done to find out whether the UA, NA, OA, and SLD groups differ from each other in the different variables under consideration. An estimate of effect size was obtained using eta squared.
Discriminant function analysis was used to identify the specific set of variables best suited to highlight the differences among the groups.
Results
Univariate Differences among the subgroups
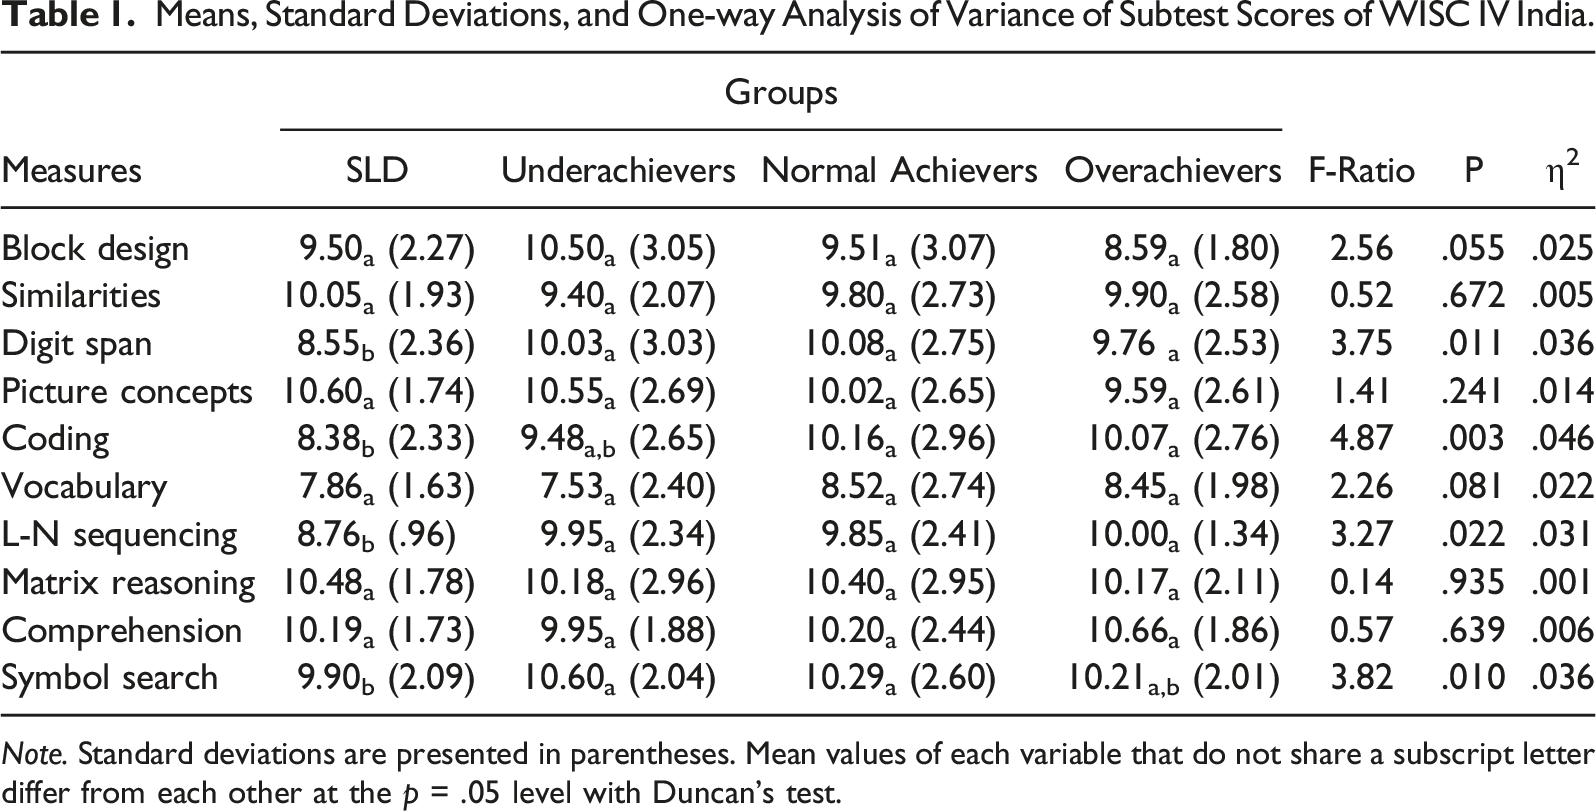
Means, Standard Deviations, and One-way Analysis of Variance of Subtest Scores of WISC IV India.
Note. Standard deviations are presented in parentheses. Mean values of each variable that do not share a subscript letter differ from each other at the p = .05 level with Duncan’s test.
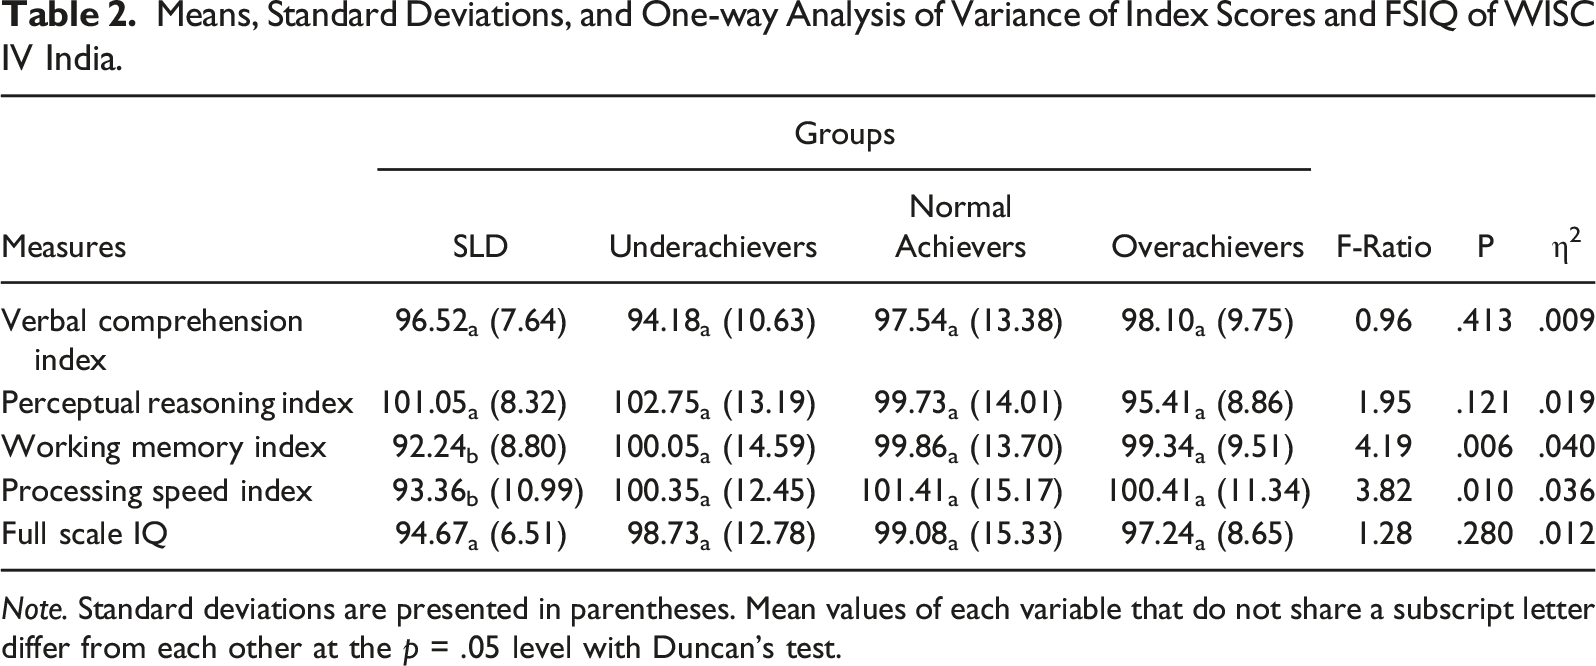
Means, Standard Deviations, and One-way Analysis of Variance of Index Scores and FSIQ of WISC IV India.
Note. Standard deviations are presented in parentheses. Mean values of each variable that do not share a subscript letter differ from each other at the p = .05 level with Duncan’s test.
Means, Standard Deviations, and One-way Analysis of Variance of Subtest Scores of RAVLT.

Note. Standard deviations are presented in parentheses. Mean values of each variable that do not share a subscript letter differ from each other at the p = .05 level with Duncan’s test.
It may be seen from Table 1 that significant differences among the study groups exist in four subtests, that is, Digit Span (F (3, 304) = 3.75; p = 0.011), Letter-Number Sequencing (F (3, 304) = 3.27; p = 0.02), Coding (F (3, 304) = 4.87; p = 0.003), and Symbol Search (F (3, 304) = 3.82; p = 0.01). Effect sizes relating to these variables ranged from .031 to .046. Post-hoc analyses of pairwise differences showed that the SLD group scored significantly lower than the other three groups in all these subtests. At the same time, there were no significant differences among the groups in any of the other subtests.
The results of ANOVA presented in Table 2 indicate that the four groups differed with respect to WMI (F (3, 304) = 4.19; p = 0.006) and PSI (F (3, 304) = 3.82; p = 0.010), with effect sizes .040 and .036, respectively. At the same time, no differences were found in VCI, PRI, and Full-scale IQ. In the indices of working memory and processing speed, the SLD group obtained a significantly lower score than the other three groups.
Table 3 indicate that there exist significant differences among the groups with respect to three variables, that is, Total Acquisition (F (3, 304) =6.87; p ≤ .001), Delayed recall (F (3, 304) = 6.67; p = 0.000), and Retention (F (3, 304) = 3.34; p = 0.02). Effect sizes relating to these variables were .064, .062, and .032, respectively. In the acquisition and delayed recall, the OA group scored significantly greater than both the SLD and UA groups, while in Retention, the mean score obtained by the SLD group was significantly lower than that obtained by all the other groups including the UA group. At the same time, there were no significant differences among the groups in learning scores, proactive interference, retroactive interference, and intrusions.
Discriminant function differentiating underachievers, normal achievers, overachievers, and students with SLD
Canonical Discriminant Function Coefficients Obtained With the Variables of WISC-IV and RAVLT.

Note. PRI = Perceptual Reasoning Index; WMI = Working Memory Index; TA = Total Acquisition; CC = Canonical Correlation.
Group Centroids of Discriminant Functions Relating to Different Groups and Results of F-tests for Pairwise Comparison of Distances Between Groups.

Note. Variables included in the functions in the different steps are the following: Step1 = Acquisition; Step2 = Acquisition + PRI; Step3 = Acquisition + PRI + WMI; Step4 = Acquisition + PRI + WMI + VC; and Step5 = Acquisition + PRI + WMI + VC + Retention.
aWithin each step, subgroups that do not share the same numbers differ significantly from each other.
It may be seen from Table 4 that a set of five variables, including three belonging to WISC-IV (Vocabulary, PRI, and WMI), and two belonging to RAVLT (Total Acquisition and Retention), were identified as the most important ones for discriminating among the different groups under study. It is also seen that these variables constituted two significant functions. Function 1 is defined by positive coefficients of Acquisition, Vocabulary, Working memory, and Retention, and negative coefficient of PRI. On the other hand, Function 2 is defined by positive coefficients of WMI, Retention, and PRI and negative coefficients of Vocabulary and Acquisition. The canonical correlation of the first function is found to be .367 and that of the second function, .265. This meant that the first function could account for about 13.47% of the variance among the groups, and the second function, about 7.02%.
Considering the centroids of the function coefficients presented in Table 5, we see that in the case of function 1, the centroid associated with the SLD group (−.737) was the lowest and that associated with the OA group (.730) was the highest. The UA group (−.386) got a negative centroid closer to that of the SLD group, while the centroid of the NA group (.128) was positive and closer to that of the OA group. For function 2, the centroid associated with the UA group (.556) was the highest, and that of the SLD group (−.446) was the lowest. The centroid of the OA group (−.274) was negative and closer to that of the SLD group, while the centroid of the NA group (.022) was positive and very close to zero.
A graphical representation of the centroids obtained by the four subgroups under study is presented in Figure 1 to help a visual assessment of the differences among the groups in the two functions. Graphical representation of the centroids of discriminant functions relating to the SLD, UA, NA, and OA groups.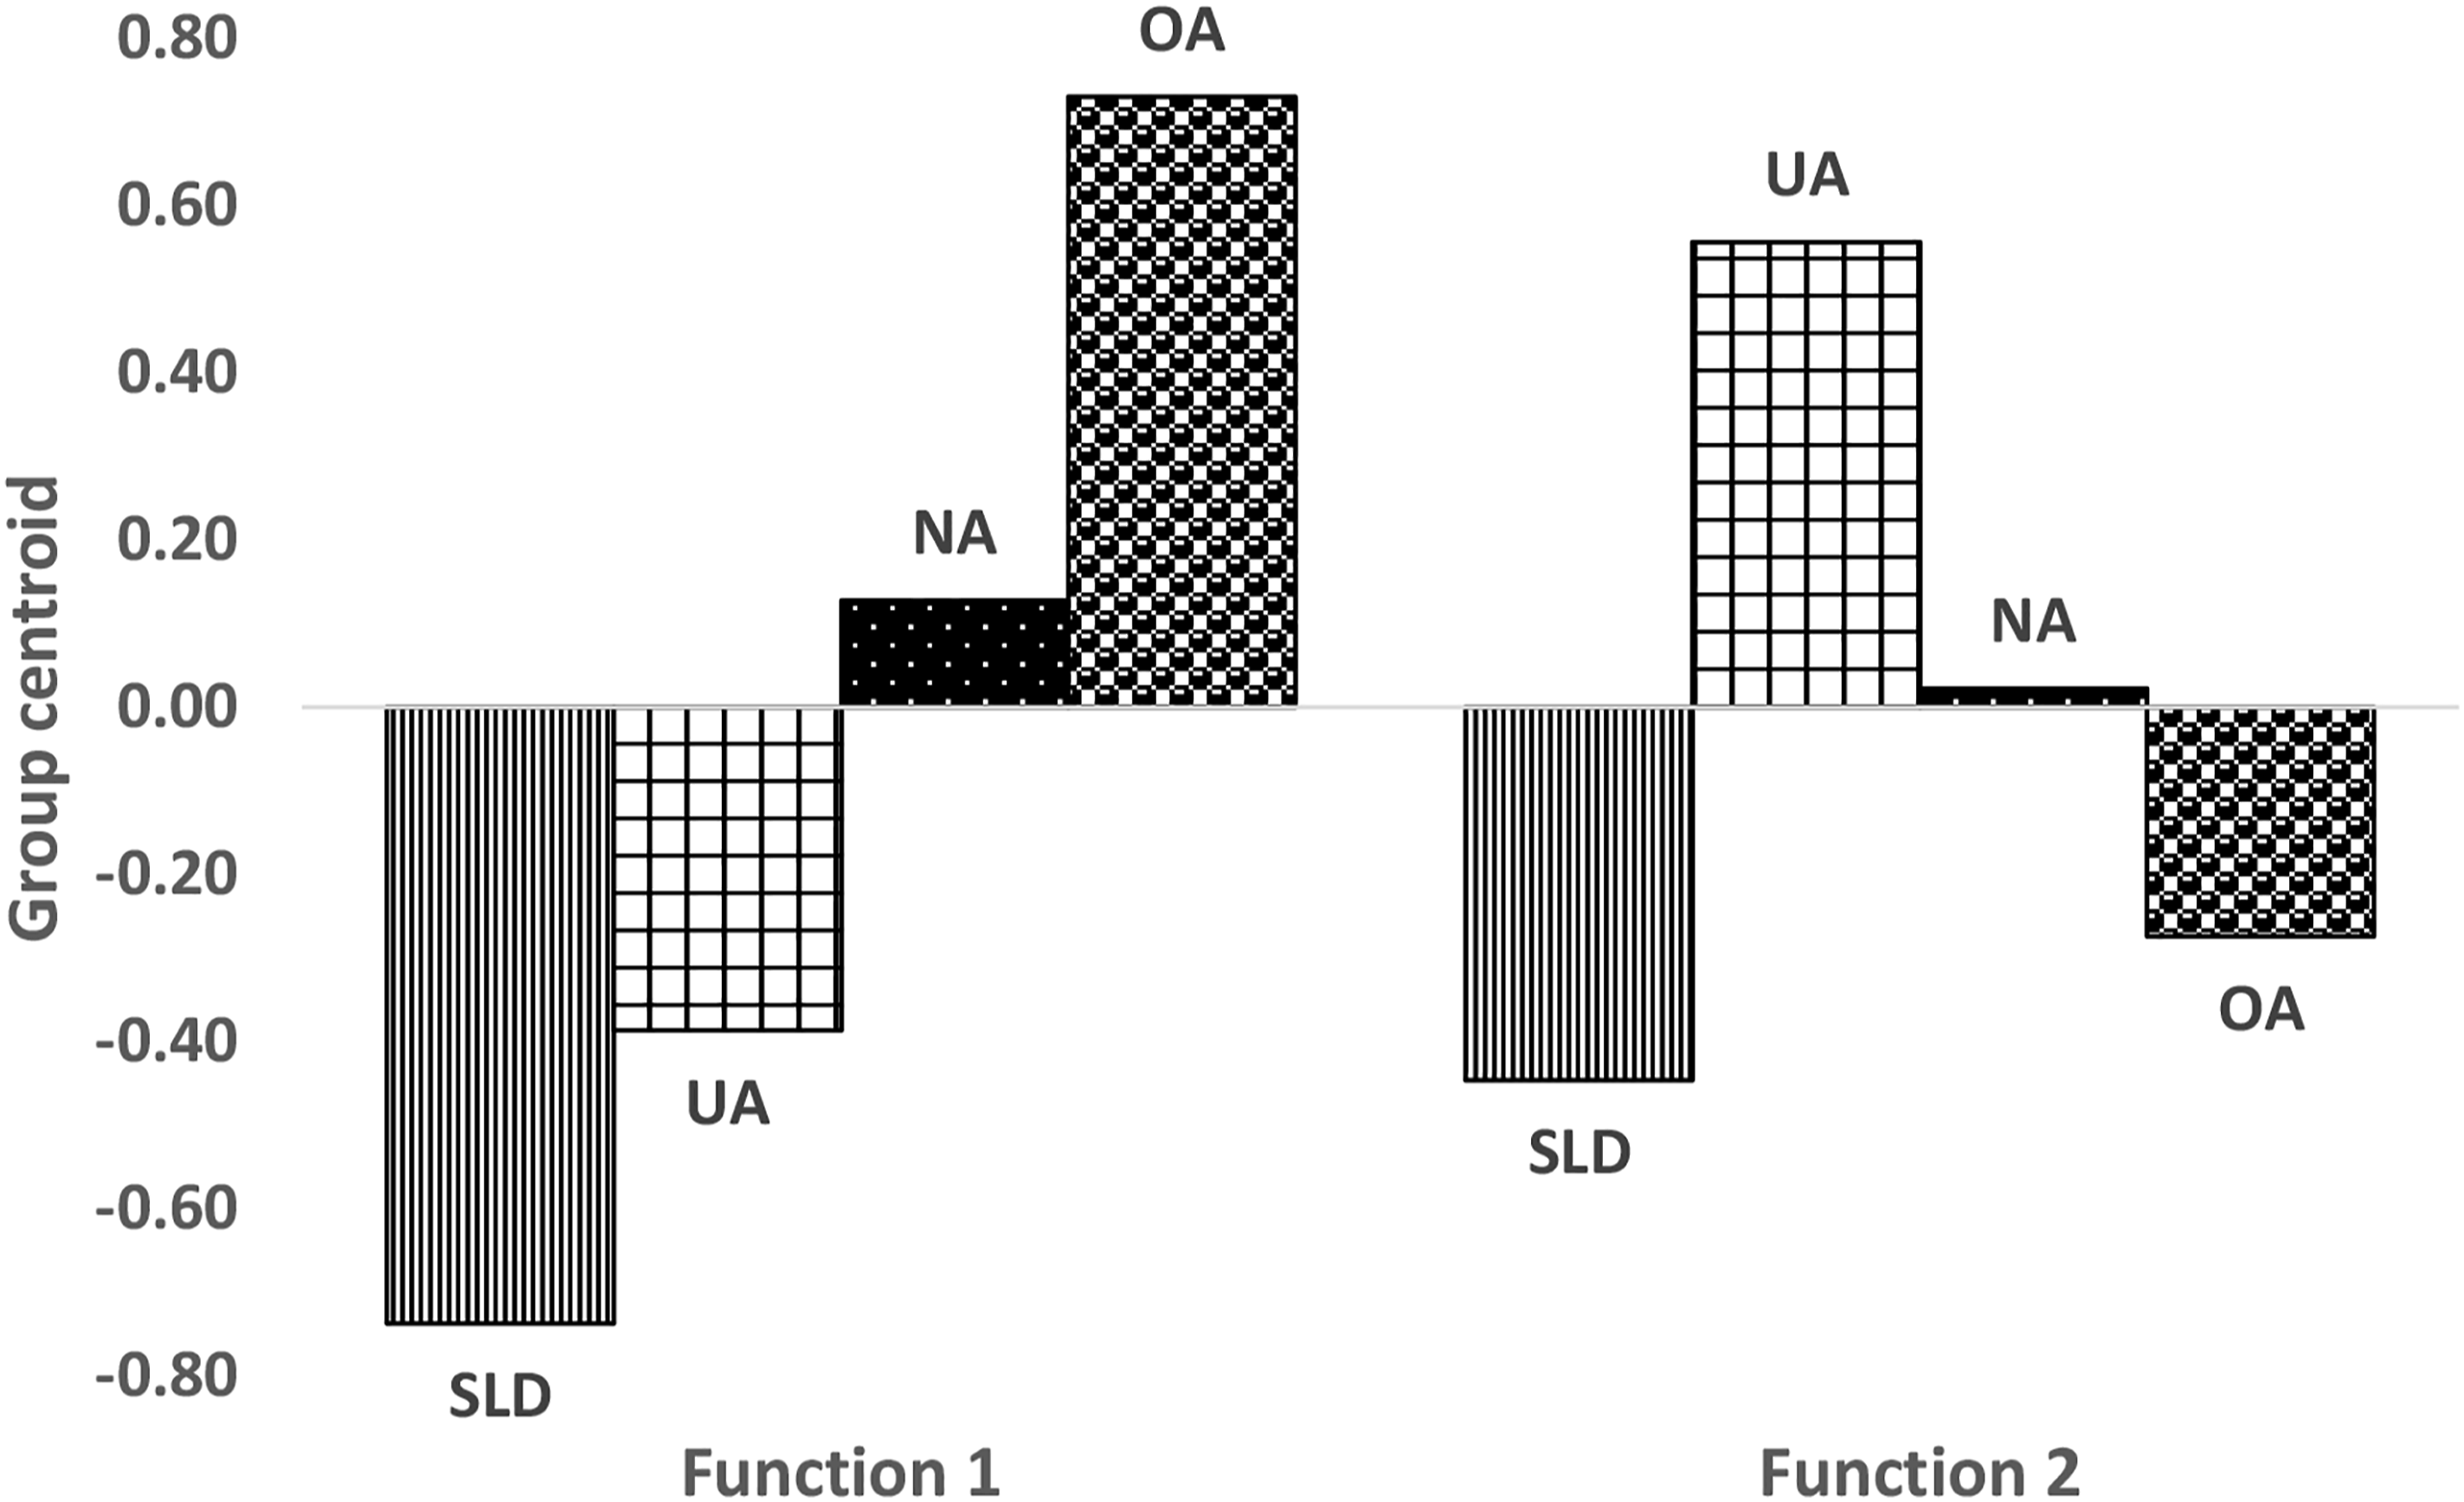
It may be seen from Figure 1 that the centroids of SLD and the OA groups in function 1 were sufficiently distinct to enable their differentiation from each other. Further, differentiation between the SLD and the UA groups could be easily made based on their centroids in function 2, and the NA group could be identified based on close to zero centroids obtained by them in both the functions.
Table 5 contains summarized results of paired comparison of distances between the groups. These results are available for each step of the analysis, relating to the inclusion of individual variables in the function. Accordingly, step 1 was related to the variable Total Acquisition, and the results of F-tests indicated that when Total Acquisition was the only variable included in the function, it could significantly discriminate the OA group from all the other groups. Further, the NA group could be differentiated from the SLD group but not from the UA group, and the UA group failed to get differentiated from the SLD group.
In step 2, when PRI was added to the function, it could discriminate the NA group from the UA group. However, the UA group continued to be undifferentiated from the SLD group. In step 3, when WMI was added to the function, it could discriminate the SLD group from all the other groups, while the UA and NA groups could not be differentiated from each other. In step 4, with the addition of Vocabulary in the function, all the four groups could be differentiated from each other at a statistically significant level. Finally, in step 5, the variable Retention got added to the function, and this enabled differentiation of the SLD and the UA groups with greater precision.
The variables identified by discriminant analysis could be used to generate characteristic cognitive profiles of the groups involved. Accordingly, the cognitive profiles of the SLD, UA, NA, and OA groups were generated using mean scores on the five variables included in the discriminant function and the outcome is depicted in Figure 2. It may be noted that standardized scores on the variables have been used for generating the profiles in Figure 2 to facilitate visual comparison. Cognitive profiles of SLD, UA, NA, and OA groups created using significant variables included in the discriminant function.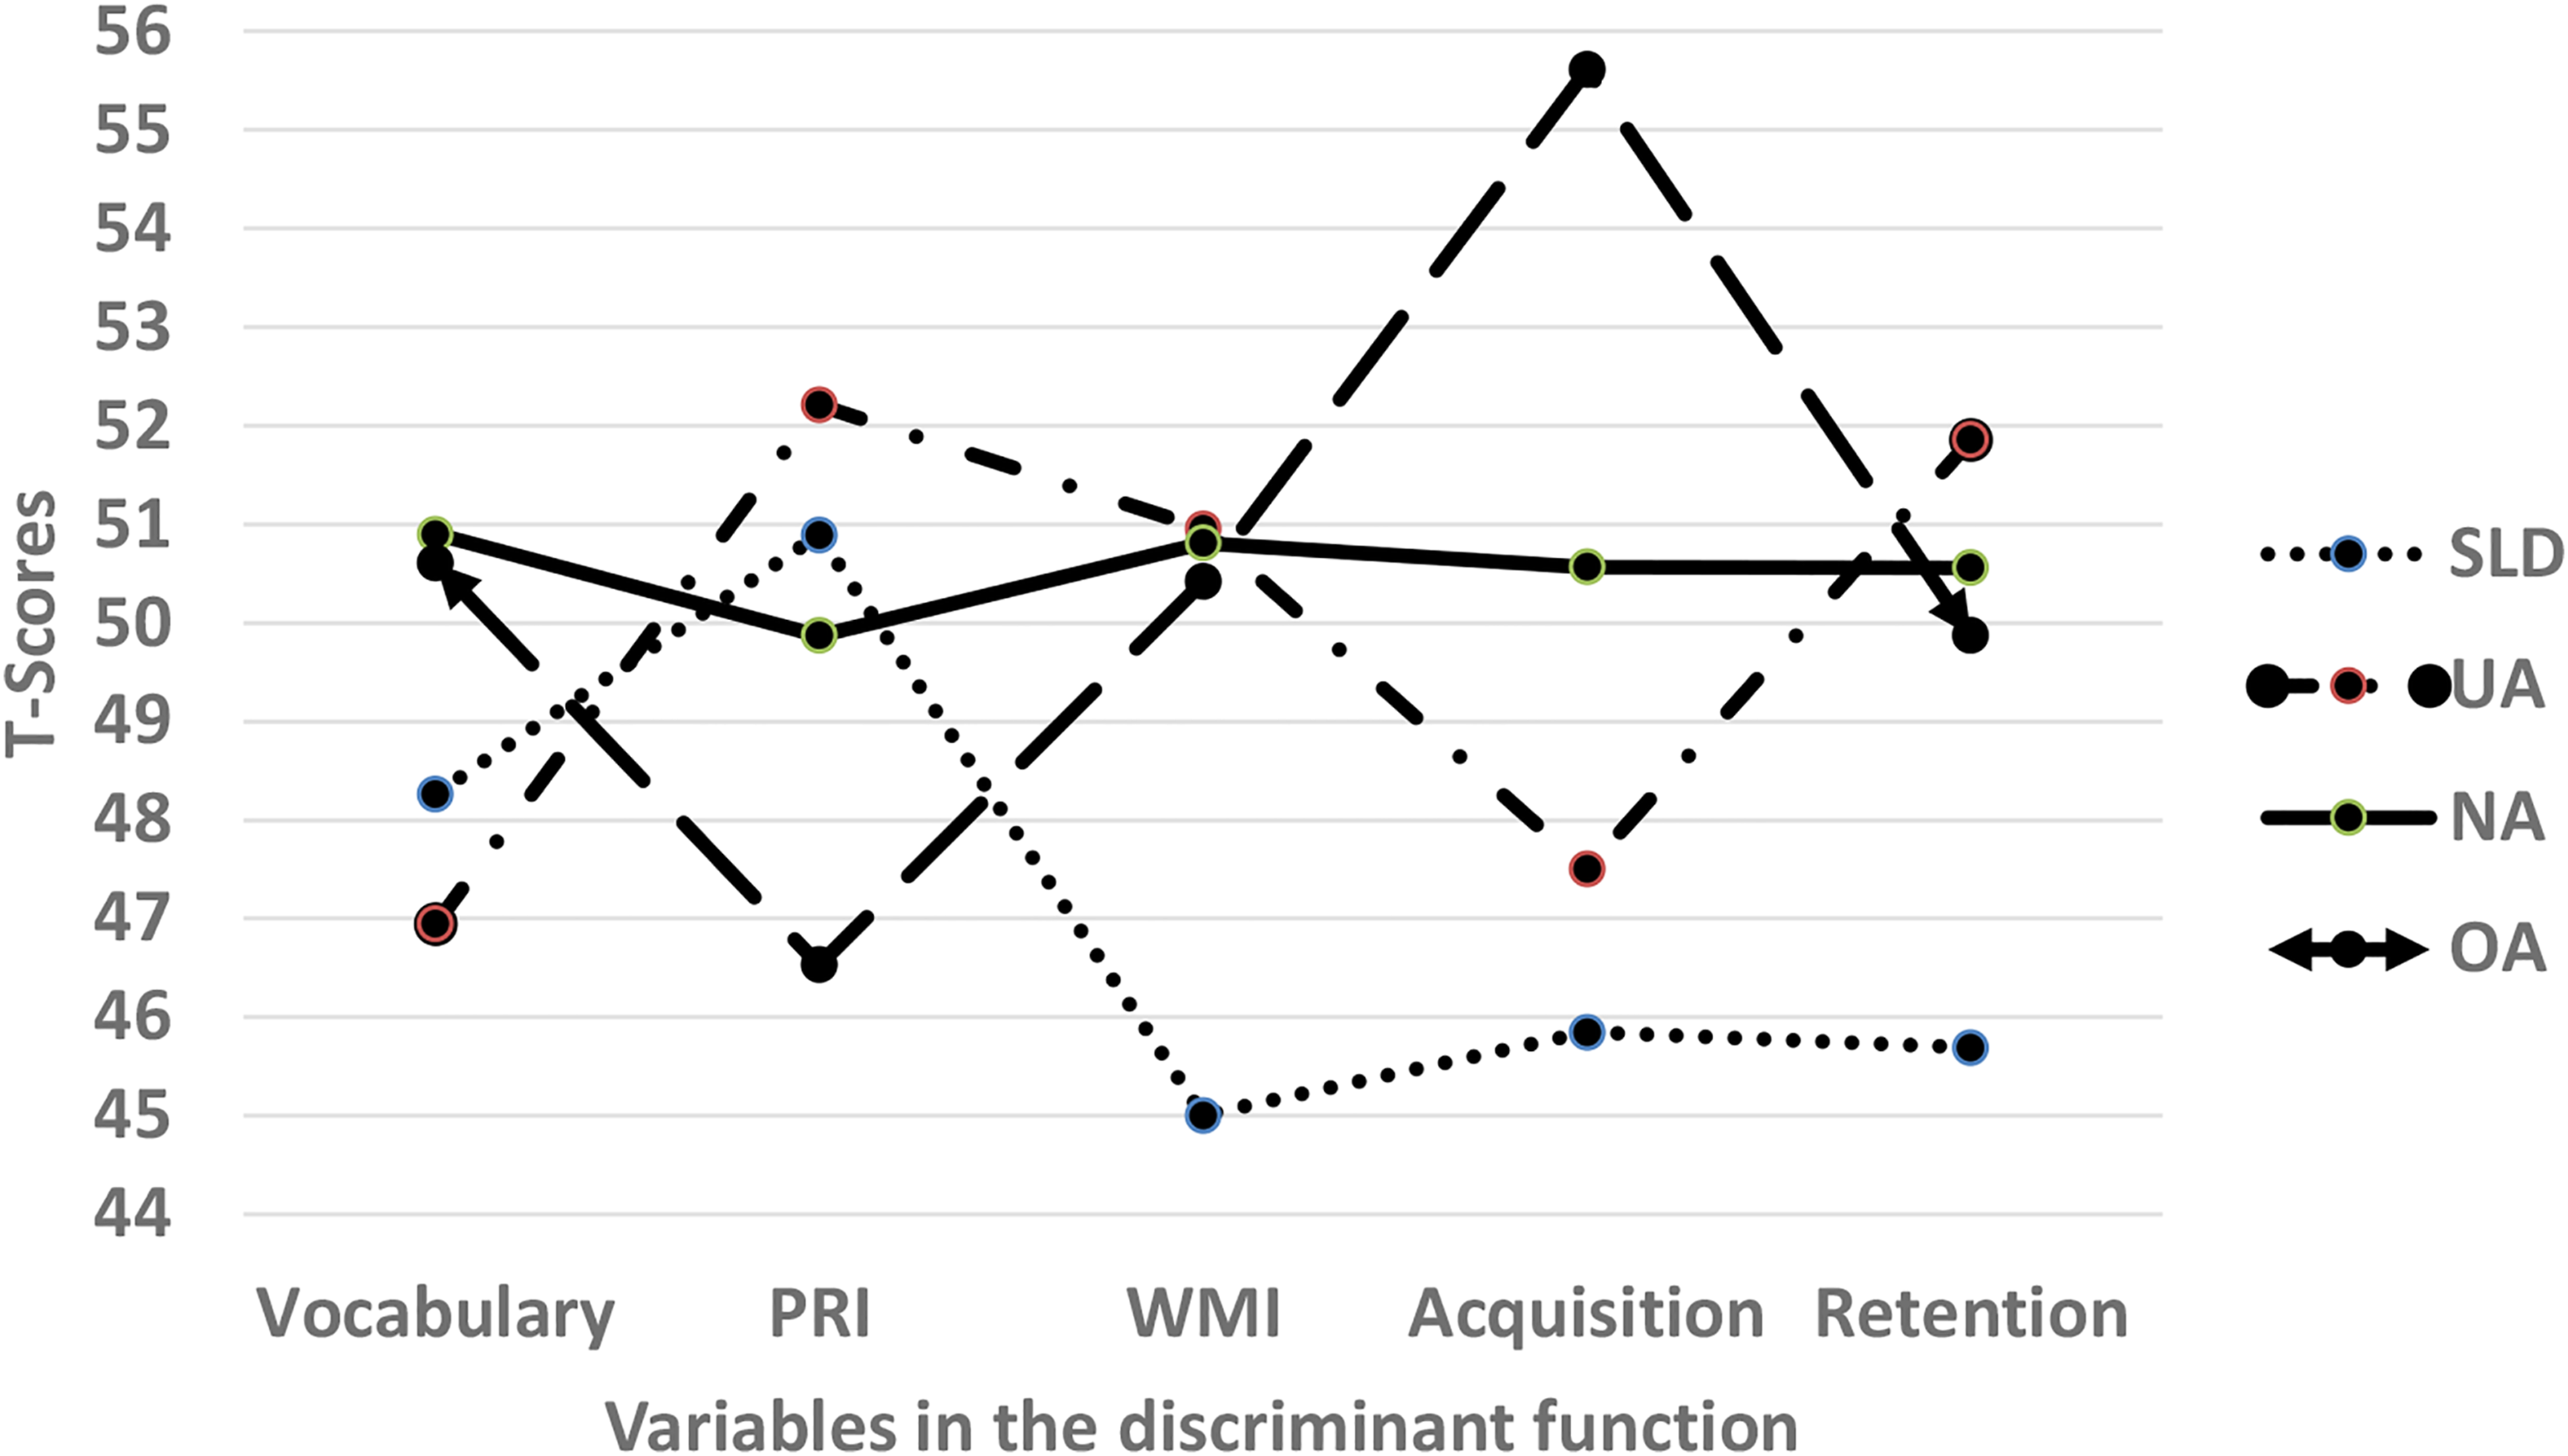
It may be seen from the cognitive profiles of different groups depicted in Figure 2 that the most distinguishing characteristic of the SLD group was their very low performance in WMI, Acquisition, and Retention. Similarly, the prominent feature of the UA group was their relatively higher performance in PRI and Retention and lower performance in Vocabulary and Acquisition. The OA group was characterized by low performance in PRI and high performance in Acquisition, while the NA group was characterized by moderate performance in all the variables.
Discussion
The results of one-way ANOVA done separately for the different variables of WISC-IV and RAVLT and discriminant analysis done on the combined set of variables are discussed in the following sections.
Differences in WISC-IV test performance
It may be seen from the results presented in Tables 1 and 2 that the UA, NA, and OA groups were similar in all the subtests and the index scores of WISC-IV. However, the SLD group scored significantly lower than all these three groups in WMI and PSI and two subscales of WISC-IV, that is, Digit Span and Letter Number Sequencing. Further, the same group scored significantly lower than the NA and the OA groups in Coding and significantly lower than the NA and UA groups in Symbol Search.
Notably, WMI is derived out of the Digit Span and Letter-Number Sequencing subtests. Digit Span, which is a measure of short-term memory and attention, requires the ability to recall, sequence, and vocalize auditory information. The low score in Digit Span obtained by the SLD group may stem from their difficulty in storing and retrieving information received through auditory mode (Bailey & Snowling, 2002; Landerl et al., 2009). Letter-Number Sequencing involves the recall of numbers in ascending order and letters in alphabetical order in two different sequences. Performance of the test requires attention, concentration, sequencing ability, and auditory short-term memory. The findings of the present study agree well with that of previous researchers who had reported certain specific neuropsychological deficits in children with SLD like problems with working memory that make the processing of complex information more time-consuming and energy taxing (Wechsler, 2003); deficits in phonological processing, storage, and functioning of the central executive components of working memory (Swanson, 2006); and impairments in visual-spatial sketchpad that lead to arithmetic disabilities (Schuchardt et al., 2008).
In the case of PSI, which is the second variable in which the SLD group scored significantly lower than the other three groups, the components involved are Coding and Symbol Search. Successful performance on these subtests involves the use of short-term visual memory, attention, visual discrimination, and visual-motor coordination (Prifitera et al., 2008). Processing Speed Index is considered a measure of one’s ability to perform cognitive tasks fluently and automatically, especially when under pressure, and to maintain focused attention and concentration. Processing speed is not just a factor that contributes to intelligence; rather, it is causally linked to many aspects of intelligence. It has been suggested that rapid processing of information may be affected in children with learning difficulties, which could interfere with their working memory structures and thereby reduce their ability for new learning (Kail, 2000). Getting lower scores in processing speed than in reasoning abilities is found to be characteristic of children with academic difficulties, and is highly negatively correlated with reading as well as arithmetic achievement (Christopher et al., 2012). Research evidence that lends support to the finding of the present study includes that of Groth-Marnat (2009) who reported that the processing speed index is highly sensitive to cognitive problems associated with learning disabilities, ADHD, etc.
Examining the pattern of scores obtained by the four groups in the different components of PSI (see Table 1), it may be seen that both the Underachiever and the SLD groups scored significantly lower than the Normal Achiever and the Overachiever groups in Coding. This points toward the possibility that performance in the Coding task may be affected by both motivational and cognitive factors. In the case of Symbol Search, it was interesting to note that the scores obtained by the higher achiever group were not significantly higher than those obtained by the SLD group. This points toward the possibility that the lower scores obtained by these two subgroups were for different reasons. For example, the lower score obtained by the Overachiever group in Symbol Search may be due to the extra time taken for more detailed scanning of materials by them, while the lower score obtained by the SLD group could be attributed to deficits in mental processing speed. Further studies involving more cognitively challenging tasks may be required to verify the above contention. Deficits in processing speed have also been identified in children with arithmetic as well as reading disabilities (Catts et al., 2002).
The SLD group was found to be not different from the other three groups in the VCI and the PRI when these variables were considered independently. Similar results have been obtained in previous studies on children with ADHD, wherein they had better PRI and VCI scores than PSI and WMI scores (Mayes & Calhoun, 2006). Similarly, the underachiever group was not found to differ from the normal or overachiever groups in any of the cognitive indices, indicating that they are free from deficits of cognitive functions assessed by WISC-IV. Further, there were no significant differences in the FSIQ scores of the four groups. It is interesting to note that the study groups, despite having comparable intelligence, were found to differ widely in their academic performance. In short, the results obtained for WISC scores, presented in Tables 2 and 3 have revealed that the SLD group could be differentiated from the NLD groups in terms of two indices, that is, the WMI and the PSI. However, the WISC was not able to differentiate between the underachievers, normal achievers, and overachievers.
Differences in Auditory Verbal Learning
Results of the F-test presented in Table 3 indicate that there exist significant differences among the subgroups in three variables of RAVLT, namely Total Acquisition, Delayed recall, and Retention. Detailed exploration of mean differences in these variables using Duncan’s test showed that the SLD and the UA groups did not differ from each other in Acquisition and Delayed recall. However, their scores in these variables were significantly lower than that of the OA group. In contrast to this finding, results relating to the variable Retention showed that the mean score obtained by the SLD group was significantly lower than that obtained by all the other groups and that the UA group obtained the highest score in the variable. The UA, NA, and OA groups did not differ significantly from each other in the remaining variables of RAVLT, that is, Learning score, Proactive interference, Retroactive interference, and Intrusions.
It may be relevant to note here that auditory verbal learning involves the ability to take in and store verbal information received through auditory mode and retrieve it later when required. The results of the present study indicate that there is a linear relationship between this ability and academic achievement. The finding that the OA group scored significantly higher than all the other groups in the Total Acquisition score of RAVLT (although they are not significantly different from the others in overall mental ability) points towards the possibility that performance in RAVLT may be influenced by factors like motivation, habit, etc. At the same time, the significantly lower scores in Retention obtained by the SLD group, especially in contrast to the UA group, indicate that the fast decay of information from memory is an important cognitive deficit that is valuable in differentiating the SLD group from the UA group. Children with SLD have been identified as having significant deficits in memory and they are found to perform poorly compared to high achieving peers (Swanson et al., 2010). The differences are more prominent when the stimuli involved are auditory (Kibby et al., 2004). It is worth noting here that difficulty in recalling verbal material (assessed using California Verbal Learning Test) is due to problems in the acquisition of information (Kramer et al., 2000) while the poor memory performance found among children with SLD has been identified as due to retrieval difficulties (McNamara & Wong, 2003). Other studies have reported that the retention and retrieval abilities of children with SLD were at par with that of normal children. However, the former had less efficient rehearsal and encoding mechanisms which result in poor overall performance (Oyler et al., 2012).
Nature of the discriminant functions identified
Based on the standardized discriminant function coefficients presented in Table 4, we can see that the first function is characterized mainly by low performance in PRI and high performance in Acquisition. Further, high scores in Vocabulary, WMI, and Retention also contribute to high scores in the function. In the case of the second function, high function scores result mainly from high scores in WMI and low scores in Vocabulary. Additionally, high scores in Retention and PRI and low scores in Acquisition also contribute to high scores in the function.
As revealed in the group centroids presented in Table 5 and the graphical depiction of the group centroids presented in Figure 1, Function 1 is useful to differentiate the SLD and the UA groups from the NA and OA groups, while Function 2 can be used to differentiate between the SLD and UA groups.
It may be relevant to note here that discriminant functions can be interpreted meaningfully only when the function coefficients are considered along with the centroids of the functions for the different groups. The sign and size of the function coefficients and the value of the centroids enable us to have an understanding of the contrasting profiles of the different groups. The graph created using mean scores of the selected variables (Figure 2) helps highlight the differences in the cognitive profiles of the different groups under study. Based on the centroids and the nature of the coefficients of function 1, we can infer that in contrast to the OA and NA groups, the SLD and UA groups are characterized by higher scores in PRI and lower scores in Acquisition.
The inclusion of PRI and Vocabulary in the function is surprising, given the fact that both these variables had failed to show significant differences among the groups when considered individually (vide results of ANOVA presented in Tables 1 and 2). The significant results obtained in the discriminant analysis could be attributed to the fact that the multivariate methods help to partial out the effects of other variables from the selected variables, and hence, the outcome of multivariate analysis of the variables could differ from the outcome of univariate analysis of the same variables.
Once a clear distinction is made between the SLD and UA groups on the one hand and the OA and NA groups on the other based on the first function, further differentiation between the pairs of groups (i.e., SLD vs. UA and OA vs. NA) could be achieved with the help of the second function. This was because the largest contrast in the centroids of function 2 was between the SLD and the UA groups, and the centroid of the NA group was close to zero in both functions. Based on the pattern of function coefficients and the value of the centroids of function 2, we are enabled to identify a characteristic cognitive profile that maximizes the contrast between the SLD and the UA groups. Accordingly, we can conclude that in contrast to children with SLD, the Underachievers perform higher in working memory, perceptual reasoning, and retention of auditory verbal material and lower in vocabulary and learning of verbal material (evidenced by lower scores in Acquisition). It is also notable that the NA group is characterized by average performance in all these variables.
It may be noted here that traditionally, parents and teachers find it difficult to distinguish between Underachievers and children with SLD since both the groups are similar in their academic performance and ability level. Identification of the second discriminant function in the present study that facilitates differentiation between these two groups assumes greater significance in this context.
Implications of the study
A brief note on some of the findings of the study which merit special attention may be made here. Firstly, it is important to note that there were some interesting differences in the results of univariate and multivariate analyses obtained in the study. For example, Vocabulary and PRI, which failed to show significant mean differences among the groups when ANOVA was employed, were identified as important components of the discriminant function that differentiated the groups. At the same time, PSI, Coding, and Symbol search, which showed significant mean differences among the groups, failed to get included in the discriminant function. These findings underline the fact that one should be mindful of the possibility of multivariate relationships among the variables while interpreting scores on any specific variable. In other words, an examination of the profile of cognitive measures may yield more useful information than the examination of the different test scores taken individually.
It is also worth noting here that the ability to acquire new information through auditory mode (Acquisition) and retain it in long term memory (Retention) helped to discriminate among the different groups included in the study. The variable Acquisition alone could discriminate the SLD group from the non-problematic achievers (NA and OA groups). At the same time, differentiation between the SLD and the underachiever groups called for variables belonging to the WISC-IV. The variable Retention (newly derived from the RAVLT) contained some additional information that proved to be valuable in achieving a finer differentiation between the SLD group and the Underachiever group. These results imply that a combination of RAVLT and WISC-IV was best suited to achieve discrimination among the SLD, UA, NA, and OA groups.
One of the limitations of the present study is that it made use of an earlier version of the WISC rather than its current version, that is, WISC-V. However, we consider that it may not be a major issue here since the main objective of the investigation, that is, identification of the characteristic cognitive profiles, if any, of school students with discrepant achievement, could be achieved using variables of WISC-IV and RAVLT. Moreover, there exists sufficient overlap between the WISC-IV and WISC-V that allows one to extend the inferences drawn using the WISC-IV to WISC-V with necessary modifications. For example, the present study has shown that three variables belonging to WISC-IV, that is, Vocabulary, PRI, and WMI contributed to the discriminant functions that differentiate the different groups under study. There is some similarity between WISC-IV and WISC-V in the variable Vocabulary and WMI, but they differ in the case of PRI. In WISC-IV, the subtests Block Design, Picture Concepts, and Matrix Reasoning give rise to PRI, whereas in WISC-V, Block Design, and a new subtest “Visual Puzzles” constitute a new index scale “Visual Spatial Index” (VSI); and the subtest Matrix Reasoning along with the newly introduced subtest “Figure Weights” constitute the new “Fluid Reasoning Index” (FRI). Considering the fact that One-way ANOVA had shown that mean differences had reached close to significance levels in the subtest “Block Design,” it may be reasonable to suspect that the VSI in WISC-V could take the place of the PRI in the discriminant function obtained in the present study. However, confirmation of this contention shall await further research using WISC-V.
Footnotes
Acknowledgments
The authors acknowledge the support offered by the Research and Post Graduate Department of Psychology, University of Kerala, India in carrying out the research work successfully.
Declaration of Conflicting Interests
The author(s) declared no potential conflicts of interest with respect to the research, authorship, and/or publication of this article.
Funding
The author(s) received no financial support for the research, authorship, and/or publication of this article.
