




Abstract
Previous studies measured flow states using students’ self-reported experiences, resulting in issues regarding nonobjective and nonreal-time data. Thus, this study used an electroencephalogram (EEG) to measure the EEG-detected real-time flow states (EEG-Fs) of 30 students from the 4th and 5th grades. Their EEG measurements, self-reported reflective flow experiences (SR-Fs), grade levels (GLs), balance of challenge and skill (BCS), and sense of control, represented by their overall test performance (OA-tp) and momentary test performance (MOM-tp), were analyzed to establish their EEG-F’s construct. Based on the results of a chi-square test, the EEG-F correlates significantly with SR-F, BCS, OA-tp, and MOM-tp. A J48 decision tree analysis and logistic regression further revealed that in-flow experiences (in-EEG-F) were detected when students had high SR-Fs, where the BCS contributed to flow states. In particular, students with a low-challenge/high-skill BCS demonstrated an in-EEG-F state upon having a high OA-tp. For high-challenge/high-skill, the in-EEG-F state was determined through their MOM-tp. Through the EEG and flow state construct, this study revealed a whole-part association between students’ momentary and overall reflective flow experiences and identified viable paths for inducing students’ EEG-Fs, which can contribute to future e-learning development when integrated with a brain-computer interface for e-learning or e-evaluation systems.
The flow state is a mental state that can induce inner motivation to generate a high degree of focus and participation and stretch a person’s body or mind to its limits for difficult and valuable activities, frequently resulting in superb work efficacy (Csikszentmihalyi, 1975). Numerous studies have proven the importance of flow experiences in enhancing students’ motivation, attitudes, and performance (Heutte et al., 2016; Schweinle et al., 2008; Tavares & Freire, 2016). Accordingly, many studies have explored students’ experiences druing a flow state and its effects on learning (Hamari et al., 2016; Pavlas, 2010).
However, previous studies were limited in that they used self-reported reflective questionnaires to evaluate students’ flow experiences after an activity, instead of taking real-time measurements throughout the process. This restriction has hidden various critical information because a flow state fluctuates depending on the time and situation (Pearce et al., 2005). In addressing this issue, some studies have attempted to detect neurophysiologic activities when students are working to obtain real-time and more objective measurements (Bos et al., 2019; Cheron, 2016; Harris et al., 2017; Katahira et al., 2018; Lin & Kao, 2018; Metin et al., 2017; Yang et al., 2019). Nevertheless, while these previous studies have measured partial flow-related neurophysiologic activities using EEGs, a more comprehensive method for detecting the flow state itself has not yet been well established. Consequently, the relationship between students’ momentary flow experiences, which can be detected with an EEG, and their self-reported reflective experiences also remain unclear, along with the factors that contribute to students’ transition into a flow state.
Given the gaps in the research on flow state, this study seeks an EEG indicator for detecting students’ EEG-detected real-time flow state (EEG-F) based on previous studies (including those of Bos et al., 2019; Csikszentmihalyi, 1990; and Eldenfria & Al-Samarraie, 2019). In particular, the study defines EEG-Fs using high attention (Csikszentmihalyi, 1990; Wang & Hsu, 2014) and high engagement (Csikszentmihalyi, 1990; O’Brien & Toms, 2008) as both are vital attributes for emerging flow states and are measurable with EEG. Through the defined EEG-F, the relationships between an EEG-F and its potential predictive factors, such as the self-reported reflective flow experience (SR-F), grade level (GL), balance of challenge and skill (BCS), and sense of control, represented by students’ overall test performance (OA-tp) and momentary test performance (MOM-tp), can then be evaluated. As a result, the analysis of these potential predictive factors could determine and establish their effect on the students’ EEG-F and how such factors form the construct of students’ flow state. As such, this study will address the following research questions (RQs):
How is the EEG indicator, defined by the attention and engagement during the detection of the students’ flow states, related to the factors of SR-F, GL, BCS, OA-tp, and MOM-tp? How and to what extent do the factors of SR-F, GL, BCS, OA-tp, and MOM-tp contribute to students’ EEG-measured flow states?
Exploring the relationships of the indicators and factors using the EEG can aid in the creation of e-learning and e-evaluation systems that are based on students’ flow states, contributing to innovations and research about e-learning.
Theoretical Background
Flow Theory
Flow is the “optimal experience” that people feel when they act with total involvement (Csikszentmihalyi, 1975, p. 36). In a flow state, a learner employs his or her mental or physical abilities to do activities with energized focus, full involvement, and enjoyment. In addition, this state can be characterized by the complete immersion in the task and the loss of sense of space and time (Csikszentmihalyi, 1993; Michailidis et al., 2018). Based on an individual’s skill and an activity’s challenge level, Csikszentmihalyi (1975) divided the original flow model into three states: anxiety, boredom, and flow. Later, this model was expanded into eight states, namely arousal, flow, control, relaxation, boredom, apathy, worry, and anxiety, each corresponding to a combination of challenge and skill levels (Csikszentmihalyi 1997; Massimini & Carli, 1988).
Furthermore, flow experiences are closely related to various factors, such as a person’s intrinsic motivation and perception. Chan and Ahern (1999) pointed out that the structure of an activity, in terms of challenge, goal, feedback, concentration, and control, has major influences on intrinsic motivation, which may change if any of its factors were modified. Meanwhile, Lu and Lien (2020) explored students’ perceptions toward learning in a computer game–based learning environment and found that a higher perception of learning as “playing” is one of the vital factors that lead to a flow state, enhancing learning efficacy. In addition, Csikszentmihalyi (1990) defined eight dimensions that contribute to flow experiences: clear goals and immediate feedback, an equilibrium between the challenge and skill levels, a merging of action and awareness, focused concentration, a sense of control, a loss of self-consciousness, time distortion, and being autotelic or self-rewarding.
In considering these factors for the emergence of a flow state, Csikszentmihalyi (1990) and Arzate and Ramirez (2017) argued that the flow state could be induced even when only some of the factors are satisfied. Meanwhile, various studies have found that the BCS, in particular, affects how learners achieve flow states (Shernoff et al., 2014; Wang & Hsu, 2014). However, Michailidis et al. (2018) argued that the construct remains unclear. For the sense of control, Rodríguez-Ardura and Meseguer‐Artola’s (2017) study revealed that flow states are elicited by this factor, which is closely connected to a learner’s sense of competency or academic achievement in a learning environment (Baronas & Reis, 1988; Skinner & Greene, 2008). Accordingly, several studies have demonstrated that highly competent and achieving students tend to achieve flow states (Borovay et al., 2019; Nakamura, 1988).
However, it should be noted that in many cases, a high-achieving student may also encounter temporary difficulties during an activity. To date, no study has explored how a learner’s long-term sense of control (e.g., throughout a semester course or an examination) and short-term sense of control (e.g., in answering a particular test item) affect a learner’s flow state. Meanwhile, for the factor of age (grade level), Hsieh et al. (2016) discussed how a grade level difference (4th and 6th grades) affects flow experiences and showed that students in higher grade levels demonstrated high flow experiences. In contrast, Bonaiuto et al. (2016) argued that flow experiences are not related to age. However, Bonaiuto et al.’s (2016) participants are adults aged 18–59, which differs from those of Hsieh et al. (2016). As such, the contradictory results and insufficient information regarding the relationship between age and the flow state require further research.
As can be seen, there is a scarcity of related literature about the conditions and characteristics of the flow state and the extent to which the factors affect such a state. In particular, previous studies have only measured flow states using self-reported reflective questionnaires (Chen, 2006), which lack various critical momentary information (Pearce et al., 2005), thereby hindering the discovery of the flow state’s factors. As such, this is a gap that needs to be addressed through new measurement methods.
Electroencephalogram (EEG)
EEG Theory
An EEG measures electrical activity on the skin of the scalp resulting from small electrical waves released when a neuron is depolarized and captures cognitive and affective activities in the absence of behavioral responses, which allows researchers to collect real-time information otherwise impossible (Cohen, 2011). EEGs have been widely used in numerous fields, such as clinical neurology (Perera et al., 2019; Schwartz et al., 2017), psychology (Movahedi et al., 2018; Zhang et al., 2017), education (Babiker et al., 2019; Wang & Hsu, 2014; Yang et al., 2019), and so on.
After obtaining EEG signals, they are analyzed using algorithms and concepts to associate them with the factors to be measured. The Fast Fourier Transform (FFT) can transform the raw EEG signal into a frequency domain (Van Loan, 1992). In the 1–50 Hz frequency range, EEG signals can be divided into 5 wavebands (δ, θ, α, β, γ), which reflect certain cognitive, affective, or attentional states (Noachtar et al., 1999). Meanwhile, the power spectral density (PSD) refers to the spectral energy distribution that would be found per unit time (Stoica & Moses, 2005, p. 6). In line with these, the stronger a particular frequency power spectral density, the higher the likelihood that the respondent is in the specific cognitive-affective state associated with that frequency. In this study, an EEG is used to measure two cognitive-affective constructs—attention and engagement, which are included in Csikszentmihalyi’s (1990) eight dimensions—that contribute to flow experiences.
Attention
In the eight dimensions model, attention, one of the important factors in a flow state, is defined by Csikszentmihalyi (1990) as “focused concentration” (p. 41). Corno (1993) argued that attention could enhance learning performance, and Smith et al. (2010) noted that effective learning depends on sustained attention. Although the significance of the learner’s attention state has been acknowledged, applicable approaches for the observation and measurement of this factor remained unclear. As such, Egner and Gruzelier (2004) used an EEG with an apparatus that can obtain signals from 28 locations to measure students’ attention. Their study found that the β wave variation is strongly correlated with attention.
As EEG detection techniques developed, mobile brainwave sensors have become more reliable and affordable. Consequently, Rebolledo-Mendez et al. (2009) adopted the NeuroSky single-channel EEG and found a positive association between the attention values measured by the EEG and self-reported reflective attention levels. Meanwhile, Liu et al. (2013), who also used an EEG with a mobile single dry sensor, adopted a supervised learning algorithm to categorize students’ attention levels, demonstrating a high accuracy in predicting attention states. Furthermore, Chen and Huang (2014) examined the relationship between headset-measured values and designated activities requiring various attention levels. Wang and Hsu (2014) also compared and associated the attention levels measured by an EEG with self-reported flow experiences in a computer-based instructional environment. For Bos et al.’s (2019) study, they used augmented reality or a traditional interface in monitoring user attention through an EEG sensor during educational tasks. The study also used the brainwave detection system NeuroSky MindWave for data collection and showed results that are in line with the expectation that learning activities with a high degree of involvement often result in students’ higher level of attention. In summary, the previous studies showed that EEGs could be used in detecting attention and that those with a mobile single dry sensor have been widely used as they show satisfactory validity and reliability in identifying students’ attention states.
Engagement
Several of Csikszentmihalyi’s (1990) dimensions for achieving flow experiences, including a merging of action and awareness, a sense of control, a loss of self-consciousness, time distortion, and being autotelic or self-rewarding, are related to and may arise from student engagement. Similarly, O’Brien and Toms (2008) pointed out that engagement is a subset of flow. In particular, Shernoff et al. (2014) asserted that engagement is likely enhanced when an individual perceives the challenge of the task and their own skills as high and balanced.
In the field of neuroscience, Pope et al. (1995) reported an EEG-based engagement index that was represented by the ratio of brainwave beta activity to the sum of alpha and theta activities (beta power/alpha power plus theta power). This index has been widely used in studies, such as those by Berka et al. (2007) and Prinzel et al. (2000). For Berka et al.’s (2007) study, the EEG-based engagement index was found to be related to the participants’ information gathering, visual scanning, and sustained attention, which further supported the validity of the index. Moreover, the EEG-based index of engagement and the technique has also been used to explore the effect of different instruction approaches on students’ levels of engagement (Eldenfria & Al-Samarraie, 2019).
These studies showed that there is a consensus on the importance of both attention and engagement in learning and on the validity and reliability of an EEG in measuring attention and engagement levels. However, the distinction of engagement and attention in EEG measurements, as well as the construct of these in relation to learning, have not been thoroughly explored.
EEG Measurement of Flow Experiences
Using EEGs, several researchers have attempted to detect the neurophysiologic activities that are associated with flow-related or flow experiences during learning activities. In the context of games, Derbali and Frasson (2010) investigated players’ motivation during serious game play and found that the theta wave in the frontal regions and the high beta wave in the left-center region were significant predictors for high levels of motivation. However, although motivation was found to be an important factor in a flow state, the study did not use an EEG to measure players’ flow state. Meanwhile, Berta et al. (2013)’s study revealed that an EEG could identify the three levels of flow states (boredom, flow, and anxiety) through a user experiment using a four-electrode EEG and spectral characterization for different tasks. However, while their results did match the earlier three-channel flow theory (Csikszentmihalyi, 1975), they remain insufficient in predicting more nuanced flow state stages, such as those in the eight-channel model (Csikszentmihalyi 1997; Massimini & Carli, 1988).
On the other hand, some studies did not explicitly associate EEG measurements with flow experiences. Lin and Kao (2018) established a system that used NeuroSky EEG to correct and analyze eight different brainwaves for the detection of a user’s mental states, which were defined as the cognitive capacity allocated to a task. It is noted that the “mental states” should relate to a “flow state” to some degree, but their study did not make use of the term “flow.” Similarly, Monteiro et al. (2018) monitored and analyzed participants’ brainwaves using an EEG while playing a game, revealing the factors of engagement, arousal, and valence. Noteworthily, their study showed that the EEG measurements and data from the individuals’ self-reporting questionnaires were not always consistent. This discrepancy between the collected data emphasizes the need for real-time and more objective measurements, such as neurophysiologic data. In Yang et al.’s (2019) study, they explored the connections between an individual’s attention, meditation, flow state, and creativity during an activity. In particular, the attention and meditation values were measured with the NeuroSky brainwave detection device. Their results show that the self-reported flow state is significantly correlated with the individual’s performance in creativity but not with the EEG values of attention and mediation. Given this, the results of this study are threefold. First, although the study intended to measure an individual’s flow state and used an EEG to measure attention and mediation, it did not focus on measuring flow states with an EEG as they still used the individual’s traditional self-reporting questionnaire. This indicates that EEG measurements for real-time flow states are still not a well-explored and established area of study. Second, students’ performances (creativity) are correlated to their flow states, but it is unknown if the correlation also existed in other learning domains. Third, it concluded that attention and flow state have a weak association, similar to that of Wang and Hsu (2014), despite many previous studies showing the opposite results (Harris et al., 2019; Im & Varma, 2018; Yoshida et al., 2018). This suggests the need to further explore attention and other factors that affect the construct of students’ flow states.
Based on the existing literature regarding the factors of attention and engagement, which both contribute to flow states, the present study defines high attention and high engagement as EEG indicators for detecting students’ EEG-Fs, which is an area that has not been previously explored. Given this, the study also explores how the EEG-F defined in this study is associated with SR-Fs and the construct of students’ flow experiences.
Research Methods
Participants
The participants of this study were volunteer students from one middle-size elementary school located in a metropolitan area, where the first author serves as a teacher. In particular, a total of 30 students, with 15 4th graders and 15 5th graders between 9 and 11 years old, participated in the study (19 boys and 11 girls). In addition to exhibiting a willingness to volunteer, the students were deemed to be in adequate conditions to participate in this experiment by their teachers. In this regard, this exploratory study has passed vetting by the Human Research Ethics Committee (HREC) and obtained understanding and awareness agreements from the parents or guardians of the participants.
Experimental Procedure
This section provides an overview of the experimental procedure, while the instruments, grouping procedures, and data collection will be further explained in the subsequent section. Before the experiment, the students were asked to finish a written skill test to identify each student as having a high- or low-skill level. Afterward, in collecting EEG measurements, each student wore an EEG apparatus as they answered a 30-item computerized challenge test in 30 min. In particular, each test item was categorized as either a high- or low challenge item according to its difficulty. If a student answered a particular challenge item correctly, the student is categorized as having a high short-term sense of control. Meanwhile, when a student correctly answered an above-average amount of challenge items within 30 min, the student is categorized as having a high long-term sense of control. After the experiment, students accomplished the SR-F to reflect on their flow experience during the experiment.
Instruments, Grouping Procedures, and Data Collection
Students’ Balance of Challenge and Skill
As stated in the previous section, two instruments were used to categorize students’ balance of challenge and skill (BCS): a written skill test to distinguish the student as high- or low-skill and a computerized challenge test to provide 30 high- and low-challenge test items. The combination of the students’ skill levels and the challenge level of the test items were then used to represent the BCS while the student was answering each of the 30 items. In particular, the two measurements were coded as dichotomous data because there are only 30 participants. Accordingly, this study adopted a 2 by 2 (skill vs. challenge) design, which identified both challenge and skill as high and low only (Figure 1), instead of a 3 by 3 design, in line with the eight-channel model (Csikszentmihalyi, 1997; Massimini & Carli, 1988), that would lead to a very small size in each cell. Through the 2 by 2 design, the study analyzes the EEG data of channels 2, 4, 6, and 8, which represent high-challenge/high-skill, low-challenge/high-skill, low-challenge/low-skill, and high-challenge/low-skill, respectively.
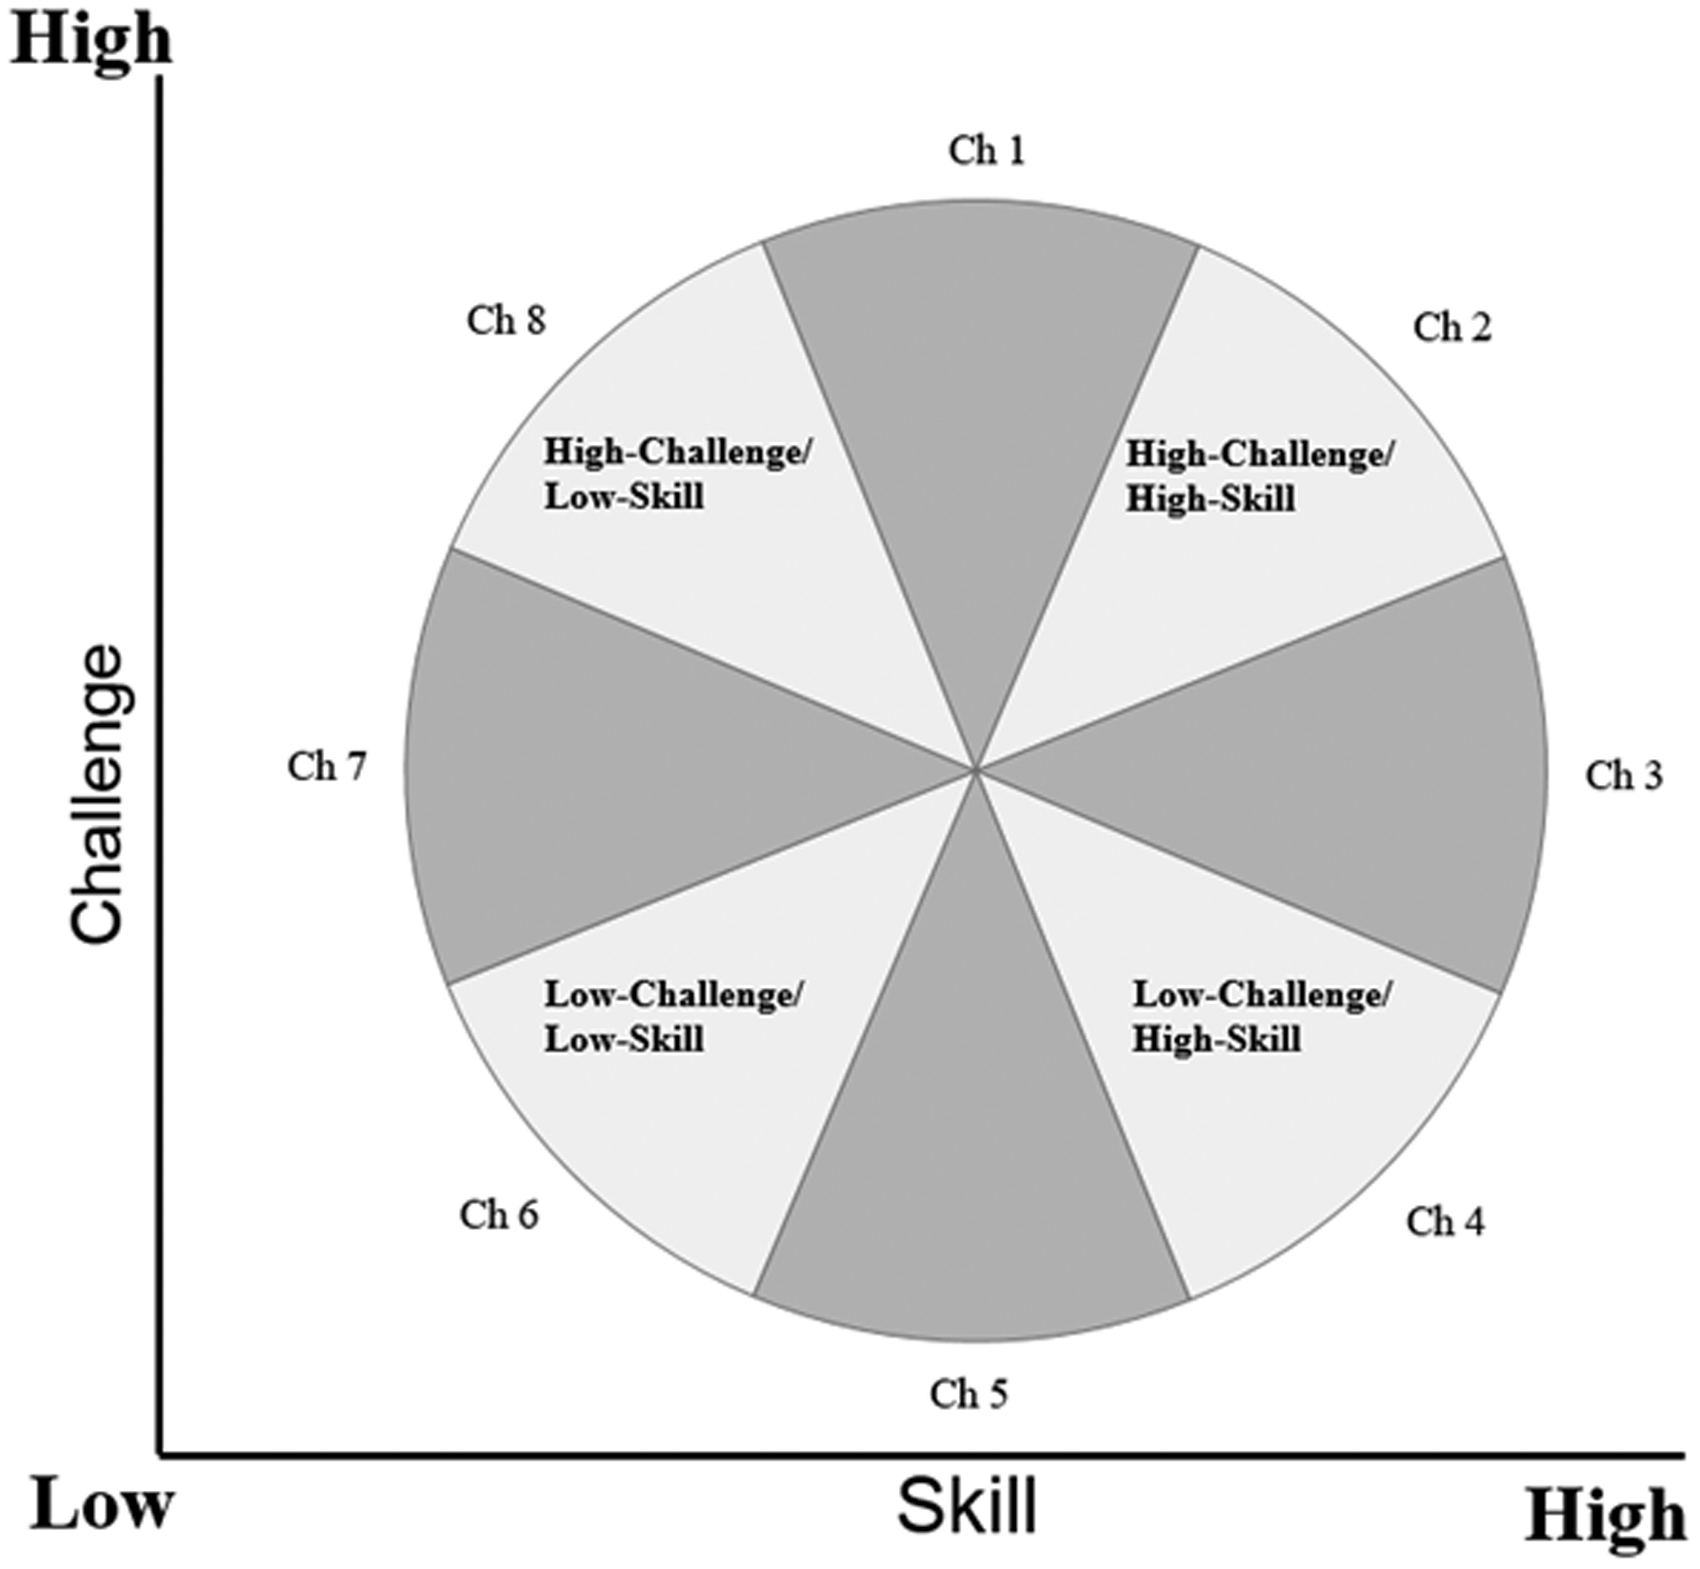
The Four Balance of Challenge and Skill (BCS) Pairs Designed for This Study. Adapted from Csikszentmihalyi (1997) and Massimini and Carli (1988).
First, the students’ skill levels were determined using the written skill test before the experiment. In particular, the test was designed to measure student’s science proficiency through questions regarding various topics, such as those of the moon, sun, aquatic life, and plants, stipulated in the National Curriculum Guidelines (Ministry of Education, Taiwan, 2003). Students whose scores were higher than average were designated as “high-skill,” while students who scored lower than average were designated as “low-skill.”
Afterward, the computerized challenge test, which contains 30 items selected from the Trends in International Mathematics and Science Study (TIMSS) 2011 with varying levels of difficulty, was developed and established as the performance task to provide different challenge levels for the students during the EEG measurement. A sample item from the test is shown in Figure 2. Students were asked to complete the test in 30 min, with 1 min allotted for each item. For each student, the order of the questions appeared randomly. The challenge level of each test item was represented by the mean of difficulty index from the data of Taiwanese and international students published in the TIMSS 2011 report. Then, items lower than the median of all 30 items were designated as “high-challenge test items” and “low-challenge test items” for the opposite.

A Sample Test Item for Students’ Performance Evaluation (The third answer is correct. The texts are translated into English).
Students’ Sense of Control
In line with previous studies (Baronas & Reis, 1988; Skinner & Greene, 2008), this study used a student’s performance in the aforementioned written skill test as the indicator of his or her sense of control. Each student’s answer for each item was recorded as correct or incorrect, which was then labeled as the real-time momentary test performance (MOM-tp) to represent the student’s short-term sense of control. After the test, the total number of correct items was labeled as the overall test performance (OA-tp) of each student. Then, the OA-tp was used to classify the 30 students into groups with a high and low long-term sense of control.
Self-Reported Reflective Flow Experience
The present study developed the self-reported reflective flow experience (SR-F) scale, a 5-level Likert item that includes 10 questions (from strongly disagree = 1 point to strongly agree = 5 points), mainly based on Chen’s (2006) flow test instrument, a Likert nine-level type test with eight dimensions of flow and a Cronbach’s alpha value of .84. The higher the overall test performance, the stronger the flow experienced by the subject. Immediately after students complete the 30 min experiment, the SR-F was administered, with the average score used to divide all 30 students into high- and low- SR-F groups. With a Cronbach’s alpha value of .80 (N = 30), the SR-F shows high reliability according to the rule of thumb explaining alpha (George & Mallery, 2003).
EEG-Detected Real-Time Flow State
The study used the NeuroSky headset (see Figure 3; NeuroSky Inc., San Jose, USA), as adopted in other studies (e.g., Liao et al., 2019; Yang et al., 2019), which records raw data through a single dry sensor that allows the measurement, amplification, filtering, and analysis of brainwaves. This headset was used in contact with the participant’s dorsolateral prefrontal cortex region (Fp1), as this location is ideal for measuring the higher cognitive processes of a person’s mental activity. The electrical potential from the raw data of brainwaves is supplied directly for analog filtering with 512 KHz digital sampling every second. Using their own algorithm and definitions, the electronic signals were converted to eSense indices and the power spectral density of eight frequency bands through the EEG monitor and feedback system.
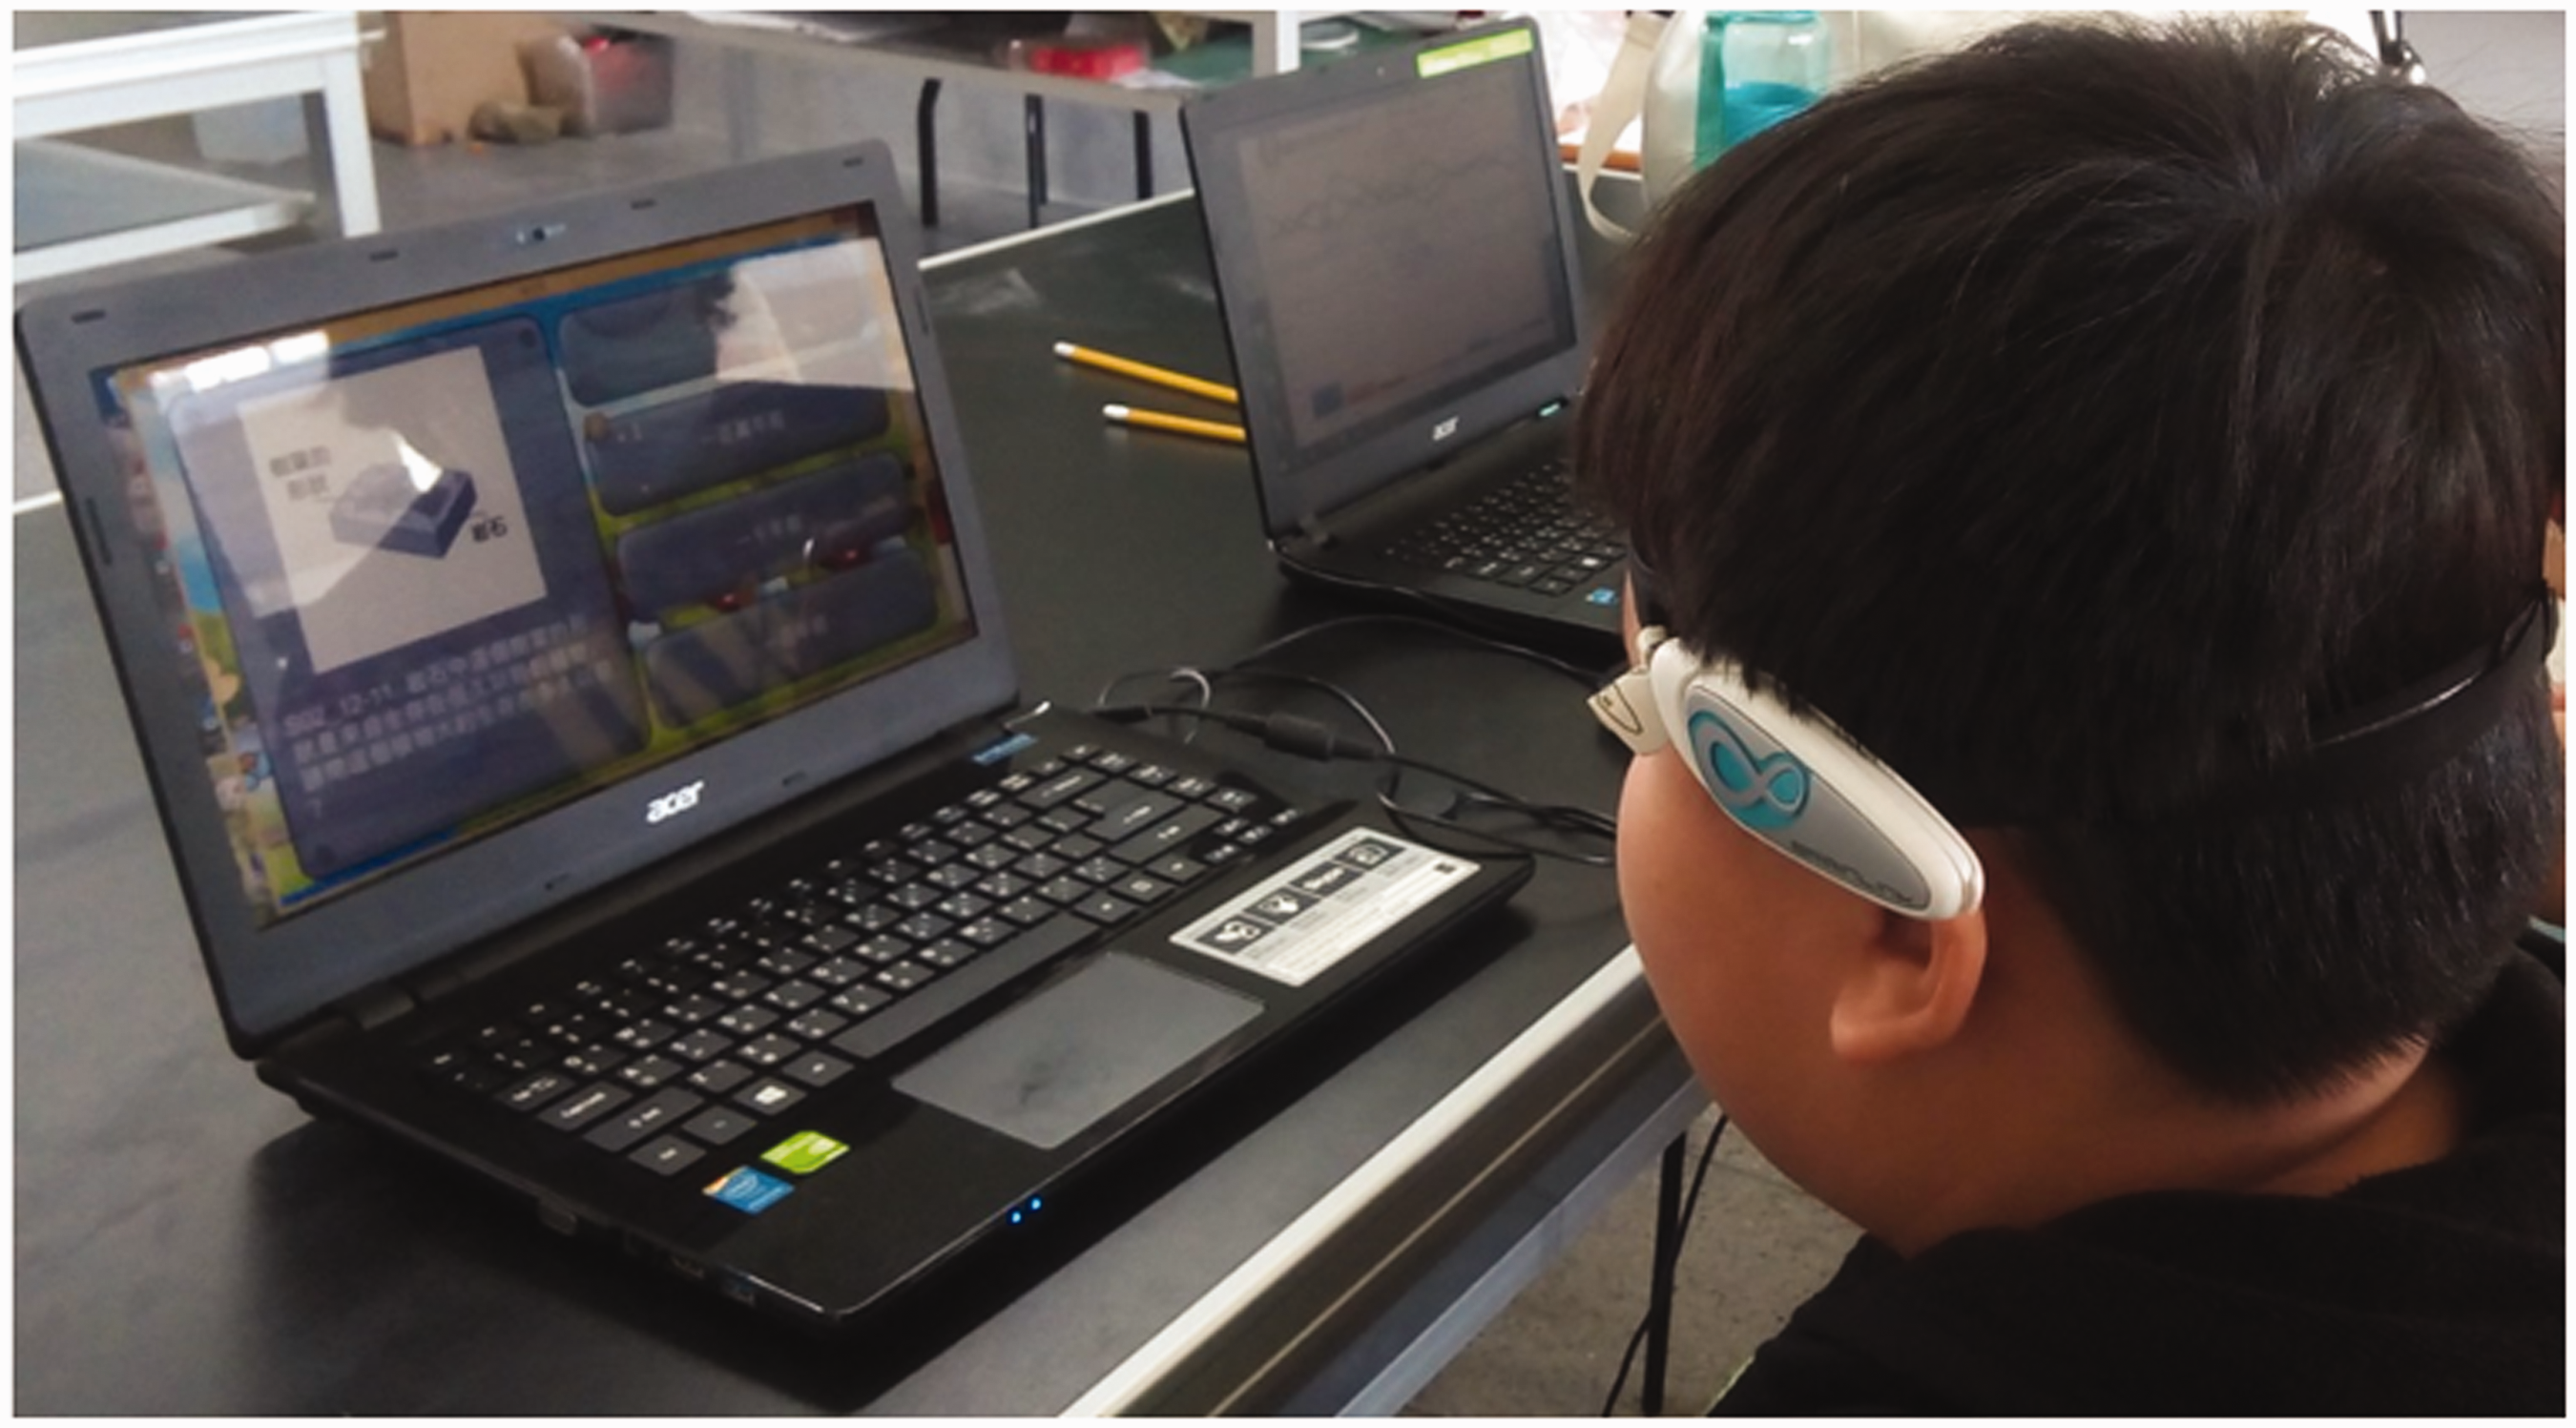
Students’ Electroencephalogram (EEG) Wave Bands Were Collected While Working on Test Items.
To indicate the intensity of mental “focus” or “attention,” this study collected the values ranging from 0 to 100 from the attention meter, one of the eSense-provided indices. Here, attention level increases when a user focuses on a single thought or an external object, and decreases when distracted (Bos et al., 2019; Chen & Huang, 2014; Yang et al., 2019).
As to the values of engagement level, however, eSense did not provide engagement value to be readily used. This study, thus, referring to Liao et al.’s (2019), calculated the values of power spectral density for its eight frequency bands: Delta (1–3 Hz), Theta (4–7 Hz), Low Alpha (8–9 Hz), High Alpha (10–12 Hz), Low Beta (13–17 Hz), High Beta (18–30 Hz), Low Gamma (31–40 Hz), High Gamma (41–50 Hz). These values have no units and constitute meaning only when compared. However, they indicate whether each particular band is increasing or decreasing over time, and how strong each band is relative to the other bands. Because the values of EEG wave bands vary exponentially, linearization of logarithmization of the eight frequency bands was performed, and all logarithmic values were normalized, transferring all of them into T-score for comparison. The converted value of β/(θ + α) was used to represent the engagement index (Eldenfria & Al-Samarraie, 2019; Pope et al., 1995; Prinzel et al., 2000).
This study processed EEG data by a) calculating the average values of attention and EEG power during the time period when answering each question. Thus, 900 sets of data were obtained (30 questions × 30 people); and b) using the average values as the cutting point, statuses of students working on each test item could be divided into high and low engagement. Similarly, high and low attention could be identified. Given this, in line with previous studies, this study defines a student working on a test item with high engagement and high attention as having in-flow experience by EEG (in-EEG-F); the rest as non-flow experience by EEG (non-EEG-F).
Data Analyses
Considering the outcome variables, e.g., flow state, and many key predictor variables (BCS and momentary test performance), are ordinal, the study transforms all other numeric variables into ordinal ones for better illustration. The chi-squared (χ2) test of independence for association was used for answering RQ1; while the J48 decision tree and logistic regression, for RQ2. For the statistical analysis, the SPSS 20.0 software (SPSS Inc., Chicago, IL, USA) and Microsoft Excel statistics software and WEKA ver. 3.8 (Waikato Environment for Knowledge Analysis) data mining software were used.
RQ1: Chi-Squared Test of Independence for Association
The chi-squared (χ2) test of independence for association was used to examine the associations among students’ flow state and other predictor variables, i.e., SR-F, GL, BCS, OA-tp, and MOM-tp. A smaller p-value means that the variable is more likely to be associated with the difference in distribution. If the chi-square showed a significant difference for a predictor variable that has more than two levels, i.e., BCS having four, the adjusted residuals will serve as indicators in detecting the significant difference among levels.
RQ2: Decision Tree for Classification Model and Logistic Regression
The data, i.e., SR-F, BCS, OA-tp, and MOM-tp, are represented with a decision tree, which consists of decision nodes, branches, and leaves and reveals the tree structure of the decision set to answer RQ2. The top node in the decision tree is the root node, and each branch is a new decision node or a leaf of the tree, where each decision node represents a decision and often corresponds to the attributes of the object to be classified; each leaf node, a possible classification result. During the process of traversing the decision tree from top to bottom, a test will be encountered at each node. The different test output of the decision on each node results in different branches and will finally reach a leaf node. There are always two numbers in parentheses (e.g., “(x/y)”) under each leaf, which represents that there are y miscategorized cases of x tries. The categorization of the decision tree was evaluated with tenfold cross-validation, and measures including TP rate, FP rate, precision, recall, F-measure, Matthews correlation coefficient, ROC area, PRC area (the precision recall area under curve) were reported (Powers, 2011).
This study used the logistic regression technique because although the decision tree may reveal informative information such as the node, split, and branches, it did not provide statistical significance tests and odds ratios (ORs) for a deeper understanding of the construct. Hence, the logistic regression model was used to calculate predicted probabilities at specific values of a key predictor, frequently when holding all other predictors constant. The OR is the ratio of the odds of an event occurring in one group to the odds of those occurring in another group.
Results
Factors Associated With the Flow State: Chi-Squared Test of Independence for Association
Table 1 shows the contingency table, which demonstrates frequency and percentage for EEG-F by predictor variables: SR-F, GL, BCS, OA-tp, and MOM-tp and is used to answer RQ1. The adjusted residues for the BCS and those significant predictor variables are also marked. Among 900 test events, 602 (66.9%) were identified as non-EEG-F; while 298 (33.1%), in-EEG-F wherein students’ attention and engagement while completing a test item measured from EEG are both in a high level. Furthermore, the chi-squared test of independence for association demonstrated students’ grade level did not show a significant association with their flow state (χ2 (1, N = 900) = 0.983, p = 0.357 > .05). However, there were significant correlations among students’ flow state and BCS (χ2 (1, N = 900) = 3.933, p = .047 < .05), SR-F (χ2 (1, N = 900) = 13.566, p < .05), overall test performance (χ2 (1, N = 900) = 11.675, p = .001 < .05), and momentary test performance (χ2 (1, N = 900) = 15.733, p = .000 < .05). For the BCS with four levels, further adjusted residuals were calculated and showed significantly higher percentage of appearance of in-EEG-F in L-c/H-s (adj. resid. = 3.5) and significantly lower percentage of appearance of in-EEG-F in H-c/L-s (adj. resid. = 3.4) when compared with the other two groups.
Contingency Table for EEG-Detected Real-Time Flow State (EEG-F) by Predictor Variables.
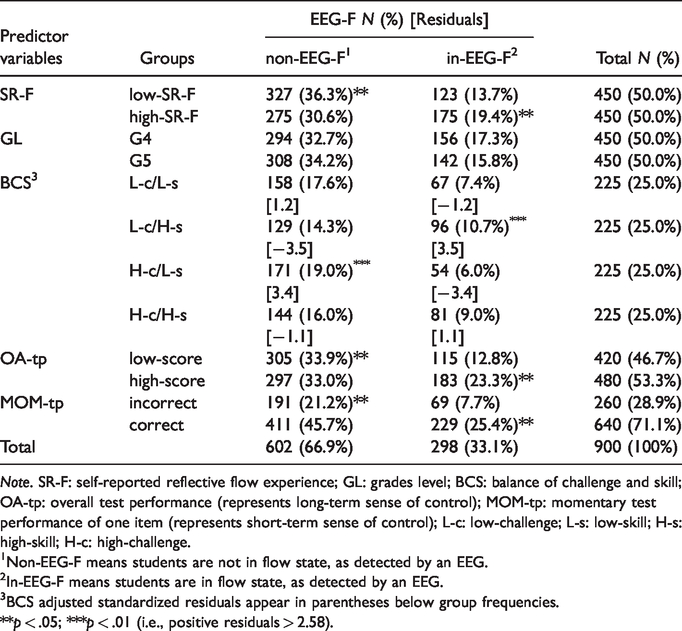
Note. SR-F: self-reported reflective flow experience; GL: grades level; BCS: balance of challenge and skill; OA-tp: overall test performance (represents long-term sense of control); MOM-tp: momentary test performance of one item (represents short-term sense of control); L-c: low-challenge; L-s: low-skill; H-s: high-skill; H-c: high-challenge.
1Non-EEG-F means students are not in flow state, as detected by an EEG.
2In-EEG-F means students are in flow state, as detected by an EEG.
3BCS adjusted standardized residuals appear in parentheses below group frequencies.
**p < .05; ***p < .01 (i.e., positive residuals > 2.58).
Thus, results from the chi-squared test of independence show that EEG-F has a significant correlation with students’ BCS, SR-F, overall test performance, and momentary test performance. This finding reinforces that those significant factors are adequate to be included in the subsequent analysis for establishing the construct of students’ flow state.
The Construct of Flow State: Decision Tree and Logistic Regression
The classifiers.trees.J48 of WEKA was used for data mining the relationship among SR-F, BCS, OA-tp, and MOM-tp to answer RQ2. Figure 4 illustrates the classifier mode for EEG-F (in- vs. non-EEG-F) in which SR-F is the parent node (Node 1). The classifications results are reported as follows:
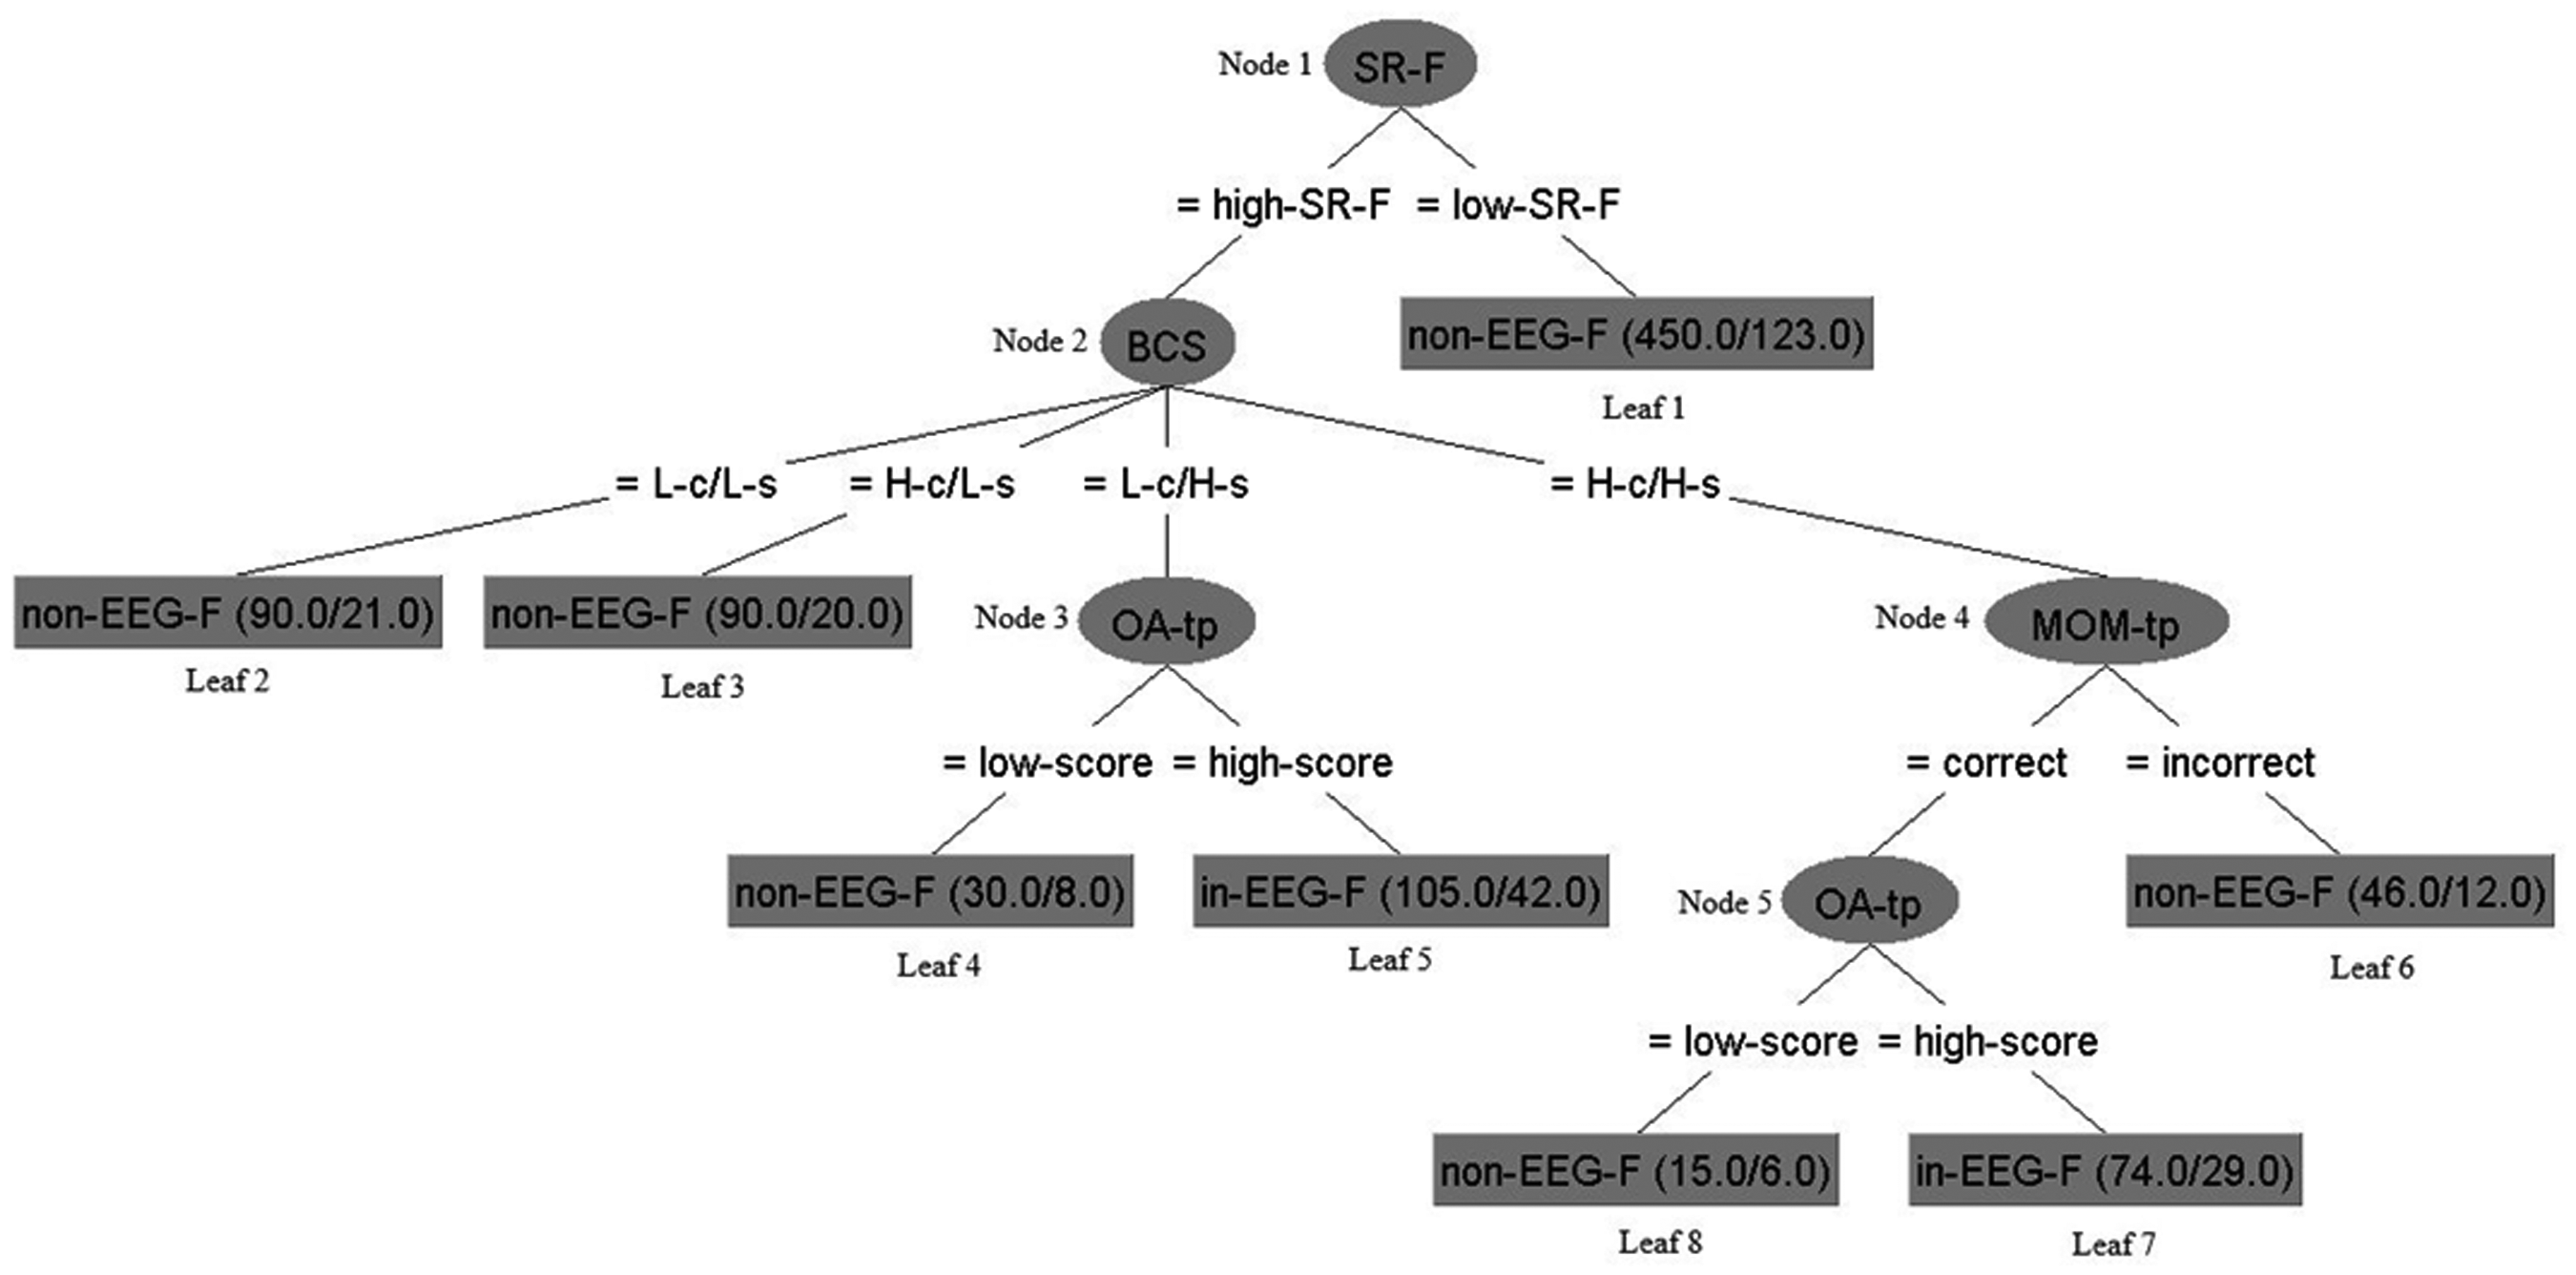
The Tree View of the Model for EEG-F Classified With J48 Decision Tree.
Node 1 simply divided the sample into high- and low-SR-F as Leaf 1, respectively. Leaf 1 showed that students reported to have low-SR-F were often exhibited as non-EEG-F (total instances: 450.0/incorrectly instances: 123.0). This showed that students’ self-reported reflective flow experience affects their flow experience. The real-time physiological EEG measurement frequently detects the existence of the non-flow experience during the span of the test when students reflectively felt that they did not have flow experience during the activities. On the other hand, the four BCS conditions (i.e., L-c/L-s, H-c/L-s, L-c/H-s, and H-c/H-s) are likely to yield students’ EEG-F states when students reported out high-SR-F (as in Node 2). Moreover, for H-c/L-s (Node 3) and L-c/H-s (Node 4), students’ EEG-F states were affected by their sense of control (test performance). Noteworthily, to H-c/L-s (Node 3), students with high OA-tp (high long-term sense of control) were likely to result in the in-EEG-F state (105.0/42.0), while to the L-c/H-s (Node 4), MOM-tp and OA-tp (i.e., long-term and short-term sense of control) might affect achieving flow state.
The validity of the classification was examined with tenfold cross-validation. Results of the quality evaluation of the classification demonstrated that the classifier has adequate validity and the model is acceptable (TP rate: 0.708, FP rate: 0.467, precision: 0.690, recall: 0.708, F-measure: 0.685, Matthews correlation coefficient: 0.283, ROC area: 0.593, PRC area: 0.616).
Logistic Regression
Logistic regression is implemented to further obtain the OR of contrasting conditions represented in the leaves, allowing the study to determine the extent to which the relevant factors contribute to the construct as stated in RQ2. For this, logistic regression was used to test each of the five nodes shown in the previous resulting decision tree. Table 2 displays the results of the logistic regression analyses. For instance, Node 1 (SR-F) illustrates that the OR of the high-SR-F group vs. low-SR-F group was 1.7, a significant difference (p < .001). This represents that the high-SR-F group will more likely reach in-EEG-F than the low-SR-F group with a 1.7 OR. Among all nodes, only Node 5 (OA-tp), which is with high-SR-F, H-c/H-s, and high MOM-tp condition, appeared as nonsignificant (p = .139), urging the study to drop the node from the final construct. Figure 5 in the next section further illustrates the final construct of flow.
Summary of Logistic Regression Analysis Predicting EEG-Detected Real-Time Flow State (EEG-F).
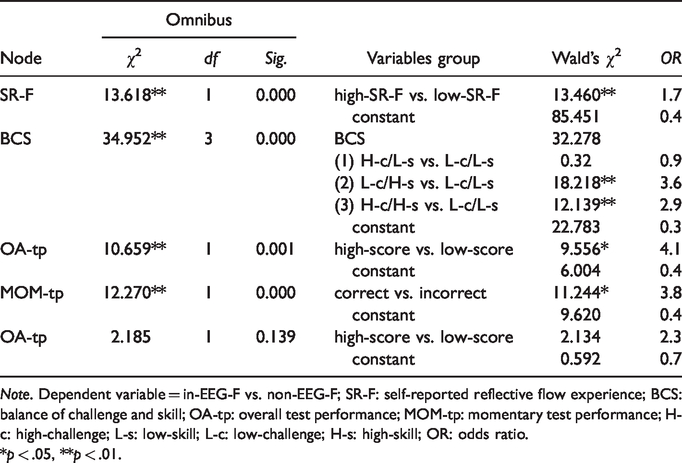
Note. Dependent variable = in-EEG-F vs. non-EEG-F; SR-F: self-reported reflective flow experience; BCS: balance of challenge and skill; OA-tp: overall test performance; MOM-tp: momentary test performance; H-c: high-challenge; L-s: low-skill; L-c: low-challenge; H-s: high-skill; OR: odds ratio.
*p < .05, **p < .01.

The Construct of Predicting Students’ Flow State Measured With Electroencephalogram (EEG).
Discussion and Conclusions
Grounded in the flow theory, in an e-learning environment with flow conditions (clear goals and immediate feedback), this study explored how the EEG-F was affected by the BCS, SR-F, overall test performance, and momentary test performance. Results of chi-square, decision tree, and logistics regression analyses proved that EEG-F, defined in this study as high attention and engagement, can be a valid and potential method for detecting students’ flow experience. Findings also support Shrivastava and Tcheslavski’s (2018) claim that human “EEG may have considerable potential for use in biometric” (p. 61). Moreover, the techniques of measuring students’ flow state developed in the present study advance previous ones, which mainly measured partial constituent/relative factors, such as attention (Bos et al., 2019; Chen & Huang, 2014; Csikszentmihalyi, 1990; Rebolledo-Mendez et al., 2009), engagement (Csikszentmihalyi, 1990; Eldenfria & Al-Samarraie, 2019; O’Brien & Toms, 2008; Pope et al., 1995), motivation (Derbali & Frasson, 2010), and so on. It is also notable that the present techniques advanced previous methods, which relied on more sophisticated equipment, such as whole-scalp, 64-channel EEG array electrodes (Katahira et al., 2018), which are not applicable in real learning settings.
Furthermore, in response to RQ1, results showed that using EEG to detect students’ flow state significantly associates with factors of SR-F, GL, BCS, OA-tp, and MOM-tp. These findings are compatible with the flow theory (Csikszentmihalyi, 1990) and other studies that reported the flow state being affected by or predicable from factors including the BCS (Csikszentmihalyi, 1990; Massimini & Carli, 1988), SR-F (Chen, 2006) and students’ sense of control (Baronas & Reis, 1988; Rodríguez‐Ardura & Meseguer‐Artola, 2017; Skinner & Greene, 2008), hence supporting the validity of the study’s defined EEG indicator.
With regard to RQ2 relating to the way and the extent that those factors contribute to students’ flow state, results showed that the construct is a trimmed representation from the decision tree to which only elements also demonstrated statistical significance in the logistic regression was left for these were supported by two different statistical analyses.
Here, the study synthesized the findings from the decision tree classification and ORs from the logistic regression analysis to present the construct of students’ flow state with a more holistic observation as Figure 5, which is a construct of flow of size 11 with 4 attributes, 7 leaves, and 10 branches to which their ORs was displayed.
The resulting construct of flow state measured with EEG consisted of three levels: the SR-F, BCS, and sense of control (OA-tp and MOM-tp). The first (top) level having the root node (Node 1: SR-F) divided the sample into high-, and low-SR-F with ORs of 1.7 vs. 1.0. The results of the association of EEG-measured and self-reported flow states advance previous understandings (Rebolledo-Mendez et al. 2009; Wang & Hsu; 2014), which only identified the association of EEG-measured attention and self-reported flow states. Moreover, this indicated that students’ self-reported reflective written questionnaire of flow state is a vital factor corresponding to the EEG-F detected state. This data provides evidence in twofold: 1) The comparability between the existing written questionnaire and the EEG measurement further supports the EEG measurement established in the present study having adequate criterion-related validity; and 2) The higher OR of the high-SR-F group revealed the importance of students’ self-perception on learning positive affecting their real-time EEG detected flow state. This also suggests that students’ momentary flow state, obtained from EEG, corresponds to their reflective overall flow state. It implies that learning activities should aim to intrigue students’ momentary flow experiences throughout the whole learning process to enable them to have a reflective self-satisfaction of flow experience. Thus, this finding helps provide empirical evidence of the whole-part association existing in the measurement of flow state, which has not been reported before.
At the second level of the construct, it includes Node 2 (BCS), which echoed Csikszentmihalyi’s (1990) position that the balance of challenge and skill plays a crucial role in determining whether students experience flow state or not. The construct demonstrates that four types of BCS (from left to right in the construct; L-c/L-s, H-c/L-s, L-c/H-s, and H-c/H-s) correspond to Csikszentmihalyi’s (1997) four channels of his eight-channel model, channels 6 “apathy,” 8 “anxiety,” 4 “relaxation,” and 2 “flow” with ORs of 1.0, 0.9, 3.6, and 2.9, respectively when students are high-SR-F. This highlights that when high-skill students face either low- or high-challenge, they will more likely reach flow state than low-skill students with a 3.6 or 2.9 OR, which might result from their inherited personal characteristics in facilitating persistence (Israel-Fishelson & Hershkovitz, 2019) or other factors that need further exploration. However, these findings support Csikszentmihalyi (1997) and Csikszentmihalyi et al.’s (2014) proposition, and advance the knowledge on the extent of the likelihood of achieving flow state in different combinations of challenge and skill. Noteworthily, the high OR found in the low-challenge and high-skill group is different from what was addressed in many previous studies (Csikszentmihalyi 1997; Massimini & Carli, 1988; Wang & Hsu, 2014) that this is not an optimal state of flow. To this discrepancy, other studies supported the present study’s findings by highlighting that performing low-challenge tasks might lead to the flow state (Tse et al., 2018). The present study further demonstrated that the relaxation state could also be in the flow state.
Moreover, the third level extends the understanding of how sense of control plays a role in the construct of flow state. When in low-challenge and high-skill state, the high long-term sense of control, represented with OA-tp, will more likely achieve the flow state than its counterpart with a 4.1 OR. On the other hand, in high-challenge and high-skill state, the high short-term sense of control, represented with MOM-tp, takes control and will more likely achieve the flow state with a 3.8 OR than its counterpart. This indicates that sense of control also plays a crucial role in determining whether or not students experience flow state. The findings support the claim that this is one of the factors for achieving flow experience (Baronas & Reis, 1988; Csikszentmihalyi, 1990; Rodríguez-Ardura & Meseguer‐Artola, 2017; Skinner & Greene, 2008). Moreover, the present study further identified how long-term and short-term sense of control (OA-tp and MOM-tp) affect different students, which has not been explored and reported.
Hence, results of the study reinforce that the EEG-F could well represent the presence of students’ real-time flow experience and be used in detecting students’ flow experience in e-learning, which was difficult to attain before. Given this, the current study addresses the gaps in the research of measuring flow states by improved methods. Moreover, findings on the model of flow experience and the technique of measuring students’ flow experience can be used in the creation of e-learning and e-evaluation systems that can help improve students’ learning. For example, these could be paired up with a brain-computer interface (BCI) to design e-learning and e-evaluation systems with artificial intelligence. Detecting real-time flow state and adjusting the BCS dynamically would highly likely facilitate students’ learning motivation and their performances. Thus, the current study has potential contributions to innovations and research about e-learning.
Despite several important findings, the current study has some limitations. First, because it is exploratory in nature, and the EEG experiment restricted the use of a large sample, the study’s results and findings should not be overinterpreted. Thus, the sample size and study design can still be expanded. Future research should also consider increasing the number of participants, using multivariable design, and classifying more levels for each factor to obtain more relevant findings. Second, although this study used TIMSS 2011 items and its percent properly represents a challenge level in this computerized test, its validity can still be strengthened. Third, although this study successfully revealed that students’ EEG-F can be classified and that students in the particular classifications demonstrate in flow state when measured with EEG, which have substantial implications in incorporating flow and EEG in E-learning, teachers and professional practitioners need to note that combining both flow and EEG is a complex process, especially that the algorithm of single-channel portable EEG is too hidden. Therefore, more studies are needed to provide more evidence and produce further accessible and reliable designs both in devices and algorithms.
Footnotes
Acknowledgments
We thank Distinguished Professor Chih-Ming Chen at National Chengchi University, Taiwan, for his invaluable advices and suggestions regarding the conceptualization and data collection. We also thank students who participated in the study, as well as the staff and teachers for kindly supporting the work.
Declaration of Conflicting Interests
The authors declared no potential conflicts of interest with respect to the research, authorship, and/or publication of this article.
Funding
The authors disclosed receipt of the following financial support for the research, authorship, and/or publication of this article: This work was supported by Ministry of Science and Technology, Taiwan (MOST 106-2511-S-152-005-MY2 and MOST 108-2511-H-152-013-MY3).
