
Abstract
Emerging research suggests that planners and policy makers should explore the expanded role Transit-Oriented Development (TOD) plays in promoting innovation and economic growth. TOD station characteristics including accessibility, walkability, density, and mixed uses may create environments beneficial for creative and knowledge industries. However, the evidence linking place to productivity, as measured by firm sales volume is lacking. Using cluster analysis and Propensity Score Matching for national-level data, this research tests these relationships. Findings indicate that firms located in dense, mixed use, and walkable TODs with higher levels of activity experience increased sales. Hence, TOD and knowledge-based economic development strategies should be planned in tandem to maximize outcomes.
Introduction
Transit-Oriented Developments (TODs) are presumed to contribute to the economic vitality of neighborhoods and cities (Renne 2005). However, apart from empirical evidence measuring the impact of stations on surrounding property values, research testing the relationship between TODs and broader economic development outcomes is still emerging (Nelson, Miller, Eskic, et al. 2015). Recent scholarship suggests that TODs are key to economic development by attracting creative and knowledge-based firms and workers as well as generating job growth in these sectors (Belzer et al. 2011; Nelson, Miller, Eskic, et al. 2015). Moreover, unlike the prerecession and recession eras, jobs in TODs increased during the post–Great Recession recovery, which indicates that TODs might also be key to economic resilience (Nelson, Miller, Eskic, et al. 2015).
TODs potentially attract workers, households, and firms and provide greater accessibility to markets while creating dense, mixed-use built environments (Nelson, Miller, Eskic, et al. 2015). TODs therefore may catalyze agglomeration dynamics leading to enhanced learning, innovation, and productivity across industry clusters (Chatman and Noland 2011). Furthermore, these impacts are particularly important to knowledge and creative industries, which are key drivers in the knowledge economy. Like other clusters, creative and knowledge firms tend to colocate to benefit from larger markets, thick and specialized labor pools. In addition, knowledge and innovation spillovers made possible through networking opportunities, spur industry growth and productivity (Scott 2000).
Knowledge intensive, creative firms and workers are particularly drawn to cities, because of their social and economic diversity, urban environments, and high-quality amenities (Florida 2002). Diverse, mixed-use developments enabling the copresence of innovative anchors, incubators, and start-ups as well as walkability and third places are considered vital for networking, knowledge exchange, and innovation spillovers (Katz and Wagner 2014). The attractiveness and “authenticity” of a place is also assumed to provide the right creative milieu and buzz (Coll-Martínez and Arauzo-Carod 2017; Currid and Williams 2010; Silver 2012).
TODs, often characterized by walkability, mixed uses, and accessibility to regional markets, would seem to provide built environments that best support innovation and productivity for creative and knowledge firms. Indeed, recent empirical evidence supports this hypothesis. Drawing on the Small Business Innovation Research (SBIR) database, scholars found more award-winning innovations were developed in dense, mixed-use, and walkable neighborhoods (and regions) that also benefit from high-quality transit service (Hamidi and Zandiatashbar 2017a, 2017b, 2018; Hamidi, Zandiatashbar, and Bonakdar 2018; Zandiatashbar and Hamidi 2018). However, despite the popularity of policies focused on creative placemaking, there remains less than conclusive evidence tying the above place-based characteristics of TODs with the attraction of creative and knowledge-based industries, much less how the built environment impacts firm productivity (Evans 2009).
Using national data sets on industry and transit station characteristics, this article addresses this gap by exploring the relationship between TOD built environments and creative and knowledge industry firm productivity, as measured by sales volume. Using cluster analysis, we create a typology of transit station areas differentiating TODs from other transit station development types. We then use propensity score matching (PSM) to create paired matches of firms located within a transit area. The PSM includes indicators for the agglomerative forces and firm characteristics denoting a combination of the firm’s inputs according to the production function framework in which sales volume represents the firm’s productivity (Aigner and Chu 1968). This allows us to estimate the average treatment effect (ATE) of TOD station area type on firm productivity after the PSM controls for firm inputs. The results suggest that dense, diverse TODs positively impact creative and knowledge firm sales volume. The paper concludes with a discussion regarding how planners can integrate land-use regulations and policies that support TOD with placemaking and knowledge-led economic development strategies to maximize economic benefits.
What Is a TOD?
Many U.S. cities and regions are turning to TOD as a key smart growth strategy (Dill 2008). As a result, planners use specific policies and land-use regulations to cultivate or shape TODs such as mixed-use zoning (Grant 2002), density bonuses (Freilich 1998), performance zoning, interim zoning, floating zones, minimum density classifications (Cervero, Ferrell, and Murphy 2002; Gabbe 2016), planned unit developments, transfer of development rights (White and McDaniel 1999), and adaptive reuse (Riggs and Chamberlain 2018). However, not every development in a transit station area can be characterized as a TOD (Kamruzzaman et al. 2014; Renne and Ewing 2013). Scholars define TODs as compact neighborhoods centered around transit with efficient land use diversity, density, street connectivity, and walkability that encourage residents, workers, and customers to ride mass transit more than driving their cars. Therefore, residential and employment density (Cervero and Gorham 1995; Kamruzzaman et al. 2014; Pollack et al. 2014; Renne and Ewing 2013), land use diversity (Cervero and Gorham 1995; Kamruzzaman et al. 2014; Renne and Ewing 2013; Vale 2015), and walkability or street connectivity (B. Brown and Werner 2011; Renne and Ewing 2013; Vale 2015; Werner, Brown and Gallimore 2010) have become the most frequently utilized factors for classifying station types.
In the only existing national study categorizing transit station area developments, Renne and Ewing (2013) classified rail station areas into three categories of TOD, Hybrids, and Transit Adjacent Developments (TADs). They adopted a “minimum benchmark definition of TOD” approach and utilized a point-based system to measure density, land use diversity, and walkability in 0.5-mile Euclidean distance buffer for stations. Accordingly, density parameter receives 1 point if the station precinct has greater than thirty jobs or residents per gross acre; diversity parameter receives 1 point if the station precinct does not have 100 percent of its land uses as either residential or commercial; and last, the walkability parameter receives one point if the station precinct average block size is less than 6.5 acres. Summing these points, TAD = 0 or 1 point, Hybrid = 2 points, and TOD = 3 points. Using another scoring method, Pollack et al. (2014) found four groups of Transit-Oriented, Transit-Supportive, Transit-Related, and Transit-Adjacent areas.
Addressing the shortcomings of point-based scoring methodology, later studies began utilizing cluster analysis as a more systematic and objective approach. Kamruzzaman et al. (2014) used a two-stage cluster analysis and included residential and employment density, public transport accessibility levels, land use diversity, and street connectivity measured through intersection density and cul-de-sac density. They identified five types of station neighborhoods—urban TODs, activity center TODs, potential TODs, TADs, and traditional suburbs. Vale (2015) used six place-index measurements including residential density, employment density by four sectors, and degree of functional mix and seven node-index measurements. He employed cluster analysis in identifying six station area types including urban TODs, balanced TADs, suburban TODs, undersupplied transit TODs, unbalanced TODs, and future TODs. Using cluster analysis, Scheer et al. (2017) also classified station area types based on three built-environment factors—density, land use diversity, and walkability into three groups including TOD, Hybrid, and TAD. Using a half-mile network distance catchment area within eight U.S. regions, Scheer et al. (2017) found 107 stations to be TAD, 382 were Hybrid, and only sixty were TOD.
Our work, therefore, contributes to this area of research in several ways. First, most studies of this kind cover only one or a few regions (i.e., Kamruzzaman et al. 2014; Scheer et al. 2017; Vale 2015), while our research includes all stations in the United States. Second, we employ cluster analysis, which has clear advantages over a scoring methodology (i.e., Pollack et al. 2014; Renne and Ewing 2013). Third, existing studies mainly rely on straight-line catchment areas versus network distance from each station (i.e., Renne and Ewing 2013; Vale 2015). To address this gap, our analysis uses network distance, which unlike straight-line distance, uses the street network to identify a catchment area. Similar to several previous studies, we also use built environmental measures which can determine the travel behavior of residents (Handy, Cao, and Mokhtarian 2005), thereby creating more direct implications for planning practice (Scheer et al. 2017).
Economic Developments Outcomes of TODs
TOD is theorized to impact economic outcomes through regional productivity and resilience, agglomeration economies, and localized property market impacts (Banister 2012). A significant amount of research has focused on the latter with scholars exploring TOD’s impact on residential housing prices and to a lesser extent, commercial real estate values (Golub, Guhathakurta, and Sollapuram 2012). However, this impact varies by city-region (Hamidi et al. 2016; Mohammad et al. 2013). In Dallas, home values rose by 32 percent when located within one-quarter mile of a Dallas Area Rapid Transit (DART) station, while values only climbed 2.5 percent in Buffalo MetroRail areas using the same proximate distance (Garrett 2004; Hess and Almeida 2007).
In addition, TODs function as critical nodes in regions (Bertolini and Spit 2005) and aid in balancing jobs and housing across a metro area (Cervero 1989). TOD is also found to support regional resilience (Martin 2011; Nelson, Miller, Eskic, et al. 2015). Nelson, Miller, Eskic, et al. (2015) and Nelson, Miller, Ganning, et al. (2015), for instance, found evidence that metropolitan areas with Light Rail Transit (LRT) systems were more resilient during the Great Recession and experienced greater gains after the recession compared with the nation as a whole.
Recently, scholars have focused on TOD’s relationship with agglomeration economies. Starting with Marshall (1890), it has long been understood that clustering benefits firms through “external economies of scale,” as a result of shared labor pools, specialized suppliers, and common infrastructure. It is likely that TOD developments support these dynamics by attracting households, workers, and firms in close proximity to one another. TODs could increase local diversity and density of firms, enlarge access to markets, reduce transportation costs, and increase an area’s human capital (Chatman and Noland 2011). TODs could also generate further benefits by enabling efficient matching of jobs and skills leading to less employee turnover and termination rates (Chatman and Noland 2011, 2014; Chatman, Noland, and Klein 2016; Credit 2018b).
TODs may offer further advantages to industry clusters through place-based characteristics. Porter (1990), Storper (1993), and Scott (2000), among others, have built on agglomeration theory to analyze clusters as dynamic, concentrated sites of competitive yet complementary industries. Specifically, they have emphasized the importance of social relations made possible through geographic proximity. Colocation enables networking, tacit knowledge exchange, and trust building which gives firms competitive advantage by quickly accessing new technologies and industry strategies (Gertler 2003; Hardwick, Anderson, and Cruickshank 2013; Howells 2002; Inkpen and Tsang 2005; Porter 2000; Scott and Storper 2003). Location is particularly important to knowledge and creative industries (Clare 2013; Florida 2002; Grodach et al. 2014; Murdoch, Grodach, and Foster 2016). Creative and knowledge industries rely on a rich ecosystem of large firms, SMEs (Small and Medium Enterprises), and freelancers, characterized by intense networking and collaboration (Comunian 2011; Dovey et al. 2016). As workers thrive in buzzy, creative environments, scholars argue that these industries prefer places with walkability, mixed uses, third places, and particular aesthetic qualities to support sociality (J. Brown 2017; Clare 2013; Drake 2003; Durmaz 2015; Smit 2011).
As TODs are more spatially bounded through dense street networks and often include mixed-use zoning incorporating spaces for consumption, professional services, and aesthetic enhancements, they may be well-positioned to attract creative and knowledge economy workers and support high-quality networking. There is some evidence to support this as scholars have found a positive relationship between transit stations, transit use, and networking (Chatman and Noland 2011; Murphy 2000). Also, TODs have been found to attract knowledge, creative, service, and retail firms relative to firm start-ups in other areas (Belzer et al. 2011). Credit (2018b) likewise found that compared with auto-centric areas, transit station proximity in Phoenix predicted an 88 percent increase in knowledge firm start-ups compared with service and retail sectors, which experienced a 40 and 28 percent increase, respectively. Other research concluded that most TOD areas gained jobs in some knowledge and creative economy industries, adding more than $100 billion in wages capitalized over time (Nelson, Miller, Eskic, et al. 2015).
Despite this research, however, there is little evidence whether TODs impact firms’ sales volume. Indeed, drawing together research on transit and economic development, agglomeration economies, and the creative economy, several questions emerge. The first is whether business owners will gain more return for their investment in TODs. Property values are relatively higher in TODs (Debrezion et al. 2007; Hamidi et.al. 2016; Mohammad et al. 2013). Consequently, if business owners want to locate in a TOD, they would need to invest more in property costs. Yet it is theorized that firm productivity might increase in a TOD due to clustering and networking (Nelson, Miller, Eskic, et al. 2015). Moreover, the majority of studies on economic outcomes of TODs have not properly controlled for station areas’ built environments (Chatman, Noland, and Klein 2016; Nelson, Miller, Eskic, et al. 2015). This research contributes to these debates by testing whether creative and knowledge firms exhibit stronger sales volume as a result of locating in a TOD. As such, planners and policy makers will be able to better understand the linkages between land use, transit, and knowledge-based economic development to maximize economic benefits while simultaneously realizing social and environmental advantages associated with smart and creative city development policies.
Research Process and Methods
To assess the relationship between TOD and knowledge-based and creative firms’ sales volume, we first have to control for other factors that may also influence these relationships. Therefore, our study consists of three steps. First, we employ cluster analysis to classify rail station areas based on density, diversity, and walkability as three built environment characteristics extensively suggested by the literature (Scheer et al. 2017; Renne and Ewing 2013). Second, from our national micro-data set of creative and knowledge firms, we select firm samples located in each station area type. We utilize PSM methodology to determine the impact of TOD on firm sales volume by matching similar firms located in three different station types using six explanatory variables—number of employees, sectoral classification, square footage area of firms, firm headquarter status, job accessibility via transit, and accessibility to firms of similar industrial character within a twenty-minute driving time (i.e., matched firms in TOD–TAD, TOD-Hybrid, and Hybrid-TAD). Finally, this study compares sales volume for the firms in different station area types, and computes the ATE of being located in a TOD. We consider TOD stations as the treated group, and TAD and Hybrid stations as the control groups in our major matched firm pairs. Our data come from the Center for Transit-Oriented Development’s TOD database, which includes about 5,145 rail transit stations in the United States (including existing, planned, and proposed stations before 2011). Our study also employs disaggregated point-level business data from the Esri Business Dataset (EBDS) and includes 219,844 knowledge and creative firms in the United States.
Step 1: Station Area Classification—Cluster Analysis
The built environments associated with transit stations fall within a Transit-Oriented to Transit Adjacent (TAD) spectrum, rather than a simple dichotomous scale. Furthermore, there is no agreement regarding the ideal built environments for TOD. As such, identifying TOD stations and distinguishing them from other transit development styles such as TAD is a difficult but important research step. To this end, we first identify the transit catchment areas depending on the mode people use to travel to the transit station. For instance, the catchment area will be larger for those bicycling compared with those walking, and larger for bus travel versus bicycling. However, areas with a pedestrian friendly urban design and housing and employment density can extend the catchment area beyond one mile (Canepa 2007). As a result, Patheram et al. (2013), among others, question the conventional measure of the 0.5-mile catchment. Although a pedestrian can cover 0.5 mile in ten minutes with a constant walking speed of about 3 mph, pedestrians who tolerate slightly longer walking times and faster speeds can extend a transit catchment area to one mile or beyond. Alternatively, a transit catchment area could also be determined by identifying how far the market responds to a station. We adopt a distance measure drawn from Patheram et al. (2013), which found that Salt Lake City TRAX transit stations impacted rental property values falling within 1.25 mile of transit stations, but no further. Hence, our catchment area includes all firms and census blocks whose centroids fall within the 1.25-mile network distance of transit stations.
Drawing on similar methodologies used in previous studies (Atkinson-Palombo and Kuby 2011; Scheer et al. 2017), this research uses a hierarchical clustering algorithm with average distance measures to classify station area types based on three built environment factors—activity density, land use diversity, and street network design (Table 1). This approach allows us to group existing station areas based on their actual built environmental characteristics, rather than hypothetical criteria of TOD or TAD. Three built environment variables are standardized to make the variance across variables equal. Even though earlier studies have classified transit stations in three categories (TOD, TAD, and Hybrid; Renne and Ewing 2013), their classifications are based on certain thresholds. To validate these findings, we attempt to determine the optimal number of clusters in our data set using NbClust package in R 3.4.2 software (Charrad et al. 2014).
Built Environment Variables Used for Station Area Classification.

Note: LEHD = Longitudinal Employer-Household Dynamics.
Table 2 shows the results of hierarchical clustering for 5,145 rail stations in the United States. The first cluster (n = 260) is titled “TAD” because it has the lowest level of density, diversity, and intersection density. The second and largest cluster (n = 4,734) is classified as “Hybrid” which has a high entropy index and medium levels of activity and intersection densities. The third group (n = 151) is named “TOD” as these stations exhibit the highest levels of activity density, diversity of uses, and intersection density.
Cluster Analysis Result and Descriptive Statistics.
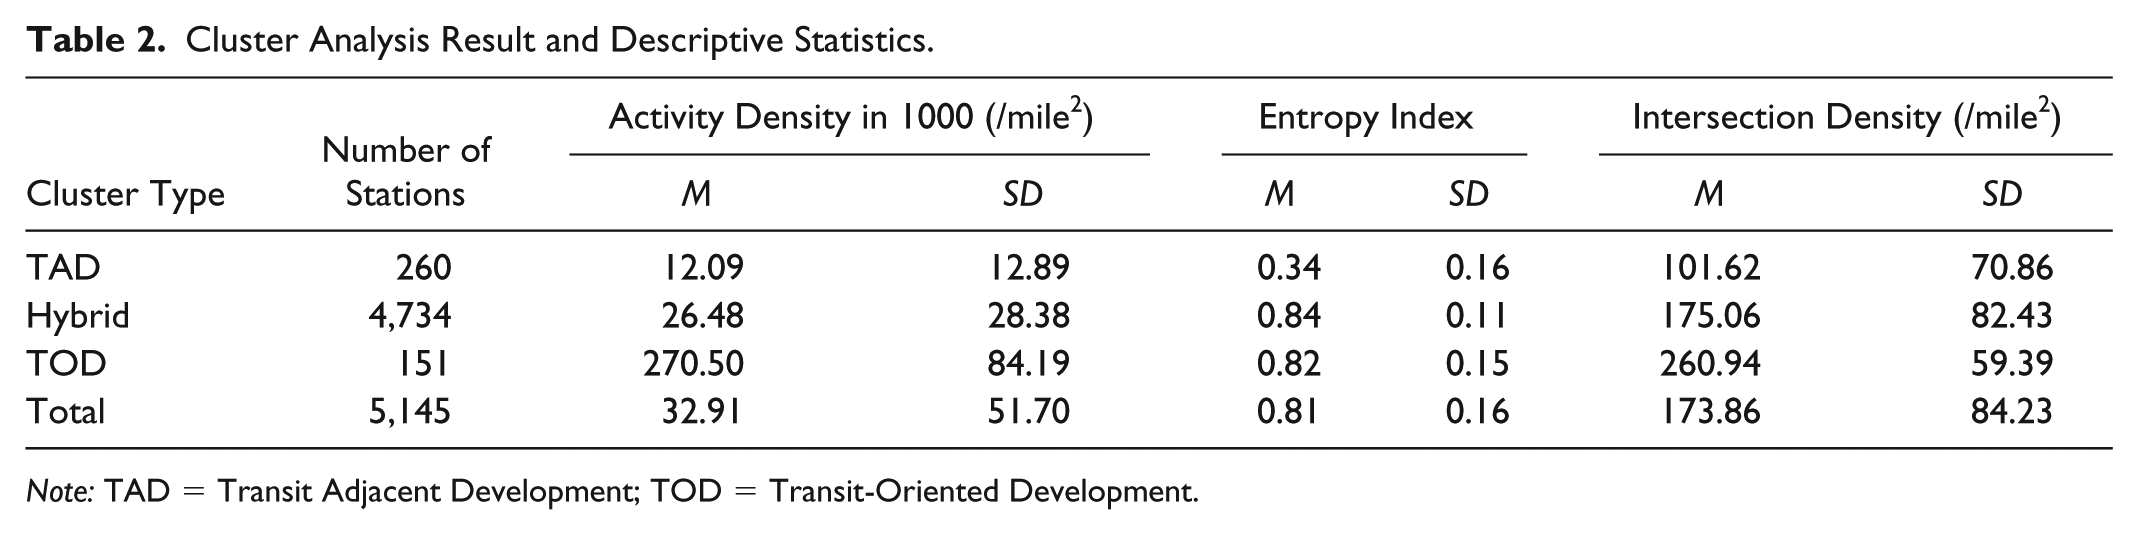
Note: TAD = Transit Adjacent Development; TOD = Transit-Oriented Development.
Our sample firms are those located within a 1.25-mile network distance from only those stations that have been functioning since before 2011. We allot individual firms to their nearest stations based on network distance to assign the station type.
The Hybrid group has the largest number of firms (n = 132,370), followed by the TOD (n = 25,124), and TAD (n = 2,811) station types (Table 3). Table 3 shows that sales volume is highest in TOD stations, followed by Hybrid and TAD. On average, TAD firms have the highest number of employees, Hybrid firms have larger office spaces and are more likely to be a headquarter or subsidiary, while TOD firms have better job accessibility by transit and better access to firms in similar industries.
Firm Characteristics by Station Area Types: Average, ANOVA, and Chi-squared Analysis.

Note: TAD = Transit Adjacent Development; TOD = Transit-Oriented Development.
p < .1. **p < .05. ***p < .01.
Step 2: Creative and Knowledge Economy Sample Firm Selection—PSM
Researchers have been widely using PSM to overcome issues resulting from the nonrandom assignment of individuals to treatment groups in the evaluation of social programs (Oakes and Johnson 2006). These kinds of studies are often centered on observational data, which introduces confounding variables into the study because of nonrandom assignment. As a result, there are likely systematic differences between individuals in the treatment group versus those in the control group that must be controlled for in order to assess the actual impact of the treatment. These same concerns apply to studying diverse firms located in a range of places. For example, firms in suburban regions might be smaller (or larger) than those in downtown areas, and subsequently produce less (or more) profit. As a result, the observed difference in outcomes (i.e., sales volume) between firm groups may be caused by these confounding firm characteristics as opposed to being the result of the treatment. In our case, the treatment is the impact of being located in a TOD catchment area. PSM addresses this issue by allowing us to generate a treatment group of firms located in TOD station types as well as a control group, which includes similarly matched firms located in TAD areas. The propensity score is therefore defined as the conditional probability of assignment to a particular treatment given a vector of observed covariates (Rosenbaum and Rubin 1984). We developed a binary logit model to estimate propensity scores using the subsample of firms located in TOD (treatment) and non-TOD (control) station areas. The PSM was implemented in R 3.4.2 using the MatchIt package.
We identify creative and knowledge economy firms using a list of North American Industry Classification System (NAICS) codes. Considering this research is interested in the role place plays in firm sales volume, industry data are most relevant for our study. To identify creative economy firms, we follow the definition developed by Markusen et al. (2008) and use eighty-five distinctive NAICS codes active in four categories including the production and distribution of cultural goods, the production and distribution of intellectual property, and cultural educational services (Markusen et al. 2008, 40–41). For the knowledge economy, we include fifty-one sectors by adopting the Brookings’ two criteria which are as follows (Muro et al. 2015, 21):
R&D spending per worker must be in the 80th percentile of industries or higher and exceed $450 per worker.
Firm workers with a high degree of science, technology, engineering, and mathematics (STEM) knowledge should be above the national average, or 21 percent of all workers.
In addition to the firms’ sectoral categories, we chose six firm characteristics as independent variables—firm headquarter status, number of employees, square footage area of firms, job accessibility via transit, and accessibility to firms of similar industrial character within a twenty-minute driving time—as confounding factors in sales volume outcomes based on the following three economic frameworks. First is the production function that relates the level of obtainable sales from each feasible combination of the firm’s inputs, which are generally labor and capital (Aigner and Chu 1968). Second is the capital and corporate structure framework measured by employment size and assets (e.g., land; Fischer Heinkel, and Zechner 1989), and the firm’s status in the corporate structure (e.g., headquarter vs. plant; Gao, Ng, and Wang 2011). Although these two frameworks estimate the firms’ sales volume in the short run, the third framework—economies of scale—indicates the parameters through which the scale of production increases in the long run through its accessibility to shared labor pools, customer markets, specialized suppliers, and knowledge as a result of intra-industry firm proximities (Marshall 1890). Table 4 includes information for the above mentioned six indicators.
Descriptions and Sources of Model Variables.
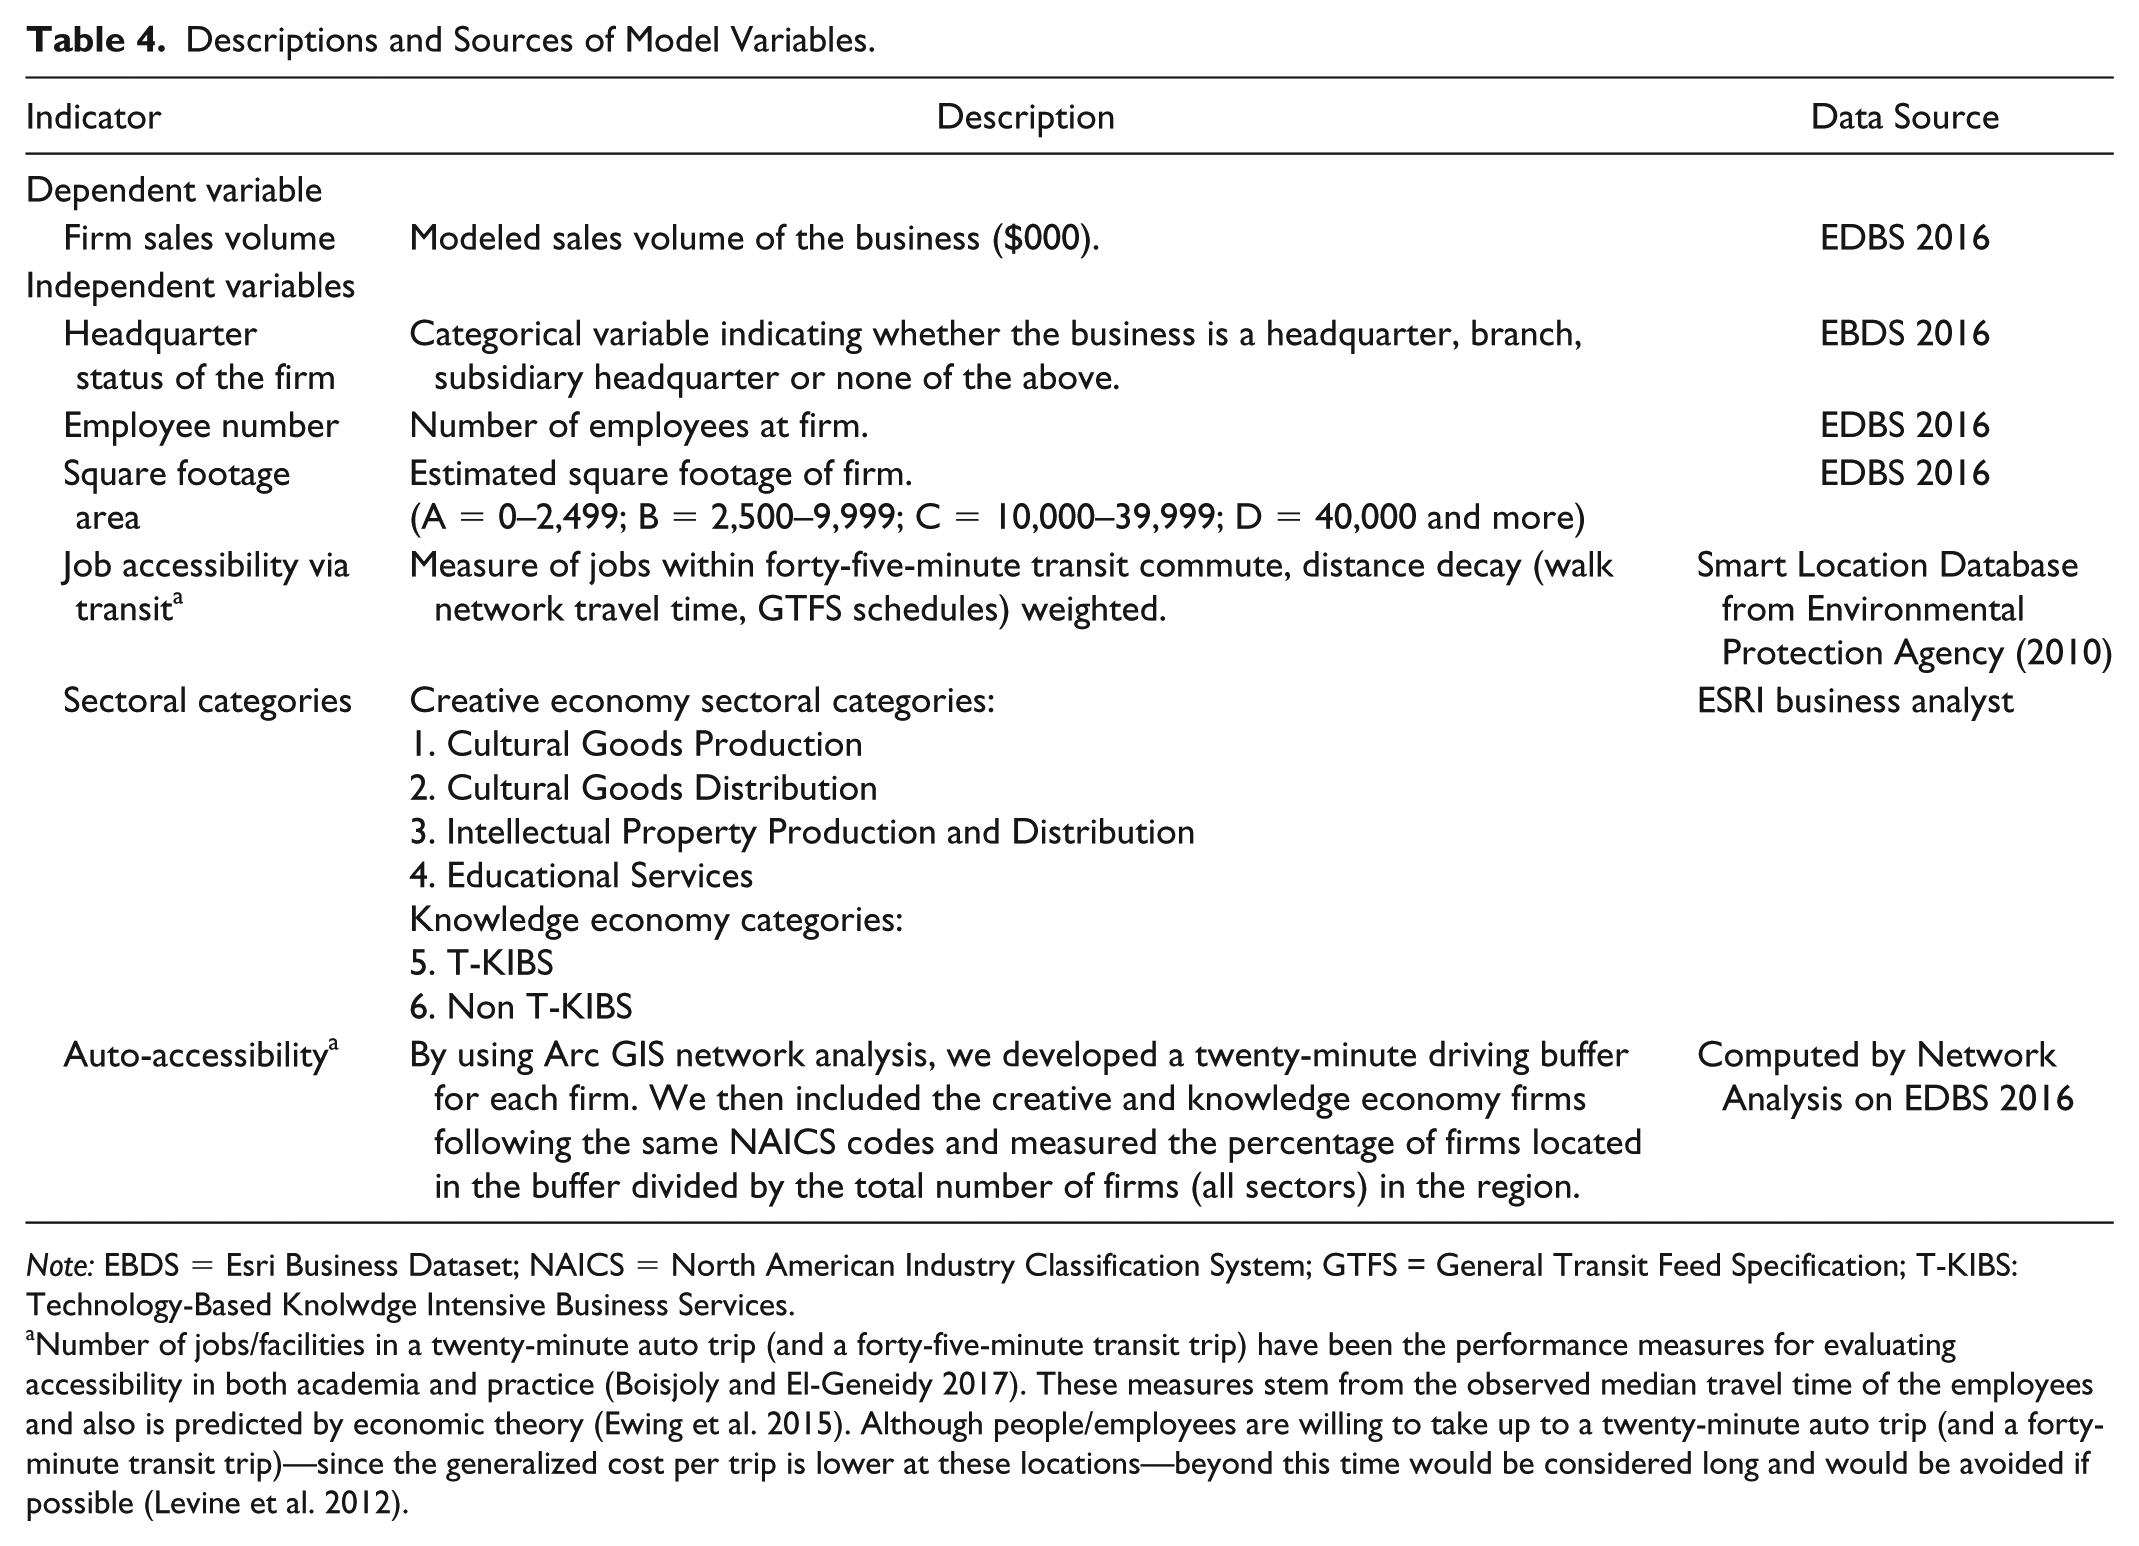
Note: EBDS = Esri Business Dataset; NAICS = North American Industry Classification System; GTFS = General Transit Feed Specification; T-KIBS: Technology-Based Knolwdge Intensive Business Services.
Number of jobs/facilities in a twenty-minute auto trip (and a forty-five-minute transit trip) have been the performance measures for evaluating accessibility in both academia and practice (Boisjoly and El-Geneidy 2017). These measures stem from the observed median travel time of the employees and also is predicted by economic theory (Ewing et al. 2015). Although people/employees are willing to take up to a twenty-minute auto trip (and a forty-minute transit trip)—since the generalized cost per trip is lower at these locations—beyond this time would be considered long and would be avoided if possible (Levine et al. 2012).
Next, we match each firm in TOD station types with those in non-TOD based on the propensity score. Caliper length of 0.03 is used for matching, meaning that for a treatment observation, we use a match in control observations whose propensity scores are within 0.03 of the score of the treatment observation (Austin 2011).
The PSM generates 4,874 firm matches (2,437 in total) in the TOD–TAD pair, 31,710 matches in the TOD-Hybrid pair, and 5,622 matches in the TAD-Hybrid pair.
Step 3: Sales Volume Comparison Analysis
The key and final goal of this study is to compute the “true” impact of TOD station area type on firms’ sales volume. Once the matching is complete, we calculate the ATEs of station area type on sales volume. The ATE is computed as the mean sales volume of the matched TOD firms minus those of the matched non-TOD firms. In multiple case comparisons, not simply one treatment and one control, the propensity scores can be estimated separately for each pair of control and treatment groups (i.e., TOD–TAD, TOD-Hybrid, and TAD-Hybrid; Lechner 2002). For each pair of locations, we use t test analysis to assess sales volume differences between the firms in our subsample located in each specific transit station area type.
We conduct three t test analyses. Our first model is an analysis of the sales volume differences for both knowledge and creative economy firms. The results suggest that while both TOD and Hybrid station types positively impact firm sales volume, stations with higher levels of population density, walkability, and mixed uses have the strongest impact on firms. Table 5 shows that after matching (i.e., controlling for firm characteristics), TOD firms, on average, sell 6,538 more units than their counterparts in TAD station types, and the difference is statistically significant. Likewise, in the matched samples, TOD firms sell 2,158 more units than Hybrid firms. Last, the difference between Hybrid and TAD firms are also significant at 0.05 probability level. Using the results of sales volumes between the three pairs of station area types, we can also estimate the impact on sales volume corresponding with the changes made to station areas or as a result of a firm’s move from one station type to another. For example, if a firm moves from a TAD to a Hybrid station type, or theoretically, if a city changes a TAD to a Hybrid station type by increasing its development density, land use mix, or street connectivity, the average firm is expected to sell more products. If the firm moves to a TOD, or the station area is developed into a TOD, the firm is expected to have even higher sales volume. Cumulatively, from TAD to TOD, a firm is estimated to have significantly higher sales volume.
Differences in Sales Volume between Station Area Types after Matching.
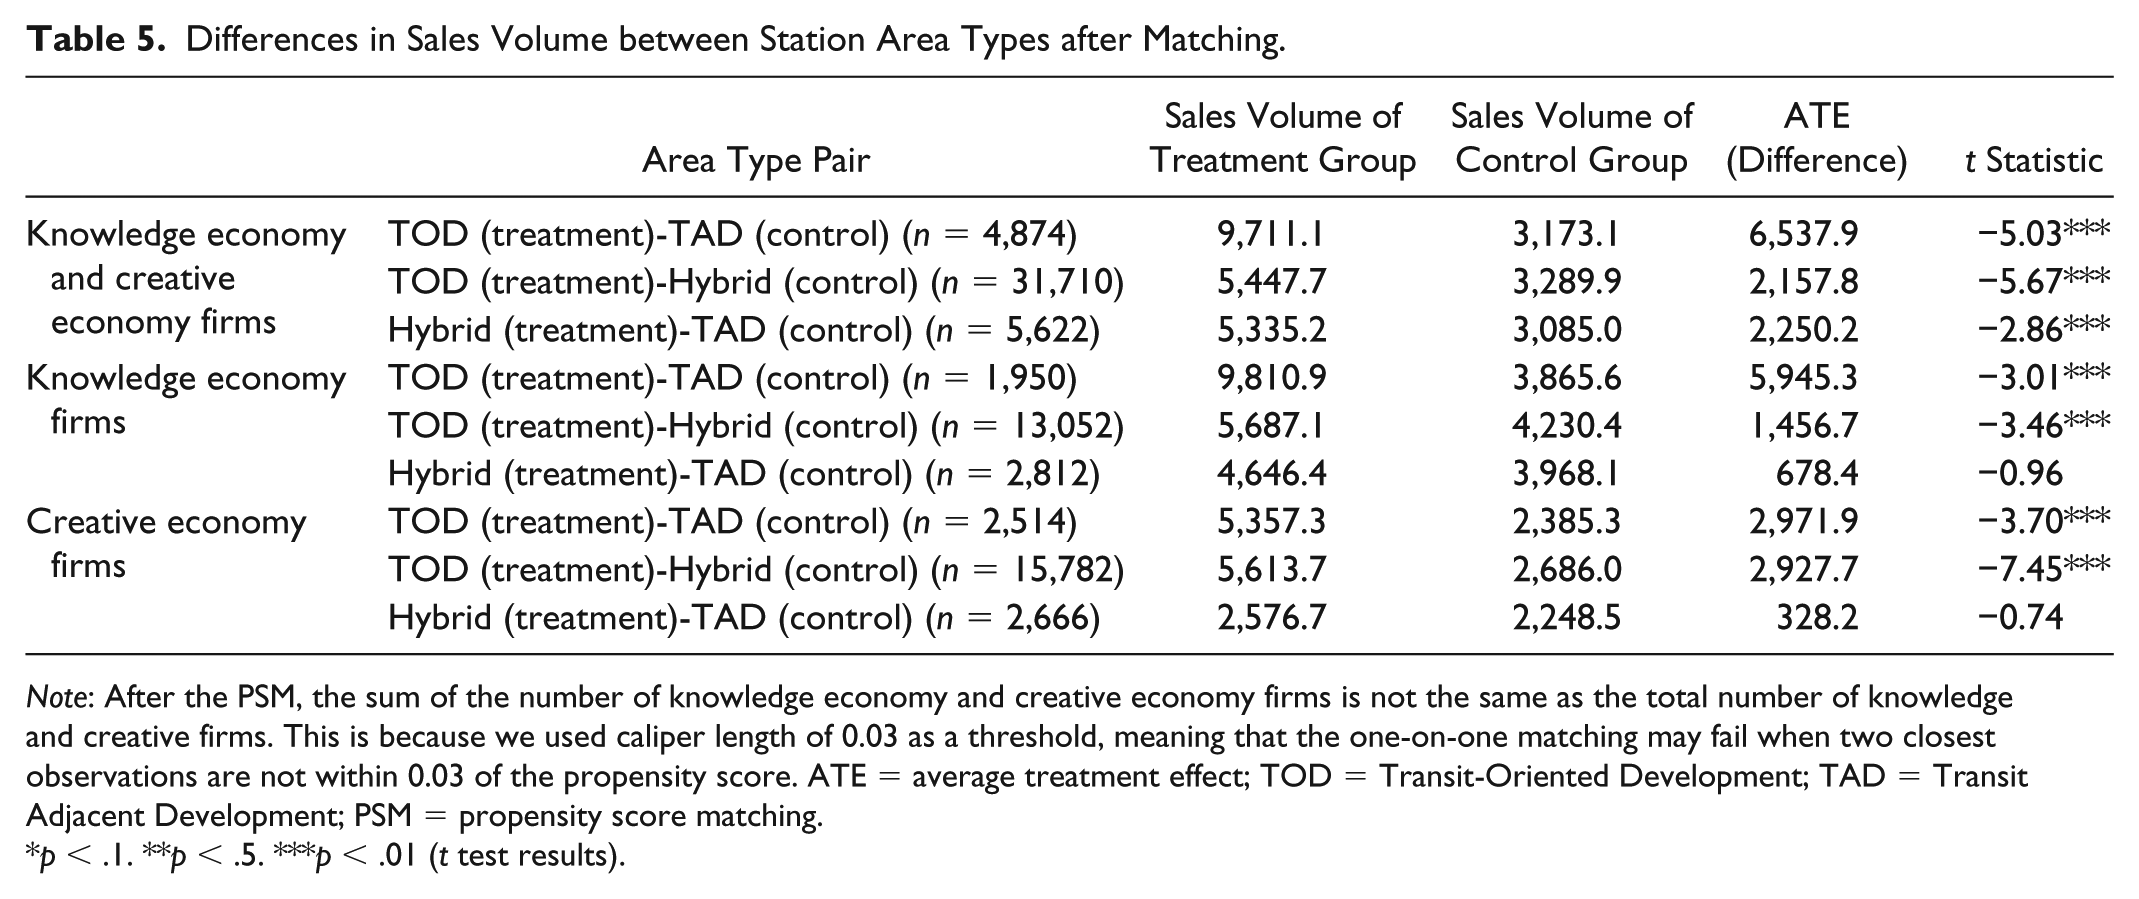
Note: After the PSM, the sum of the number of knowledge economy and creative economy firms is not the same as the total number of knowledge and creative firms. This is because we used caliper length of 0.03 as a threshold, meaning that the one-on-one matching may fail when two closest observations are not within 0.03 of the propensity score. ATE = average treatment effect; TOD = Transit-Oriented Development; TAD = Transit Adjacent Development; PSM = propensity score matching.
p < .1. **p < .5. ***p < .01 (t test results).
Our second and third models test the impact of TOD stations on knowledge and creative economy firms separately. As shown in Table 5, the results suggest that although all firms benefit from increasing activity, density, and walkability, knowledge economy firms may benefit more than creative economy firms. As shown in Table 5, knowledge economy firms located in TOD stations with the highest level of activity, density, and walkability outperform knowledge firms located in Hybrid and TAD areas. This same dynamic exists, albeit not quite as strongly, when comparing Hybrid with TAD stations. Although average firm sales are greater in Hybrid compared with TAD station, the results do not reach statistical significance.
The last model analyzes the relationships between station area type and creative economy firms. The impact on sales volume is much stronger for the creative economy firms compared with knowledge economy firms when comparing the firms in TOD with the firms in Hybrid areas, but not stronger than in the other pairs. As indicated in Table 5, increasing levels of density, activity, and industry diversity clearly have positive impacts on firm sales volume of creative industry. The movement from TAD to Hybrid and TOD, and Hybrid to TOD all reflect greater gains in sales volume when compared with knowledge industry firms; however, only the two latter pairs are at statistically significant levels.
Discussion
According to our national transit station typology analysis, only 3 percent of stations areas are TODs. Almost 92 percent of station areas are Hybrid and the remaining 5 percent are TADs. Our findings differ from previous attempts using similar methodologies to classify rail station areas. However, the majority of these studies are limited to either one or a few regions (Atkinson-Palombo and Kuby 2011). In the only existing national study, Renne and Ewing (2013) presented the same three-station typology (TOD, Hybrid, and TAD). However, they found 37 percent to be TOD, 31 percent to be Hybrid, and 32 percent to be TAD among the 4,400 rail stations (Renne and Ewing 2013). The disagreement in our findings is not surprising. Renne and Ewing (2013) used a 0.5-mile straight-line distance while we used a 1.25-mile network distance from each station to identify station catchment areas. In addition, they adopted a system that scored station areas for residential density, land use diversity, and walkability; we employed cluster analysis for that purpose.
Hybrid stations, as the largest category among the three station types, are home to more than 82 percent of the knowledge and creative firms located within our station catchment areas, while TODs are home to more than 15 percent of firms in our sample. In contrast, firms in TOD station types are mostly branches and have the biggest sales volume and strongest job accessibility via both automobile and transit while occupying large office areas. These results suggest that TODs could actually serve as vital anchors, fueling the broader creative and knowledge economy.
Based on our analysis of built environmental attributes for each station area type, our results confirm that TODs are significantly denser, have a higher degree of mixed land uses, and exhibit stronger street connectivity. For example, our 151 TODs are eight times denser and have 1.5 times stronger street connectivity than the total average. However, in terms of land use diversity, there is not a significant difference between TODs and Hybrids. This shows the potential of Hybrids to be transformed into TODs by increasing density and street connectivity. Using our station classifications, policy makers can identify Hybrid stations that have the greatest potential for increased density and street connectivity by incorporating land use and zoning policies to facilitate such transformations.
We also found significantly higher sales volume in Hybrid than TAD stations for both knowledge and creative firms. Although locating in TODs might be unaffordable for small knowledge start-ups due to higher property values, policy makers might leverage their resources to incentivize knowledge firms to locate in Hybrid station areas. Conventional economic development strategies such as tax abatements, development assistance, and other incentives (Blakely and Leigh 2009) could be employed as well as strategies focused specifically on the creative and knowledge industries such as placemaking efforts (Pancholi, Yigitcanlar, and Guaralda 2015; Smit 2011), the creation of live-work, coworking and other collaborative, creative spaces (Gadwa and Markusen 2009; Strom 2010), the development of flagship cultural institutions (Grodach 2010), and siting of knowledge-based anchors through collaborations with universities or larger innovative firms (Comunian, Taylor, and Smith 2014).
Despite the fact that relatively smaller number of knowledge and creative firms are located in TODs, such firms experience significantly higher sales volume relative to comparable firms in TADs and Hybrids. These findings provide additional empirical evidence to business owners and policy makers that there is likely a higher return on investment by locating a firm in a TOD compared with other station types. This is also the case for the Hybrid-TAD comparison in firm sales volume. Our findings support the literature stating that knowledge and creative firms are more productive in dense, walkable and diverse places because they create the right kind of buzzy environment for networking, learning, and collaborating (Currid and Williams 2010; Hamidi and Zandiatashbar 2018; Katz and Wagner 2014; Murphy 2000; Storper and Venables 2004; Zandiatashbar and Hamidi 2018). It is worth noting that TOD stations on average are home to more headquarters and larger firms, which may act as anchors in these creative and knowledge-based clusters. These stations also likely benefit from geography as they are within closer proximity to highly skilled workers and similar industries (Bathelt, Malmberg, and Maskell 2004; Porter 2000). In other words, TOD’s street network, mixed uses, and density of activity only form part of the dynamic constellation of factors influencing firm productivity.
Conclusion
TODs share many of the place-based characteristics presumed to support creative and knowledge firm productivity such as accessibility, walkability, and mixed uses. Yet there is little research on the relationship between TOD and the creative and knowledge economy (Credit 2018a). Furthermore, there is scant evidence on the economic impact of TOD beyond their influence on surrounding property values. Considering, however, the research on TOD, agglomeration economies, and creative clusters, there is reason to believe that these types of developments would have broader economic impacts. This study attempts to provide insight into these relationships by first categorizing TOD station areas by activity diversity, land use diversity, and street network design; and second, by testing how these different place-based environments impact creative and knowledge firms’ sales.
The results of this study indicate that creative and knowledge firms do benefit significantly from locating in TOD station areas. As such, the research suggests planners should integrate TOD policies and regulations with creative and knowledge-based economic development strategies to maximize impacts. For example, while TOD areas currently exist in different neighborhood types (i.e., central business districts [CBDs], Urban/Town Centers, and Urban Neighborhoods), one neighborhood type could also be an innovation-hub TOD. The addition of an innovation-hub TOD to other networked TOD areas could provide the infrastructure to building more resilient and innovative regional economies. Planning for innovation-hub TODs should be based on strategic land use plans, zoning, and incentives to accommodate educational anchor institutions, workforce training centers, coworking spaces, creative and knowledge-led start-ups, accelerators, and incubators (Katz and Wagner 2014) in addition to existing TOD land use and policy regulations such as mixed-use zoning, density bonuses, reduction of parking ratio regulations, placemaking, adopting district plans, Adaptive Reuse Ordinance (ARO), and active transportation design. Such planning efforts can draw upon the successful examples of these regulations. For instance, state-enabled density bonuses and incentives successfully facilitated high-density multifamily developments in station areas, which in combination with adaptation of district specific plans, spurred TOD growth in Los Angeles (Gabbe 2016).
Additional incentives could include economic development grants for start-ups, worker training tax credits, and location-based venture capital. Municipalities should also plan for “upzoning” their Hybrid station areas, which already accommodate such services and uses. Accessibility to other universities, CBDs, and airports is critical for this type of TODs to allow the inflow of educated workers and local and global customers; hence, transit services and routes should be planned accordingly.
There are already several cities integrating TOD and knowledge economy policies. For instance, the city of Richardson, Texas, recently adopted a plan to develop the Collins/Arapaho Innovation-hub TOD. In addition to anchoring the site with the University of Dallas’s Life Science Center, the plan includes attracting talented labor and support active transportation through higher density development of TOD apartments in close proximity to the rail station (“Collins/Arapaho Transit-Oriented Development and Innovation District Study” 2018). An innovation-hub TOD with a distinct design regulation is the Rainier Beach Food Innovation District (FID) in Seattle, Washington. This example plans to boost cross-cultural food innovation and encourages high-density mixed-used developments with designation of rooftop greenhouses (Crowley 2015). To boost networking and exchange, the Rainier Beach Urban Farm also works with the festival square as the district’s core public urban center for culinary events and markets. Moreover, Towerside Innovation District in Minneapolis, Minnesota, is another example with off-site district wide parking to reduce driving in this 370-acre planned TOD district. This Innovation TOD also includes a signature urban center/plaza, which actively hosts hackathons, high-tech start-up competitions, entrepreneurship boot camps, and grassroots art festivals. Minnesota Innovation Park, which is anchored by an educational institution, is another example, which includes public space in its planning. In addition, municipalities can implement the ARO as a placemaking policy to support signature urban center/plaza or postindustrial mixed uses. ARO encourages building reuse through regulatory exemptions to reduce Vehicle Miles Traveled (VMT) and help cultivate TOD growth, as well as preserve the historic resources in downtown Los Angeles (Riggs and Chamberlain 2018).
Although the research supports the relationship between TOD and creative and knowledge-based economic development, the findings open up several lines of research for further inquiry. More research is needed to understand the role of regional characteristics such as local economy and climate amenities on knowledge and creative firms’ productivity. It remains unclear how much of an impact anchor firms and geographic location have on cluster productivity, relative to other station characteristics such as walkability, density, and mixed uses. Furthermore, although the findings provide support for the theory that TODs increase firm economic activity by creating conducive conditions for face-to-face interaction, we did not directly test the role of social networking. Future research could also disaggregate the creative and knowledge industry clusters to determine if these relationships vary by industry and firm size. Research that is able to tease these dimensions apart by tracking dynamics over time would help to clarify the relationships regarding place characteristics, firm location preferences, and agglomeration benefits in addition to the role the built environment plays in networking, learning, and generating buzz. Furthermore, networking and learning are often tied to technological and innovation spillovers, as opposed to sales volume measures. Future research could unpack these different outcomes.
The inclusion of research on TOD into discussions of the knowledge and creative economy also presents an opportunity for a more holistic perspective regarding the economic impact of both transit development policies and the presence of creative and knowledge industries. Currently, research on the creative and knowledge economy tends to focus on either place-based change in the form of urban revitalization or regional economic impacts. Considering the role transit can play in encouraging agglomeration and increased firm sales, TODs may enable clusters of creative and knowledge firms to develop and become networked across regions, leading to broader economic gains. Understanding the role TOD plays in knowledge and creative economic productivity, suggests that there is a need for revisiting location theories in light of a restructured economy. Therefore, future research might attempt to rearrange the hierarchical system of urban centers and weight TOD areas accordingly. Furthermore, since both TOD and the presence of creative and knowledge industries can lead to more localized revitalization outcomes; it would be productive to study these dynamics concurrently.
As cities and regions transition away from an industrial economy, policy makers and planners are continually looking toward the importance of strengthening its knowledge- and creative-based industries. Although economic geographers and planners have long recognized the value of place in attracting creative and knowledge firms and workers, there has been little attention toward the role TOD could play in these dynamics. This research suggests that there are untapped synergies between TOD and creative and knowledge economies. By integrating planning efforts, planners and policy makers may be better equipped to create places that not only benefit industry clusters but also provide the framework for a more robust regional innovation ecosystem.
Footnotes
Declaration of Conflicting Interests
The author(s) declared no potential conflicts of interest with respect to the research, authorship, and/or publication of this article.
Funding
The author(s) received no financial support for the research, authorship, and/or publication of this article.