
Abstract
Transit-oriented development (TOD) has a close relationship with ecology since its inception and aims to create livable and sustainable environments. However, few studies have examined the key point of ecology in the construction of TOD assessment models. This paper takes Odawara as an example, a city located on the outskirts of the Tokyo metropolitan area. Based on the node–place model, a new dimension of ecology is introduced to expand the two-dimensional model into a three-dimensional model, primarily applied to 18 stations in Odawara. Using this model, the study explores the impact of TOD on the development process of Odawara and proposes historical policy and data-based current condition discussions. The results indicate that the model-based analysis reveals a discrepancy between the current condition of the 18 stations in Odawara and the official positioning of these stations by city managers. Additionally, there is a negative correlation between the node–place value and ecology value of the station areas. We believe that this approach not only directly connects TOD with ecological considerations but also develops a new quantitative assessment model for TOD, particularly in the context of abundant ecological resources in suburban areas of metropolitan areas, arriving at a more refined level of research than before. At the same time, the model continues to maintain good scalability, providing new perspectives for the metabolism of developing areas worldwide.
Introduction
In the process of urbanization, land development plays a key role in maintaining the vitality of cities and enhancing their capacity (Renne and Appleyard, 2019). However, rapid urbanization has led to a series of problems such as urban land constraints and land wastage, and sustainable urban development has been seriously hampered. The birth of new urbanism was a reflection of certain characteristics of suburban sprawl in American cities at the turn of the century and has gradually expanded worldwide. It advocates for compact, diverse, and interconnected urban environments, emphasizing walkability, public spaces, and community consciousness. TOD, as an urban development model under the new urbanism, has been proposed as one of the potential paths to achieve high-quality development of urban space since around the 1990s, providing new ideas to alleviate urban problems such as traffic congestion and resource waste in many countries around the world (Banai, 1998; Ibraeva et al., 2020; Liu et al., 2022). Essentially, TOD can be described as integrating land use and transportation planning to make sustainable transportation and living facilities convenient, focusing urban development around transit stations to maximize efficiency. But, as TOD begin to be implemented around the world, it is clear that their results can be quite diverse. This is because, in practice, the outcome of a project will depend on a variety of factors, trends, and the complex interrelationships between them (Ibraeva et al., 2020).
In its original conception, TOD had a close relationship with ecology, where it was mentioned as playing an active role in promoting sustainable and eco-friendly urban development. But, in the practice of TOD around the world, there seems to be more emphasis on the transport issues and the associated land diversity, and less discussion of the ecological aspects of the areas where TOD station are located. Even the subsequent concepts of “green TOD” and “sustainable TOD” have only been used to a lesser extent in the literature to reflect their eco-friendliness, but these are too one-sided and, in particular, the indicators constructed are too homogeneous. This is clearly not enough, and we believe that there are still many strong correlations between TOD and ecology that need to be explored. It is therefore noted that the node–place model can be a good tool for TOD assessment prior to the development of TOD-related policies. At the same time, we recognize that the emergence of the “eco-city” gives us another possibility to solve the problem. We aim to extract the quantifiable aspects from the concept of “eco-city,” such as open green space area (which can directly correlate with carbon sequestration capacity), and attempt to integrate them with the node–place model. More specifically, we attach the “ecology” dimension to the node–place model as a whole, making it as important as node and place. Subsequently, as a pilot study, we applied the node–place–ecology model to a metropolitan suburban area, the city of Odawara as an example, because of its rich ecological resources. The research contribution lies in the expansion of the node–place model with a third dimension, “ecology,” to assess the performance of TOD in nodes, places, and ecology aspects. It aims to create a quantifiable assessment model for TOD projects worldwide, especially in the suburbs of the metropolis, aiding in policy formulation and further advancement of these projects.
Study area
TOD in Tokyo metropolitan area
The Tokyo metropolitan area has always been a hot spot in TOD research. The history of public transportation in Tokyo dates back to the late 19th century, when the city was undergoing rapid modernization and urbanization (Liu et al., 2022). As time goes by, the urban population continues to increase, and the availability of land in city centers becomes scarce. In this situation, the migration of emerging populations revolves around railway lines. The suburban areas of the Tokyo metropolis have also developed under this expansion pattern. On this basis, the land around railway stations has also been continuously changing, and for example, the RIC (rail integrated communities) is the name given to the settlements that have developed around the stations (Calimente, 2012).
Some scholars also argue that this transit-oriented development model in Japan has been given a more widely used concept, the compact city (Chorus and Bertolini, 2016; Liu et al., 2022), designed to maximize the use of limited land resources and promote sustainable development. The compact city concept emphasizes the creation of dense, mixed-use communities that are centered around public transport hubs and functional pedestrianized streetscapes. The term is also used frequently in most government policy reports. However, recent discussions have tended to suggest that TOD is simply a new name for an enduring global concept, absorbing most of the similar designations, and in response to the global debate, we have taken the latter position and always used the term TOD (Liu et al., 2022).
Odawara city as an example
As Figure S1 shows, Odawara is located about 100 km southwest of Tokyo, and it is well-connected to the city by rail and road networks. Many residents of Odawara commute to Tokyo for work, making it a popular bedroom community for people who work in the capital. At the same time, Odawara is also an area that benefits from a diverse and favorable geographical environment. It is located between mountains and the sea and benefits from a relatively mild climate and abundant rainfall, creating ideal conditions for numerous species to inhabit the area. This diverse landscape creates opportunities for a wide array of ecological resources to thrive.
In the Odawara City Location Optimization Plan released by the Odawara official in 2019, it was explicitly mentioned that the city is facing a rapid aging population, declining birthrate, and resultant stagnation in regional industries and decline in vitality. As suburban locations such as residential areas and shops continue to develop, urban areas have spread out and become low-density cities. As a result, providing services to support the lives of dispersed residents may become challenging under limited financial conditions. City managers propose that residents should be able to access medical and social welfare facilities and commercial facilities through public transportation without overly relying on private cars, in order to create a “compact and network” goal where the services needed for daily life and administrative services are located near housing. The TOD assessment model we developed can further assess the current level of the existing 18 stations in Odawara and the surrounding areas, in order to make further responses to future plans. In the following discussion of the 18 stations, we will discuss the plans for these stations based on the Odawara City Location Optimization Plan.
Theoretical background
TOD typology and node–place model
Transit-oriented development stations are located in different zones and face unique development challenges in practice, while similar common features can exist between stations, which at the same time become an important element of urban development. Therefore, the typology of TOD is based on the diversity of conditions and planning needs in these areas (Reusser et al., 2008). In the beginning, Calthorpe classified TOD types into two categories: “urban TOD” and “neighborhood TOD.” Urban TOD is located along the main routes of the regional public transportation network, serving as larger transportation hubs and centers for commerce and employment with higher development intensity and more comprehensive functions. Neighborhood TOD, on the other hand, is situated along secondary routes, serving surrounding communities. This classification initially establishes a planning guidance relationship between urban functions and public transport characteristics (Calthorpe, 1993). Continuing from there, Dittmar and Poticha (2004), while evaluating Calthorpe’s classification, believed that TOD areas face complex challenges as time changes. Building upon case studies, they further refined the classification by proposing six: Urban Downtown, Urban Neighborhood, Suburban Center, Suburban Neighborhood, Neighborhood Transit Zone, and Commuter Town Center. This allows for more targeted planning guidance to be provided. A number of scholars and researchers suggest that there are three main reasons for the differences between TOD areas. The first is the difference in the building conditions of the site area itself, including land and transport conditions. Secondly, there are differences in the development positioning and construction standards of different regions. Thirdly, there is also inconsistency in the roles and responsibilities of the city government, community residents, track operators, and other subjects associated with the development and construction of the development (Calthorpe, 1993; Cervero et al., 2004; Chorus and Bertolini, 2011; Cao et al., 2020; Ibraeva et al., 2020; Kamruzzaman et al., 2014; Sun et al., 2021).
While there are many studies that are primarily conducted from a qualitative perspective, at the same time, with further detailing of the study area, a quantitative perspective to typify TOD is increasingly favored by researchers. Many researchers have attempted to quantify the classification of TOD according to the different characteristics of stations and neighborhoods. Typically, station areas are evaluated on criteria such as density, diversity, and design, with 3D identified by Cervero and Kockelman (1997) as a key feature of TOD (Cervero and Kockelman, 1997). In subsequent studies, scholars have added “distance to transit” and “destination accessibility” to the 3D principle, developing it into a 5D principle (Cervero et al., 2009; Dill, 2008; Ewing and Cervero, 2010). The node–place approach (or “model”) developed by Bertolini (1996, 1999) quickly became a widely cited and applied method in TOD typology, and a number of researchers began to develop specific node and place indicators to extend and redefine the model on a case-by-case basis (Bertolini, 1996; Bertolini, 1999).
As one of the best-known approaches to the quantitative typology of TOD, the core idea of the node–place model is to promote the synergistic coupling of node and place functions in the hub area to achieve structural optimization and sustainable development of the hub area’s territorial space. This approach essentially translates into an XY two-dimensional coordinate map, where the Y-axis represents the accessibility of a node (node dimension, describing the variety and frequency of transit supply) and the X-axis represents the characteristics of a place (place dimension, describing the population types and diversity of land use within station areas). The position of these sites on the diagram depends on their performance on both indexes. However, the node–place model was initially theoretically unable to fully reflect the multidimensional nature of TOD. A large number of studies have subsequently extended the original node–place model by constructing indicators of accessibility, orientation, activity, design, functionality, and connectivity, with the aim of incorporating the ideal model of TOD into a complete assessment system (Cao et al., 2020; Cummings and Mahmassani, 2022; Dou et al., 2021; Kamruzzaman et al., 2014; Lyu et al., 2016; Zhou et al., 2023). Translating the TOD concept into quantitative indicators is the primary problem in the application of the model, and the use of multiple sources of data to enable the calculation of indicators is the solution to this problem. But up to now, there is no complete rating index system that reflects the TOD concept, and the accuracy of the index calculation needs to be further improved.
Sustainable TOD and green TOD
The concept of sustainable TOD has been discussed in various publications, but there is still no widely accepted definition, resulting in heated debates surrounding it. Both Keeble (1988) and Griggs et al. (2013) defined sustainable development as a process that revolves around striking a balance between economic development and the protection of Earth’s ecosystems, and the construction of urban transportation will align with this definition. Some studies suggest that enhancing transportation networks will stimulate urban economic growth (Loo and Banister, 2016). However, it may generate adverse environmental consequences, including climate change, biodiversity decline, and excessive carbon emissions. The characteristics of TOD itself are considered to have positive implications for urban sustainable development. Numerous scholars assess the sustainability of TOD by utilizing calculations and incorporating various indicators. They prioritize factors such as energy consumption, pollutant emissions, green infrastructure, and floor area ratio.
The concept of green TOD originated from sustainable TOD, but it is more targeted and specific compared to sustainable TOD. The green TOD combines green urbanism and TOD, promoting environmental design, maximizing resource and energy efficiency, and utilizing green construction techniques. Cervero and Sullivan first introduced this term in 2011 and proposed that the combination of green TOD should be achieved in the following aspects: (1) Higher densities, (2) mixed land use, (3) reduced surface parking and impervious surfaces, and (4) solar energy production at stations. The first three aspects are closely related to the built environment of transit station areas, while the last aspect is more associated with the perspective of green building and ecological technologies (Cervero and Sullivan, 2011). However, their discussion primarily remains at the conceptual level and does not provide more specific quantitative analysis. Subsequent research not only further elucidated the meaning of green TOD but also began to focus on the quantitative assessment of green TOD. Taki and Maatouk (2017) study focuses more on the sustainable mobility aspects within green TOD, such as walking and cycling, to assess the potential for green TOD development in the central area of Jakarta. Niu et al. (2021) followed the definition of green TOD more comprehensively, particularly emphasizing the consideration of sustainable communities. They extensively expanded upon more detailed variables (or indicators) and tested and classified the level of green TOD in various station areas in Singapore.
Whether it's sustainable TOD or green TOD, these concepts primarily focus on smaller-scale urban communities and are more applicable in areas near urban centers, such as TOD stations in central Tokyo. It is not well adapted to peri-urban areas (e.g., Odawara, a city on the edge of the Tokyo metropolitan area), especially at the border between urban and rural areas. This is because compared to urban areas, where population density is higher and economic activities are more frequent, suburban areas typically have abundant natural resources, such as forests, farmland, oceans, and rivers. They play a critical role in the ecosystem, not only providing habitat for countless species of plants and animals but also absorbing and storing large amounts of carbon dioxide from the atmosphere, and helping to regulate the Earth’s climate and water cycle. These natural resources have an extremely important influence on the ecology of the station areas in which they are located, which makes us have to explore this issue.
Introducing eco-cities into TOD
Both “eco-city” and transit-oriented development (TOD) share a common goal of creating sustainable, livable urban environments and represent promising strategies for meeting the needs of residents while minimizing environmental impacts. Before we borrow the concept of “eco-city,” it is necessary to have a general understanding of the ideas it represents (Hu et al., 2016).
With the growing awareness of the impact that urbanization and industrialization have on the environment and the need for a more sustainable model of urban development, the concept of eco-cities has gained momentum (Kenworthy, 2006). Ebenezer Howard, a British urban planner, proposed the concept of “Garden City” in his book “Garden Cities of Tomorrow” (Howard, 1965), which is widely regarded as a precursor to the “eco-city.” Howard developed this concept in response to the rapid industrialization that strongly influenced the development of urban environments since the late 19th century, leading to various problems such as air pollution, water scarcity, and traffic congestion. The real idea of the “eco-city” dates back to the mid-1970s, when the Urban Ecology Group was set up with the aim of rebuilding cities in balance with nature. In his book “Ecocity Berkeley: Building Cities for a Healthy Future” (Register, 1987), Richard Register defines an “eco-city” as a city built according to the principles of living under environmental conditions. In other words, all elements of the city should be kept within the ecological limits of carrying capacity. An increasing number of scholars believe that “eco-city” has now become a mainstream approach for addressing environmental sustainability issues such as climate change and uncontrolled urban expansion (De Jong et al., 2015).
Developing an “eco-city” is a complex process that requires careful consideration of multiple dimensions, including economic, social, cultural, and environmental factors (Kenworthy, 2006). To assess the performance of an eco-city, a range of indicators must be used, reflecting the unique characteristics and challenges of the specific study area. These indicators may include measures of greenhouse gas emissions, the use of renewable energy sources, and the development of green infrastructure (Joss et al., 2012). And, it is important to recognize that the indicators used to evaluate an eco-city’s performance should be tailored to the specific context of the city and the goals of its development.
Additional dimensional “ecology” and extended node–place model
The node–place model provides an analytical framework to study the conditions of transport and urban development, namely, the dimension “node” and the dimension “place.” But whether it is “node” or “place,” it is difficult to incorporate ecological considerations when indexing them both. Therefore, we have decided to keep the original structure of the node–place model without changing its initial setup and to expand it with a new dimension “ecology,” which will have a strong correlation with all ecological aspects of the indicators.
Lyu et al. (2016) are pioneers in widening the dimensions of the node–place model. They used the node–place model as a basis for constructing a 3D model with three different dimensions directly in “T,” “O,” and “D.” Oriented (O) was added when the transit (T) and development (D) did not reveal the extent to which transportation and urban conditions were functionally and morphologically interrelated (Lyu et al., 2016). We will refer to this idea of expanding the node–place model and hope to take the lead in suburban areas to assess more comprehensively the area around TOD sites in this type of area.
For this reason, we are trying to raise “ecology” to the same level of importance as “nodes” and “place.” This means that the node–place model is extended from a two-dimensional model to a three-dimensional model of node–place–ecology, and the dynamic linkage between the three is explored, where the X-axis represents place, the Y-axis represents node, and the Z-axis represents ecology.
Methodology
TOD indicators and their selection
Many scholars have proposed or used a variety of indicators to develop different TOD indicators, depending on the context of their research. To this end, Lyu et al. (2016) have extensively aggregated these referable indicators from a wide range of international literature in their study (Bertolini, 1999; Kamruzzaman et al., 2014; Lyu et al., 2016; Reusser et al., 2008; Song and Deguchi, 2013). We will filter these aggregated indicators directly, taking into account the local characteristics of the Tokyo metropolitan area and Odawara, the accuracy and precision of the data acquisition or measurement, and finally the indicators that are suitable for our study.
However, since this literature only addresses the selection of node and place indicators and is largely devoid of ecological aspects, we need to look for suitable ecology indicators from other literature (Cheng et al., 2015; Evans et al., 2022; Graells et al., 2021; Güney, 2022; Lepczyk et al., 2017; Ma et al., 2016; Ou et al., 2013; Tan et al., 2021; Webb et al., 2005; Wang et al., 2017; Wallace and Clarkson, 2019; Xu and Iop, 2020; Zhang and Han, 2017; Zhu et al., 2021). After listing all the indicators (for details, see supplementary), we need to select the ones that fit the purpose of this study. We invited researchers from different regions and different universities (or institutions) to join us in discussing and identifying suitable TOD indicators, with a total of 15 members. These are from Keio University (5), The University of Tokyo (2), Tokyo Medical and Dental University (1), Chiba University (1), Polytechnic University of Milan (3), Eindhoven University of Technology (1), University of Melbourne (1), and Chinese Academy of Meteorological Sciences (1) and have research backgrounds in landscape architecture, urban studies, environmental economics, systems modelling, environmental engineering, ecological science, data science, architecture, building typology, urban heritage, marine engineering, and meteorology. As can be seen from Table S1, we will focus on these three dimensions (node, place, and ecology), a total of 24 indicators.
Definition of TOD areas
In order to further define the scope of the TOD, it was decided to compare areas of 2000 m, 1000 m, 800 m, and 600 m of the station to determine the final TOD study area. On site, there is no significant difference in height between the 18 stations in Odawara. (The 18 stations are Odawara St., Midoricho St., Kamonomiya St., Kozu St., Isaida St., Hayakawa St., Nebukawa St., Hakoneitabashi St., Hotaruda St., Ashigara St., Tomizu St., Gohyakurakan St., Iriuda St., Iidaoka St., Kayama St., Kazamatsuri St., Anabe St., and Shimosoga St. For ease of follow-up, we have used the first three letters of the station name as an abbreviation.), and the distance we can walk for 10 min at each station is about 700–800 m, which is about 70 to 80 m in 1 min.
Firstly, most of the stations have a large overlap within a 2000 m area. This can seriously affect the accuracy and precision of the data. Secondly, within the 1000 m area there are four completely separate stations, NEB, SHI, KOZ, and KAM. In most areas, for example, from TOM and IID, there are different stations within a 15-minute walk. Therefore, the data chosen for the 1000 m area is also not sufficiently objective. Thirdly, although most of the sites within the 600 m range are in a relatively independent state and the overlap between sites is relatively small, the 600 m range was found to contain too little data, and most of the indicators were largely unchanged, so it was not possible to make a valid TOD assessment. The 800 m TOD area is already a well-established research site in Japan, and both the acquisition of data and the validity of the data are more relevant to our research objectives. Geospatially, separate sites and overlapping areas are also more appropriate. We finally decided to adopt a TOD area within a circle of 800 m from the station, with a walking time of approximately 10 min, for the study.
Integrating TOD values
Normalization
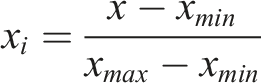
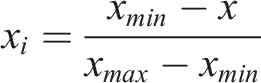
To facilitate the subsequent analysis, we have to dimensionless the data beforehand. There are several methods commonly used to dimensionless the indicator data, and by comparing these methods, this paper uses normalization to dimensionless the data. Normalization is a way of simplifying calculations by transforming a quantified expression into a dimensionless expression that becomes a scalar quantity. In general, indicators can be divided into two categories according to the target orientation of the evaluation: “ higher is desirable” (positive indicators) and “ lower is desirable” (negative indicators). For example, in N1, the more the directions of metro services available, the higher the centrality of the station, which is classified as a positive indicator; in N7, the lower the capacity of parking facilities within the station area, the higher the number of active public transportation users, which is classified as a negative indicator. After dimensionless treatment of the indicators, all indicators are converted to positive variables.
The normalized formula for the positive indicator is as follows:
The normalized formula for the negative indicator is as follows:
Determination of indicator weights
There are many methods for determining indicator weights, including Analytic Hierarchy Process (AHP), Principal Component Analysis, Entropy Weighting Method, Expert Scoring Method, and Standard Deviation Method. These methods are further divided into subjective weighting methods and objective weighting methods. Subjective weighting methods refer to methods in which people subjectively determine the weights of various factors of the analysis object according to their importance, based on their own experience. Although these methods are relatively mature, their objectivity is poor, such as AHP and expert scoring methods. Objective weighting methods refer to methods in which actual data is organized, calculated, and analyzed to obtain weights. This method is relatively new and incomplete compared to subjective weighting methods.
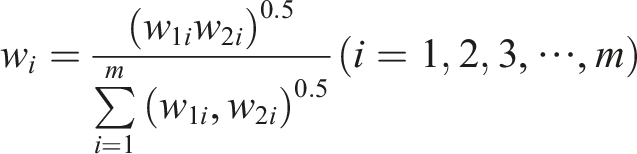
In order to determine the weights accurately, this study uses a combination of subjective and objective methods to determine the weights of the three dimensions of node, place, and ecology. More specifically, the determination of indicator weights can be done using a combination of the AHP and Entropy Weighting Method (Ishizaka and Labib, 2011; Kumar et al., 2021; Saaty, 1977; Shannon, 1948). To combine these two methods, the AHP weights can be used as the initial weights for the criteria, and then the entropy weighting method can be applied to adjust the weights based on the actual data. This combination approach can result in more accurate and reliable weights for the criteria. It is worth mentioning that, as a subjective weighting method, the generation of initial weight values in the AHP will involve scoring by 15 researchers mentioned above, followed by calculating the average values, and finally, conducting the complete calculation process to obtain the final results.
While theoretically the results from the two methods should converge, practical application taking into account differences in underlying assumptions, data quality, and decision context might lead to some disparities between the two sets of weights. Therefore, a combination of both methods is needed to attain more precise weights. According to the principle of minimum relative information entropy, the formula for calculating the combined weight can be obtained by optimization using the Lagrange multiplier method:
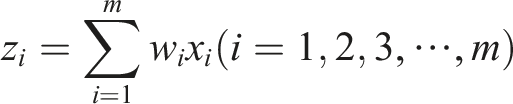
Finally, the TOD values of the 18 stations were obtained by synthesizing the indicator combination weights with the normalized values of the indicators at each station in Odawara.
Results
Quantitative indicators for 18 stations
After normalizing the collected data, we multiplied the combined weights obtained from the AHP and entropy-based methods to obtain a final result (see supplementary).
To facilitate direct comparisons, we have directly summed the three dimensions of the node, place, and ecology to obtain a stacked histogram. The 18 stations are ranked in descending order of combined value as ODA, MID, KAM, KOZ, ISA, HAY, NEB, HAK, HOT, ASH, TOM, GOH, IRI, IID, KAY, KAZ, ANA, and SHI. The combined value of the three dimensions of ODA is the highest, with a total value of 2.0350, while the lowest is the SHI, with a value of 0.4266. The median (ME) of the 18 stations is 0.5582, and the average (AV) is 0.6953. There are five stations above this average, ODA, KAM, KOZ, MID, and HOT, leaving 13 stations below the average.
In the node dimension, ranked from highest to lowest are ODA, KAM, KOZ, MID, HOT, SHI, KAY, TOM, ISA, HAK, ASH, IID, ANA, GOH, HAY, KAZ, NEB, and IRI. ODA has the highest value of 0.974719314, while IRI has the lowest value of 0.070034061. The median value is 0.1137, and the mean value is 0.1796. There are four stations above the mean value, which are ODA, KAM, KOZ, and MID, while the other 14 stations are below the mean value.
In the place dimension, ranked from highest to lowest are ODA, MID, KAM, ISA, ASH, TOM, HAK, GOH, HOT, IID, KAY, SHI, HAY, ANA, KAZ, KOZ, IRI, and NEB. ODA remains at the top, while NEB is at the bottom. The median value is 0.2181, and the mean value is 0.2963. There are six stations above the mean value, which are ODA, MID, KAM, ISA, ASH, and TOM, while the other 12 stations are below the mean value.
In the ecology dimension, ranked from highest to lowest are NEB, KOZ, IRI, HAY, KAZ, MID, IID, ODA, GOH, HAK, ISA, HOT, ANA, KAY, ASH, KAM, TOM, and SHI. The ranking shows a significant change compared to the previous two dimensions. NEB is now in first place, while SHI is at the bottom. The median value in the ECO dimension is 0.1898, and the mean value is 0.2194. There are six stations above the mean value, which are NEB, KOZ, IRI, HAY, KAZ, and MID, while the other 12 stations are below the mean value.
Individual station results
The combined values of the node, place, and ecology dimensions, obtained by summing the 18 stations, allow us to produce a triangular radar plot (Figure S4). In the node–place–ecology model, only one station, ODA, is balanced in the node–place dimension. The stations that are biased toward the place dimension are KAM, SHI, ASH, HOT, TOM, KAY, HAK, MID, ISA, and GOH, a total of 10. And the stations that are biased toward the ecology dimension are KOZ, HAY, NEB, KAZ, IRI, IID, and ANA, a total of seven.
Construction of the node–place–ecology model
Results of node–place
To construct our final node–place–ecology model, we normalized the overall values of the NPEs of the 18 stations obtained after the weighting, once more (Figure S3). From this result, three 2D model maps of node–place, node–ecology, and ecology–place were produced in turn, as well as the final 3D model map of the node–place–ecology was constructed. ODA performs the most balanced in the node–place two-dimensional model, with a final score of 1.0 in both dimensions. KAM and MID are both place–unbalanced types, where their place value is far higher than their node value. The remaining stations are all in the dependence area.
Results of node–ecology
The node–ecology two-dimensional model we constructed did not include any stations in the stress zone or balance zone. ODA belongs to the node–unbalanced type, while HAY, KOZ, IRI, and NEB belong to the ecology–unbalanced type. It is worth mentioning that ODA scored 1.0 in the node dimension, but only 0.2996 in the ecology dimension, which is lower than that of IID, KAZ, MID, HAY, IRI, KOZ, and NEB, a total of seven stations. NEB performed the best in the ecology dimension with a score of 1.0. However, it ranked second to last in the node dimension with a score of 0.0113.
Results of ecology–place
In the constructed ecology–place two-dimensional model, the distribution of the 18 stations appears relatively scattered, without the large concentration seen in the node–place and node–ecology models. However, similarly, no stations in the stress zone appear in the ecology–place two-dimensional model.
Results of node–place–ecology
In the complete node–place–ecology three-dimensional model, it is clear that NEB, KOZ, IRI, HAY, ODA, and MID are in a relatively independent state, while the remaining stations are highly clustered together. The quantitative indicators for the 18 stations can also be observed that the 11 stations KAZ, IID, GOH, HOT, HAK, ANA, KAY, ISA, ASH, TOM, and SHI have relatively average and low development areas for all three dimensions.
Discussion
For ease of comparison and discussion of the 18 stations, we have created the figure of the Odawara official for the 18 stations based on the Odawara City Location Optimization Plan (Supplementary Material).
As shown in Figure S6, Odawara officials have planned four centers to guide regional optimization. However, by evaluating the node–place–ecology model we developed above, we found that there are parts of the station area that do not match the officials' expectations. Surprisingly, despite not being explicit as a central transfer station, the overall ranking of MID is second only to ODA. In large part because the distance between the ODA and MID is less than 600 m according to the TOD areas definition above, many of their indicators will partially overlap.
However, in these four city center areas, KAY differs the most from the official's planning expectations and the overall value is ranked at 15th. In the constructed node–place–ecology model, KAY is located within the cluster of 11 stations: KAZ, IID, GOH, HOT, HAK, ANA, KAY, ISA, ASH, TOM, and SHI. This means that, KAY's classification within the four city center areas is not reflective of its actual status, and it exhibits considerable homogeneity with most of the other stations.
In addition to regional center area, neighborhood center area, and city center area, the official has planned four living center areas. Among them, the combined area of ASH and ISA (ASH-ISA) is more in line with the positioning of Level 3 area. Especially, ISA’s comprehensive ranking is ranked 5th, performing strongly in both node and place. This is because this area is within the radiation range of ODA, KAM, and TOM-HOT.
As shown in Figure S7, in order to explore how the introduction of the ecology dimension affects the results, we specifically remove the ecology dimension and keep only the node–place, which is used to compare the node–place–ecology. After removing the ecology dimension, only five of the 18 stations remain unchanged, with the remaining 13 undergoing varying degrees of change. However, even if the ecology dimension is removed, there is some way out with the Odawara official plan. Notably, both ASH-ISA, classified as a living center area, moved up four and one place, respectively. It is evident that this surpasses their initial expectations as living center areas. It can be seen that the introduction of the ecology dimension has a significant impact on the construction of the original node–place two-dimensional model. In fact, it is also easy to observe that the higher the node–place is in the station, the lower the position of the ecology dimension is correspondingly, which also shows that the prosperity of the station area can, to a certain extent, lead to a different degree of weakening of its ecology. This is because the enhanced functionality of the transportation system and the increased diversity in land use often result in the sacrifice of some ecological aspects in suburban areas. For instance, certain green spaces are developed into new transportation hubs and real estate projects to accommodate a larger influx of people. This also serves as a reminder that regional development should not be pursued at the expense of the environment but rather should be balanced with ecological benefits in order to create a better living environment. Simultaneously, the triangular radar chart (Figure S4) generated through the NPE model calculations can distinctly visualize the current-stage inclinations of each station in the three dimensions. Generally, if a station area has an equal distribution of 1:1:1 across the three dimensions of the NPE model, it can be indicative of being in a sustainable state of balanced development (according to the architecture of the node–place model above, a ratio greater or less than one to one results in an imbalanced state). When an imbalance occurs in any dimension, policy intervention becomes necessary. For instance, if the ecology value of NEB significantly takes precedence, then theoretically, policy formulation should focus on enhancing the node and place dimensions. And how to effectively improve this can be directly informed by the specific components encompassed within the selected indicators.
Conclusion
As mentioned in the theoretical background, the emergence of the node–place model takes into account the comprehensive value of TOD across different urban areas. This is approached from the perspective of operational efficiency of the urban transportation system (node dimension) and the surrounding land use and population characteristics (place dimension). Subsequently, the development of concepts such as “sustainable TOD” and “green TOD,” while further refining indicators to address environmental issues related to station area development, still encounters limitations in the selection of indicators within the framework of the node–place model. As a result, the ultimate calculated outcomes often struggle to precisely reflect the demands for sustainability and environmental friendliness to a certain extent. More significantly, both sustainable TOD and green TOD primarily focus on urban center, with limited attention given to suburban areas, particularly the ecological imbalances caused by suburban development. Addressing these issues, this study has innovatively introduced a new dimension, “ecology,” while retaining the existing node and place dimensions. This new dimension incorporates refined ecological indicators and enables a comprehensive assessment of performance indicators for each station across the node, place, and ecology dimensions. This innovative approach has been applied in Odawara, a suburban city within the Tokyo metropolitan area, where a comprehensive indicator system has been established to address its abundant ecological features. Based on these analyses, the development potential of each station in the node–place–ecology dimensions has been clarified, and more targeted recommendations have been provided for decision-makers to improve the sustainability of future stations.
Lastly, it is important to clarify that this TOD assessment model, which is capable of calculating and outputting results related to ecological aspects and ultimately assists in policy formulation, is still an initial model and, at this stage, remains subject to limitations. There are three main points: The first is the collection of raw data. While this study has been supported by on-site investigations, it still relies on open-source databases from government and relevant institutions. This has led us to forego certain meaningful indicators, such as noise pollution and building energy consumption. The second is the relatively limited sample size for discussion. Within Odawara city, which represents just one of the suburban areas in the Tokyo metropolitan area, there are only 18 stations available for analysis, making it challenging to conduct a more comprehensive comparison. For instance, when considering ecological aspects like rainfall and carbon emissions, the variation and fluctuations among the 18 monitoring stations are nearly negligible. The third is the NPE model, as a quantitative model, is currently capable of calculating values for the three dimensions, serving to assess whether the development of a specific stage in the station area is in equilibrium. However, how the dynamic development of the station area over a timeline should be monitored still remains a question mark. In the midst of such dynamic changes, whether it is possible to infer the effectiveness of policy interventions by official and urban policymakers through observing the shifts of station areas within the model is a question we need to address.
Supplemental Material
Supplemental Material - Developing a TOD assessment model based on node–place–ecology for suburban areas of metropolitan cities: A case in Odawara
Supplemental Material for Developing a TOD assessment model based on node–place–ecology for suburban areas of metropolitan cities: A case in Odawara by Weiyao Yang, Wanglin Yan, Lihua Chen, Haichen Wei and Shuang Gan in Environment and Planning B: Urban Analytics and City Science
Footnotes
Declaration of conflicting interests
The author(s) declared no potential conflicts of interest with respect to the research, authorship, and/or publication of this article.
Funding
The author(s) received no financial support for the research, authorship, and/or publication of this article.
Data availability statement
Supplemental Material
Supplemental material for this article is available online.
References
Supplementary Material
Please find the following supplemental material available below.
For Open Access articles published under a Creative Commons License, all supplemental material carries the same license as the article it is associated with.
For non-Open Access articles published, all supplemental material carries a non-exclusive license, and permission requests for re-use of supplemental material or any part of supplemental material shall be sent directly to the copyright owner as specified in the copyright notice associated with the article.