
Abstract
The present study compared the dimensionality and viability of Cuéllar, Arnold, and Maldonado’s 18-item Marginality Scale to the recently proposed 17-item revision of this scale by Gutierrez, Franco, Powell, Peterson, and Reid. Confirmatory factor analyses indicated that a 15-item 3-factor solution based on Cuéllar et al. and a 17-item 2-factor solution based on Gutierrez et al. both produced adequate fits to the data. However, MANOVA results using Acculturation Rating Scale for Mexican Americans–II (ARSMA-II) Scale-1 acculturation typologies (separation, assimilation, integration, and marginalization) to form separate groups showed more sensitive differentiation with the Cuéllar et al. three-subscale structure (Anglo Marginalization, Mexican Marginalization, and Mexican American Marginalization) than the Gutierrez et al. two-subscale structure (Dominant Culture Marginality and Native Culture Marginality). Implications for future research were discussed.
The construct of acculturation has received both empirical and theoretical scrutiny in the behavioral and health science fields for over eight decades. Anthropologists Redfield, Linton, and Herskovits (1936) operationalized acculturation as the process of two different cultural groups engaging in regular intercultural contact. This acculturative perspective influenced much of the early theoretical work including the seven-stage linear acculturation model of Gordon (1964) and Graves’s (1967) formulation of individual psychological acculturation.
A variety of antecedent contextual conditions influence and regulate acculturative phenomena. These contextual antecedents include volitional intent (e.g., travel abroad), fluidity (e.g., immigration), perpetuity (e.g., duration), pecuniary aspects (e.g., financial resources), oppression (e.g., perceived racism/discrimination), and similarity (e.g., linguistic/cultural; Gamst, Liang, & Der-Karabetian, 2011). Such cultural parameters serve to help modulate the quality and intensity of contact individuals experience with the new culture.
The acculturation measurement literature has historically focused on both the directionality of acculturation and lifestyle changes associated with acculturation (e.g., Cuéllar, Arnold, & Maldonado, 1995; B. S. K. Kim & Abreu, 2001; Padilla, 1980; Wallace, Pomery, Latimer, Martinez, & Salovey, 2010; Yoon, Langrehr, & Ong, 2011; Zane & Mak, 2003). Through the development of unidirectional and bidirectional models of acculturation (Flannery, Reise, & Yu, 2001), investigators have attempted to explain the interplay within individuals between their culture of origin and their new culture.
Unidirectional models view the course of acculturation as a linear (zero-sum) process where individuals surrender their culture of origin in favor of their new culture (Cuéllar, Harris, & Jasso, 1980; Gordon, 1964; Rogler, Cortes, & Malgady, 1991). Alternatively, bidirectional models (Berry, 1980, 2003; Berry & Sam, 1997; Cuéllar et al., 1995; Marin & Gamba, 1996) posit the simultaneous and relatively independent acculturation processes affecting how individuals stand with respect to both their culture of origin and their new culture. The most influential of these bidirectional models is Berry’s (1990, 2003) formulation that acculturating individuals adopt one of four mutually exclusive acculturation strategies: (a) separation, where traditional individuals maintain strong positive ties with their culture of origin and do not associate with their new culture; (b) assimilation, where “Americanized” individuals reject their culture of origin and embrace their new culture; (c) integration, where bicultural individuals relate well to both their culture of origin and their new culture; and (d) marginalization, where alienated individuals do not relate to either their culture of origin or their new culture.
Acculturative lifestyle changes are typically assessed through a variety of sociocultural features that include language, daily habits, living arrangements, ethnic norms, social relationships, political alliances, and religious affiliations (Gamst et al., 2011; Lam, 1995; Rivera, 2008). These individual acculturative lifestyle transitions occur and are often assessed within the three psychological dimensions of attitudes, knowledge, and behavior.
Acculturation measurement over the last several decades has progressed from assessing single variables that are presumed to be proxies for acculturation, such as language use or generational status, to unidirectional (linear) measurements (e.g., Cuéllar et al., 1980), to multidimensional assessments (e.g., Cuéllar et al., 1995). Generally, it appears that multidimensional acculturation instruments and models are on the ascendancy within the empirical literature (Gamst et al., 2011) for various ethnic and racial groups. One of the most influential Latino/a American multidimensional acculturation instruments has been the Acculturation Rating Scale for Mexican Americans–II (ARSMA-II; Cuéllar et al., 1995). The ARSMA-II follows the Berry (1980, 1990) model by measuring four acculturation strategies: separation, assimilation, integration, and marginalization within its 30-item Scale 1. This scale has extensive evidence of psychometric validity and reliability to its credit, and has stimulated development of a brief (12-item) version (Bauman, 2005; Lopez, 2009).
One construct that has emerged within the acculturation literature is marginality, although it has a complicated and controversial history in the behavioral science literature (see, Goldberg, 2012). Robert Park (1928) proposed the idea of “marginal man” to represent individuals not quite breaking from their original culture and not quite being accepted into the new culture in which they currently reside. Stonequist (1937) elaborated on the potential societal consequences of marginality, where individuals in cultural conflict may attempt to jettison aspects of their culture of origin while simultaneously feeling rejected by the new culture. Since then, there has been a multidecade discourse (Del Pilar & Udasco, 2004) on this topic. Several investigators have questioned the validity and reliability of the marginality construct (e.g., Braithwaite, 1960; Cullen & Pretes, 2000; Del Pilar & Udasco, 2004; Dickie-Clark, 1966; Golovensky, 1952; Green, 1947; Mann, 1973; Reuter, 1940; Wright & Wright, 1972), whereas others (e.g., Castillo, Conoley, Brossart, & Quiros, 2007; Gutierrez, Franco, Powell, Peterson, & Reid, 2009; S. Y. Kim, Gonzales, Stroh, & Wang, 2006; Mohanty & Newhill, 2011) have reported considerable empirical support for the validity and usefulness of the construct.
Marginality has been operationalized on the basis of a number of scales (Castillo et al., 2007; Cuéllar et al., 1995; Kerckhoff & McCormick, 1955; Mann, 1958; Ziller, 1973). One relatively recent effort to measure the construct was that of Cuéllar et al. (1995). These researchers developed a Marginality Scale or Scale 2 as part of the ARSMA-II that was designed to further explicate the separation and marginalization strategies ostensibly identified with their Acculturation Scale 1. The items on Scale 2 are divided into three parallel sets of six items each. Items in each set have the same wording except that each set specifies a different reference group: the first (Items 1-6), second (Items 7-12), and third (Items 13-18) sets of six items address Anglo-Americans, Mexicans, and Mexican Americans, respectively (e.g., “I have difficulty accepting certain attitudes held by [Anglos/Mexicans/Mexican Americans].”). Cuéllar et al. indicated that the items comprised three factors mapping to the reference group wording, that is, Anglo-American Marginality, Mexican American Marginality, and Mexican Marginality were said to represent separate factors and would thus comprise separate subscales in scoring the inventory. Cuéllar et al. acknowledged the ephemeral quality of Scale 2 when they noted, “The Marginality Scale is for the most part an experimental scale and should be considered as such until it can be adequately validated” (p. 283).
Gutierrez et al. (2009) assessed the structure of the revised ARSMA-II Scale 2 through confirmatory factor analysis. These researchers evaluated two alternative structures, a three-factor model based on Cuéllar et al. with each factor containing 6 items, and a one-factor (unidimensional) model containing all 18 items, and reported that neither model fit the data adequately. Finding a lack of fit, Gutierrez et al. performed their own exploratory factor analysis, which resulted in two factors that excluded one of the inventory items (Item 6). One factor was labeled Dominant Culture Marginality and corresponded to the Anglo-American Marginality subscale (without Item 6) that Cuéllar et al. proposed. The other factor, labeled Native Culture Marginality, combined Cuéllar et al.’s Mexican Marginality and Mexican American Marginality factors into a single factor.
The present study focused on the structure of the Cuéllar et al. (1995) Marginality Scale (Scale 2) of the ARSMA-II. Our purpose was to use confirmatory factor analysis to evaluate and compare a three-factor structure based on Cuéllar et al. and a two-factor model based on Gutierrez et al. (2009).
Method
Participants
The participants and data set were part of a larger study (Gamst et al., 2002) that examined various parameters of the Multicultural Assessment Intervention Process (MAIP) model (see, Dana, 2014) as it applied to a community mental health center in Southern California. Participants in the present study were the 217 Latino/a American adult outpatient clients or parents/caregivers of child clients who utilized Tri-City Mental Health Center (TCMHC). These 217 participants included 53.3% regular adult clients and 46.7% surrogate child clients who were the parent/caregivers of Latino/a American child clients (6 to 17 years of age) receiving outpatient mental health services at TCMHC. Participants’ gender was 45.2% male and 54.8% female. Participant age ranged from 18 to 76 (M = 38.61, SD = 14.37). Client respondents received the following primary diagnostic classifications: mood disorder (40.6%), schizophrenia (17.8%), childhood diagnosis (16.8%), adjustment disorder (10.4%), anxiety disorder (8.9%), eating disorder (4.5%), and other (1.0%). These client respondents participated in the following treatment programs: outpatient (47.1%), specialty treatment (29.9%), psychiatry (16.2%), crisis (3.9%), and day treatment (2.9%).
Procedure
The clients or parents/caregivers were given a questionnaire to assess their cultural background at the time of their regularly scheduled visit to TCMHC. Participants signed a consent form and also indicated whether they were willing to participate at this time. All questionnaire items were provided in both English and Spanish. The questionnaire included basic demographic and descriptive items about the client, the Cuéllar et al. (1995) ARSMA-II with 30 Scale-1 items and 18 Scale-2 items, and other information not examined in the present study. A total of 6 respondents chose not to participate and 12 additional respondents were eliminated for not following instructions in completing the questionnaire, leaving a total of 199 contributing data to the analyses.
Measures
Acculturation Rating Scale for Mexican Americans
Both Scale 1 and Scale 2 of the ARSMA-II (Cuéllar et al., 1995) were used in this study. All items on each scale were rated on a 5-point summative response scale ranging from 1 (not at all) to 5 (extremely often or almost always). Scale 1 has two subscales: the Mexican Orientation Subscale (MOS) and the Anglo Orientation Subscale (AOS). The MOS (Cronbach’s alpha = .89) consists of 17 items and the AOS (Cronbach’s alpha = .93) consists of 13 items. The Marginality Scale 2 has 18 items that assess attitudes and behaviors related to Anglo-Americans, Mexicans, and Mexican Americans in successive sets of 6 items, respectively. It was these 18 items that were subjected to the confirmatory factor analyses reported here.
Results
Data Merging
The adult clients (n = 106) completed the ARSMA-II scales for themselves and adult family members or caseworkers completed the ARSMA-II scales for the children (n = 93). The means, standard deviations, and correlations of the items were virtually the same for the surrogate child-based and the adult data sets, and so the data were combined to yield a combined sample size of 199 Latino/a Americans for the analyses reported here.
Confirmatory Factor Analyses
Strategy for assessing each model
We used IBM SPSS Amos Version 21 to perform the confirmatory factor analyses of the ARSMA-II Scale-2 items. Our general strategy in working with each model was to first assess a given model without specifying any correlations between errors associated with the indicator variables. Such lack of specification is an over-simplification in most situations because errors are often correlated for a variety of reasons (e.g., Brown & Moore, 2012; Kline, 2011; Wang & Wang, 2012), but determining in advance which errors are correlated is frequently difficult to do. Consequently, we used the software-suggested modifications to add to the model correlations of errors associated with indicator variables within a given factor, and evaluated the fit of the modified model; however, we never added correlations to errors that were associated with indicators in different factors.
Strategy for model trimming
Assessment of each of the two-and-three-factor models was performed in stages. For each model, we started with the most inclusive specification in terms of the number of items, and then modified the model by including correlations between errors and evaluated it. If the model fit was not satisfactory, we removed one item if it appeared justified based on an exploratory principal components analysis, evaluated the reduced model, and repeated this item-reduction process in an iterative fashion if it seemed to lead to a more acceptable fit.
Most researchers, such as Joreskog and Sorbom (1996) and Bentler (1990), advise against the sole use of the chi-square value in judging the overall fit of the model because of the sensitivity of chi square to sample size and to the presence of high correlations (Kenny, 2003). In the following analyses, the chi-square values were all statistically significant, but we report a set of recommended fit indexes to provide additional assessments of model fit (e.g., Kline, 2011; Meyers, Gamst, & Guarino, 2013; Schumacker & Lomax, 2004). The fit indexes we report are the Goodness of Fit Index (GFI), the Normed Fit Index (NFI), the Tucker-Lewis Index (TLI), the Comparative Fit Index (CFI), and the Root Mean Square Error of Approximation (RMSEA). Values for the GFI, NFI, TLI, and CFI of .95 or better are generally indicative of a good model fit; RMSEA values of .06, .08, and greater than .10 generally suggest, respectively, a good, adequate, and poor fit of the model to the data (West, Taylor, & Wu, 2012).
The three-factor model
The three-factor model proposed by Cuéllar et al. (1995) consists of the 18 ARSMA-II Scale-2 items, and this model was evaluated first. Our initial model fit indexes (before adding any correlations between errors) duplicated almost exactly those reported by Gutierrez et al. (2009), and indicated a poor level of fit to the data. Following our general strategy, we added to the initial 18-item model several correlations between errors of indicator variables within each factor, and assessed the model as thus modified. The chi-square value with its degrees of freedom and the set of other fit indexes are shown in the first numerical column of Table 1. Model fit improved substantially as a result of adding the correlations, as would be expected (e.g., the RMSEA achieved a revised value of .095 from its prior value of .131 in the model without correlated errors), but even then, it appeared that the 18-item model was still a poor fit to the data.
Fit Indexes for the Iterated Set of Three-Factor Models Based on Cuéllar, Arnold, and Maldonado (1995) and the Two-Factor Model Based on Gutierrez, Franco, Powell, Peterson, and Reid (2009).
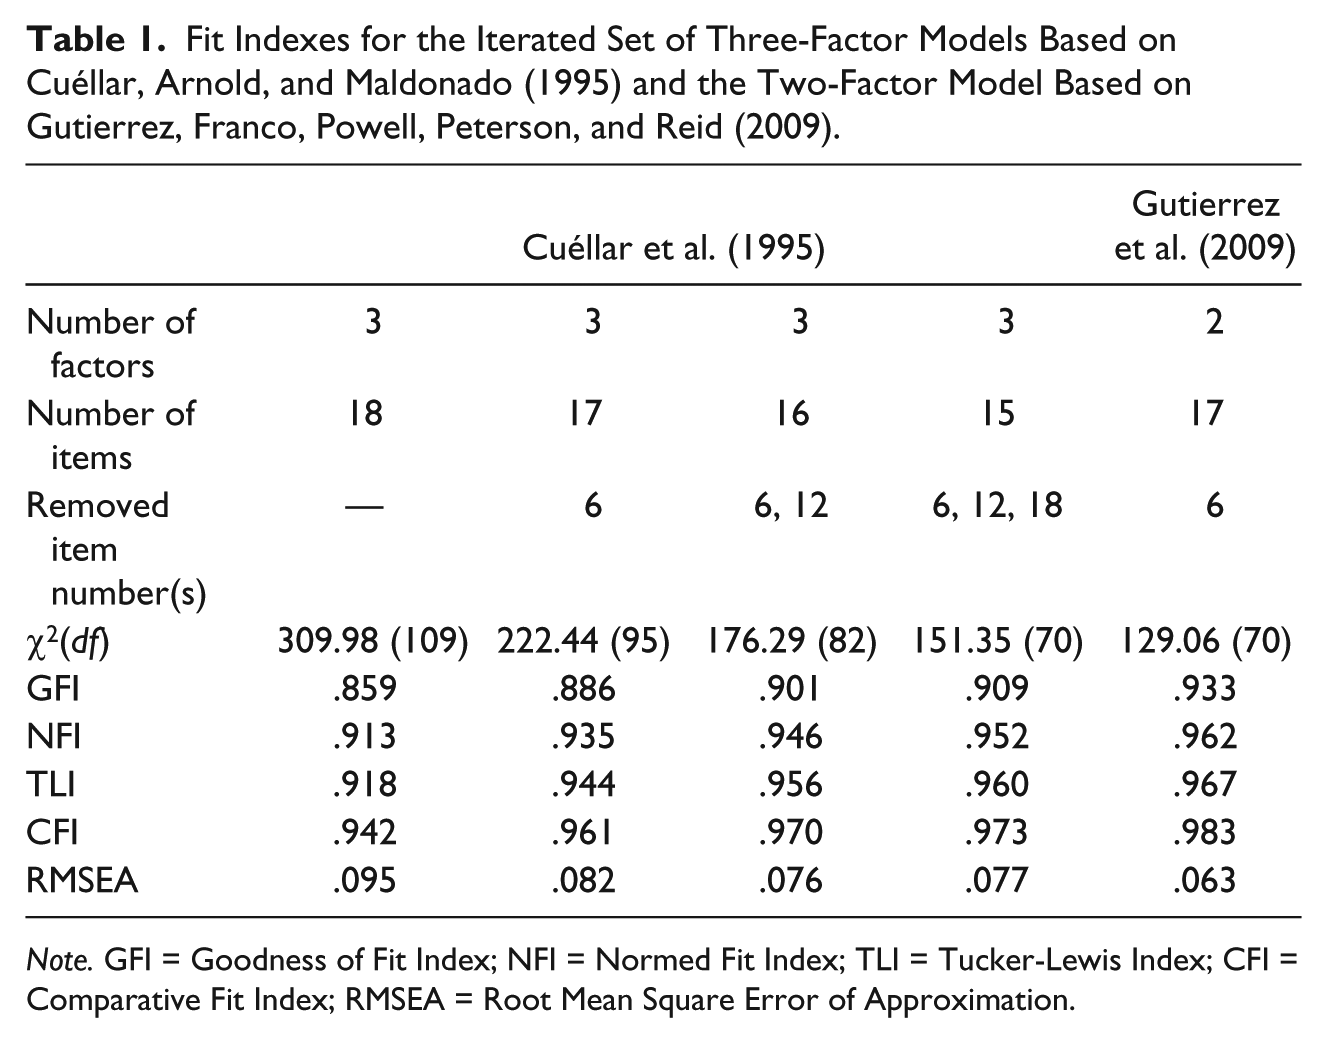
Note. GFI = Goodness of Fit Index; NFI = Normed Fit Index; TLI = Tucker-Lewis Index; CFI = Comparative Fit Index; RMSEA = Root Mean Square Error of Approximation.
To determine how to best trim the model, we followed the lead of Gutierrez et al. (2009) and performed a principal components analysis on the 18 ARSMA-II Scale-2 items, extracting and rotating three components using a promax procedure. The results showed three clear components, but indicated that Item 6 correlated .531 and .512, respectively, with the first and third promax rotated components. Because neither correlation was particularly strong and because of the virtually equal “cross loading,” that item was excluded from the model. It is worth noting that this is the same item Gutierrez et al. removed from the item set in their two-factor solution. After correlating errors of indicator variables within each factor, we achieved the fit indexes presented in the second numerical column of Table 1. As can be seen from the table, the fit was better with this 17-item set than with the full 18 items, but most of the indexes still suggested that the model fit was not good.
To further explore model-trimming options, we performed a principal components analysis on the remaining 17 ARSMA-II Scale-2 items, again requesting and rotating three components. In that analysis, Item 12 correlated less strongly (.689) with its primary rotated component than any of the other variables, and was removed from the model. The fit indexes for the 16-item model are shown in the third numerical column of Table 1. Fit improved over the 17-item model, and four of the indexes (NFI, TLI, CFI, and RMSEA) suggested a good or adequate fit of the model to the data.
A principal components analysis of the 16 ARSMA-II Scale-2 items presented one last opportunity to trim the model further. Item 18 correlated with its primary promax rotated component at .735, whereas all of the other items correlated at or better than .835. As this suggested a little potential weakness remaining in the measurement model, we excluded this item from the configuration and performed the confirmatory analysis on the 15-item set. The model is shown in Figure 1 and the fit results are contained in the fourth numerical column of Table 1; with the exception of the GFI, the NFI, TLI, CFI, and RMSEA, all reached levels indicating a good or adequate fit of the model to the data. It is of interest that the three items excluded from this last analysis are themselves parallel; their wording is, “I have, or think I would have, difficulty accepting [Anglos/Mexicans/Mexican Americans] as close personal friends.”
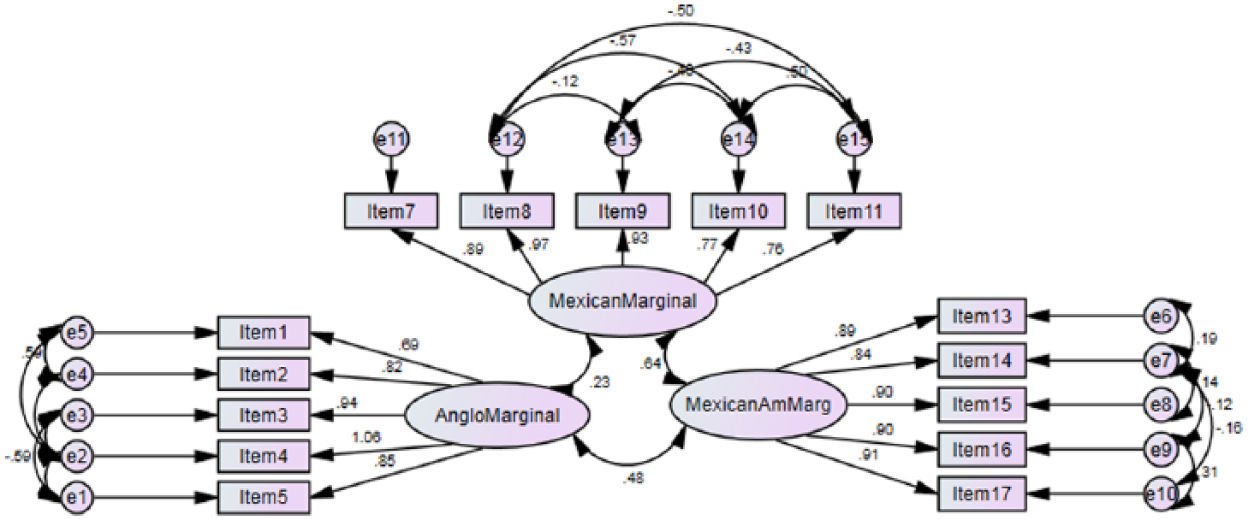
The final 15-item three-factor model based on the proposed structure of Cuéllar, Arnold, and Maldonado (1995).
The two-factor model
Gutierrez et al. (2009) had made a case for the viability of a 17-item two-factor model that excluded Item 6, and we tested this model in a confirmatory analysis. The results after we correlated the indicator variables within factors are shown in the last column of Table 1 and the model is pictured in Figure 2. As was the case for the 15-item three-factor model, the NFI, TLI, CFI, and RMSEA all reached levels indicating a good or adequate fit of the model to the data. Visual inspection suggested that the fit indexes for the two-component model were somewhat better than those for the 15-item three-component model. Given that result, no additional items were removed from the Gutierrez et al. two-component model.
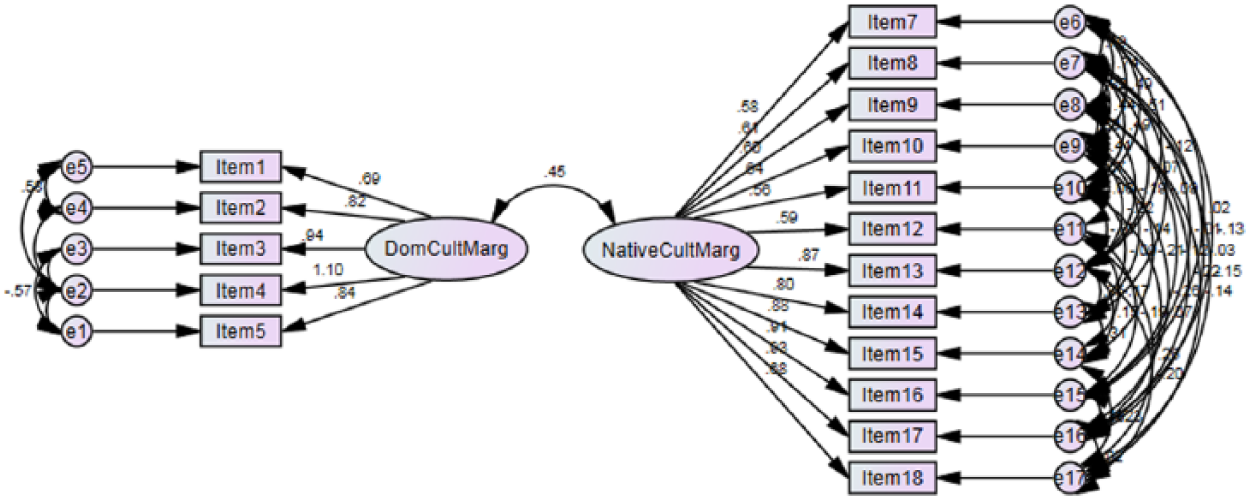
The 17-item two-factor model proposed by Gutierrez, Franco, Powell, Peterson, and Reid (2009).
Reliability Analyses
Because the item sets are intended to be used as subscales of the ARSMA-II Scale-2 inventory, reliability analyses were performed on the item sets based on the 15-item three-factor structure and the 17-item two-factor structure. The results of these analyses are presented in Table 2. The Anglo Marginality subscale based on Cuéllar et al. (1995) and the Dominant Culture Marginality subscale based on Gutierrez et al. (2009) are identical. With just five items, coefficient alpha is excellent and the mean interitem correlation of .712 indicates a good deal of commonality associated with the set of items. The Mexican Marginality and the Mexican American Marginality subscales of the Cuéllar et al. model each exhibited similar properties to that of the Anglo Marginality/Dominant Culture Marginality subscales.
Reliability Statistics for the Scales of the Three-Factor Model Based on Cuéllar, Arnold, and Maldonado (1995) and the Two-Factor Model Based on Gutierrez, Franco, Powell, Peterson, and Reid (2009).

The Native Culture Marginality subscale of Gutierrez et al. (2009) combines the Mexican and Mexican American Marginality subscales of Cuéllar et al. (1995). Its coefficient alpha was also quite robust, but its mean interitem correlation of .567 is the lowest of the subscales. Although still quite respectable, it does suggest relatively less communality of the items in this larger subscale. Such a result is not surprising in that this larger subscale combines two of Cuéllar et al.’s subscales. It is likely that the high coefficient alpha for the Native Culture Marginality may be driven somewhat more by the relatively larger number of items comprising the subscale and somewhat less by a unifying construct being measured by the items as a set (Gamst, Meyers, Burke, & Guarino, 2015).
Group Differences
One way to determine whether the Cuéllar et al. (1995) or the Gutierrez et al. (2009) model offers any advantage over the other is to determine the relationship of the subscales in each with one or more other relevant variables. Because the present data set represented a client intake procedure rather than a construct validation study of the ARSMA-II, only the Cuéllar et al. modes of acculturation typology, assessed by Scale 1 of the ARSMA-II, seemed to be useable for this purpose.
Scale 1 is composed of two subscales, the MOS and the AOS, and the four acculturation strategy typologies were computed based on the scores on these subscales; one participant did not have sufficient data to be classified, thus reducing our sample size to 198. The four groups in this typology and their classification based on the subscale scores are as follows: Marginalized individuals were those scoring below the median of both the MOS and the AOS (n = 20); High Integrated individuals were those scoring above the median of both the MOS and AOS (n = 21); Traditional individuals were those scoring above the median on MOS and below the median on AOS (n = 71); and Assimilated individuals were those scoring below the median on MOS and above the median on AOS (n = 78).
With the participants classified into the typology groups, we performed a one-way between subjects MANOVA for each set of subscales based on its respective model. In each MANOVA, the four groups of Cuéllar et al.’s (1995) typologies comprised the independent variable. In the first MANOVA, the three subscales based on Cuéllar et al.’s structure were used as dependent variables; in the second MANOVA, the two subscales based on Gutierrez et al.’s (2009) structure were used as dependent variables.
The Mexican Marginality subscale in the first analysis and the Native Culture Marginality subscale in the second analysis each violated the homogeneity of variance assumption. Three strategies were thus put into place in each analysis to deal with this lack of homogeneity. First, Pillai’s Trace was used to assess statistical significance for the multivariate effect of the Typology variable, as it is less sensitive to such violations than the other multivariate tests of statistical significance. Second, although we used a Bonferroni adjustment to evaluate statistical significance for the univariate effects (.017 in the three-subscale analysis and .025 in the two-subscale analysis), we increased the stringency of our correction for the Mexican Marginality and Native Culture Marginality subscales because of the homogeneity of variance violations. Third, multiple comparison tests of group mean differences for these two subscales (for those effects reaching statistical significance) were performed using Tamhane’s T2 test, as it accounts for violations of homogeneity of variance.
The omnibus MANOVA based on Cuéllar et al.’s (1995) three subscales yielded a statistically significant multivariate main effect for the Typology variable, Pillai’s Trace = .178, F(9, 582) = 4.073, p < .001. Of the three univariate effects, only the one for Mexican Marginality was statistically significant, F(3, 197) = 8.846, p < .001, eta2 = .12. There appeared to be meaningful distinctions between the groups on this subscale. The Tamhane test indicated that Assimilated Latino/a Americans (M = 2.59, SD = 1.15) reported stronger feelings of marginalization toward Mexicans than did Marginalized (M = 1.86, SD = 0.92) and Traditional (M = 1.76, SD = 0.94) Latino/a Americans. High Integrated Latino/a Americans (M = 2.45, SD = 1.41) did not differ significantly from the other groups.
The omnibus MANOVA based on Gutierrez et al.’s (2009) two subscales also yielded a statistically significant multivariate main effect for the Typology variable, Pillai’s Trace = .075, F(6, 388) = 2.530, p = .021. For the univariate effects, only the Native Culture Marginality subscale yielded any discernible trend, F(3, 197) = 3.035, p = .030; however, with a Bonferroni corrected alpha level of .025 (without even further correcting the alpha level for the violation of homogeneity of variance), it appeared that this effect was not statistically significant. The Tamhane results, which we would not be inclined to seriously consider given that the univariate main effect was not statistically significant but we report here simply to contrast any obtained trend with the results of the previous analysis, indicated only a borderline difference between the Assimilated and Traditional groups. Thus, the pattern of differences observed with the three subscales was substantially diluted when only two subscales were used to represent the item set.
Discussion
Overall, the confirmatory factor analyses suggested that a 15-item three-component solution based on Cuéllar et al. (1995) and a 17-item two-component solution based on Gutierrez et al. (2009) both produced adequate to good fits to the data. In isolation, it would be difficult to decide between the two, although the two-factor model appeared to result in a somewhat better fit. Subscales based on both models all yielded alpha coefficients that would be interpreted as indicating very good internal consistency.
But the judgment of the utility of the subscale structure of an inventory, while it should be based at least in part on criteria for model fit and subscale reliability, must also take into consideration the dynamics of the subscales in relating to other relevant constructs. The only relevant construct that could serve this purpose in our data set was the modes of acculturation typology model of Cuéllar et al. (1995). In mapping the two alternative subscale structures to this typology, Cuéllar et al.’s three-subscale structure was sensitive to differences among the groups, in that the groups were differentiated on the Mexican Marginality subscale. That we obtained stronger feelings of marginalization toward Mexicans on the part of Assimilated Latino/a Americans than either Marginalized and Traditional Latino/a Americans could indicate that Assimilated Latino/a Americans may have less contact with Mexicans, thus driving their more negative perceptions as compared with their more Traditional or Marginalized counterparts.
On the other hand, performance on Gutierrez et al.’s (2009) subscales did not effectively differentiate the groups on either of the two subscales based on that model. Thus, by combining the Mexican Marginality with the Mexican American Marginality subscales, a potentially important nuance may be lost, at least with respect to the typology of Cuéllar et al. (1995). A fresh data set should be used to determine the stability and generalizability of our confirmatory results. It is also the case that further research with additional constructs is clearly needed before any more definitive choice between the two models can be made. That said, the present results suggest that Cuéllar et al.’s three-factor structure for the ARSMA-II Scale 2 (given our minor modifications) appears viable, perhaps having, at least in some contexts, more potential utility than the model proposed by Gutierrez et al.
Cuéllar et al. (1995) designed the Marginality Scale to reflect the difficulty Latino/a Americans may have had accepting “ideas, beliefs, customs, and values” presumably held by Anglos, Mexicans, and Mexican Americans. Until recently (Gutierrez et al., 2009), this scale had received limited evaluation of its dimensionality. The present study appears to reinforce the Cuéllar et al. three-factor marginality conceptualization over the structure proposed by Gutierrez et al. (2009). Our findings appear to suggest that combining the Mexican and Mexican American subscales into a hybrid “Native Culture Marginality” subscale, as Gutierrez et al. recommend, may in fact collapse important marginality acculturative details.
The present study also adds to the ongoing discussion concerning the marginality construct itself (Del Pilar & Udasco, 2004). Our findings are consonant with those investigators (e.g., Castillo et al., 2007; Gutierrez et al., 2009; S. Y. Kim et al., 2006; Mohanty & Newhill, 2011) who have found empirical support for the marginality construct (variously defined). Our results are also in accordance with those of S. Y. Kim et al. (2006) who demonstrated the importance of differentiating Asian American marginality from Anglo and “heritage” marginality. The question of connection between Latino/a Americans and the new culture is an important one (Ojeda, Navarro, Rosales Meza, & Arbona, 2012; Padilla, 2006), and the present study furthers this discussion by extending the current measurement literature with this particular Latino/a cultural marginalization construct.
Nevertheless, the current study is not without limitations. First, our confirmatory analyses are based on a relatively small sample of Latino/a American adult community mental health clients and parent/caregivers of child clients, and may not be generalizable to the population of all adult Latino/a Americans. Second, additional variables should be examined with both versions (the present study’s modifications and Gutierrez et al.’s [2009] modifications) of the Cuéllar et al. (1995) Scale 2.
Footnotes
Declaration of Conflicting Interests
The authors declared no potential conflicts of interest with respect to the research, authorship, and/or publication of this article.
Funding
The authors received no financial support for the research, authorship, and/or publication of this article.