
Abstract
Recently, there has been a surge of national attention toward the U.S.-Mexican border in South Texas, known as the Rio Grande Valley (RGV). Despite the attention and potential impact, which the wall would directly have on the RGV community, there has been no systemic attention paid to the opinions of the RGV residents regarding the proposed wall and other related immigration policies. This article, therefore, aims to fill this gap by comparing immigration policy attitudes in the borderland communities to both the national Hispanic and the general national populations. By utilizing original data from an RGV public opinion survey we conducted in 2018, our analysis shows that RGV residents hold more lenient immigration attitudes than do both the national Hispanic and the general populations. We utilize logistic regression analysis to further our understanding of the correlates of these attitudes across different samples. Our findings provide important policy and political implications.
Recently, there has been a surge of national attention toward the U.S.-Mexican border in South Texas, commonly known as the Rio Grande Valley (RGV). Although the southern border areas have often been a subject of a national debate about immigration, the recent attention to the RGV region is quite unprecedented. Since immigration resurfaced as a major national issue for the 2016 presidential election, controversies continue today. In January 2019, President Donald Trump declared a security and humanitarian crisis on the border in South Texas and called for funding to build a wall along the U.S.-Mexico border for the sake of national security. Amid the national turmoil around the government shutdown and privately funded border wall construction, the “porous” border in South Texas will continue to be on the national political agenda beyond the 2020 presidential election.
Despite the importance of the region to the national controversy, however, it is surprising that we lack adequate and systemic attention paid to the opinion of the RGV residents regarding the proposed wall and other related immigration policies. Only anecdotal evidence sparsely reveals the local sentiments. In that regard, this article aims to fill this gap by providing a systemic analysis of public opinion in the most porous region in the U.S.-Mexico border in a comparative perspective. What attitudes do RGV residents have toward U.S.-Mexico border security and undocumented immigrants? How is that different from the general public and national Hispanic population? More importantly, what accounts for their attitudes toward immigration-related issues? Are there different mechanisms at work in this region compared to the outside of the RGV?
Existing studies of American public opinion on immigration imply that residing in border regions should have a distinctive influence on individuals’ immigration policy attitudes. Residential contexts, such as growth of immigration, immigration population size, and frequency of intergroup contact, are known to be some of the most influential factors that shape immigration preferences (Collingwood & O’Brien Gonzalez, 2019; Enos, 2014; Hopkins, 2010; Newman, 2013; Pearson-Merkowitz et al., 2016; Rocha et al., 2011). In this most porous section of U.S.-Mexico border areas, characterized by high levels of transborder mobility, large immigrant population, and high concentration of Hispanic population, we believe residency along the U.S.-Mexico border in South Texas should play a crucial role in forming unique immigration policy attitudes.
Furthermore, the existing research suggests that Hispanic public opinion tends to be divergent from that of Anglos (Greene & Kim, 2019; Huo et al., 2018; Rocha et al., 2011, 2015) and various factors contribute to variation of immigration attitudes among Hispanic population (Binder et al., 1997; Rocha et al., 2015; Schildkraut et al., 2019; Stringer, 2018). Based on this, we expect that the RGV public opinion should not be only distinctive from white Caucasian opinions, but also from the national Hispanic population. While most Hispanic opinion is contextualized as a minority opinion at the national level, the situation is opposite in the RGV. According to the U.S. Census estimates in 2018, the Hispanic or Latino residents account for about 93% in the RGV areas. This study by providing an in-depth analysis of the RGV public opinion focusing on the U.S. immigration policy and border wall sheds light on how this majority-minority racial context affects public opinion and policy attitudes.
In order to explore the RGV public opinion, we conducted a survey of RGV residents in 2018. 1 This data set provides an exclusive opportunity to explore immigration attitudes of the local residents and compare them to the national Hispanic population as well as the general population. Utilizing other surveys, including the Pew Political Survey and the National Survey of Latinos, we examine the RGV opinion in a comparative perspective and locate it in relation to the general national population as well as the national Hispanic population. The descriptive statistics are generally aligned with our expectation that RGV residents tend to have more lenient immigration attitudes than the general public. It is also found that the attitudes of RGV residents are somewhat similar to the national Hispanic population. We expand our analysis to see what factors are associated with the leniency of RGV residents.
A logistic regression analysis of the correlates regarding the opposition to a border wall reveals some interesting findings. First, the border issue is highly politicized, thus polarized along both partisan and ideological cleavages. Conservatives and Republicans favor the construction of a border wall while liberals and Democrats oppose it. This pattern is consistent across the different samples: RGV, national Hispanic, and national non-Hispanic populations. Second, in line with conventional wisdom, education does have a liberalizing effect on the national non-Hispanic population. However, it does not have the same effect on the national Hispanic population and has the opposite effect on RGV Hispanic residents. Education significantly reduces the opposition to the construction of a border wall among RGV Hispanic residents. Lastly, while national Hispanics who were born in foreign countries are more likely to oppose the border wall construction, the same status does not have any meaningful effect in the RGV. From the analysis of the correlates, we can conclude that Democratic Party identification, ideological liberalism, and skepticism concerning the impact of a border wall make a strong basis for lenient attitudes toward U.S.-Mexico border policy. However, the effects of some factors and their magnitude differ across the samples we examine.
Immigration Attitudes: Rio Grande Valley, National Hispanic and National General Populations
There are not many studies done on public opinion in border areas. The lack of scholarly attention becomes more pronounced if we narrow down our focus to Hispanic communities in border areas. However, previous research suggests that it is important to study public opinion and policy attitudes focusing on this particular racial/ethnic group in border regions. For instance, it is known that residential contexts, such as the growth of immigration, the size of immigrant population, or the frequency of intergroup contact, shape individuals’ immigration attitudes (Collingwood & O’Brien Gonzelez, 2019; Enos, 2014; Hopkins, 2010; Newman, 2013; Pearson-Merkowitz et al., 2016; Rocha et al., 2011). For this reason, the focus of our study, the RGV located in the southmost section along the U.S.-Mexico border in Texas, provides an opportunity to examine the interaction of racial and residential contexts and how it affects policy attitudes.
In many aspects, the RGV provides unique racial and residential contexts. First, the three counties that are adjacent to the border have a predominantly Hispanic population. According to the U.S. Census Bureau, the estimated percentage of the Hispanic proportion of the population across these counties are about 93%. 2 Second, the RGV is highly mobile in terms of immigration. While the average percentage of native-born citizens across the U.S. counties is about 95%, the number goes down to 75% in four counties in South Texas (Cameron, Hidalgo, Willacy, and Starr). 3 Third, relatedly, the volume of the flow of people crossing the border daily is substantial. For instance, according to the Border Crossing and Entry Data provided by the U.S. Department of Transportation, approximately 1,163,000 persons entered the border through Brownsville port during December 2019. 4 How would these contextual factors affect immigration attitudes of RGV residents? Would they make RGV residents form different attitudes from the national Hispanic population and the general population? More importantly, would the dynamics of factors that shape immigration attitudes be different in the RGV compared to the national Hispanic and general populations?
Existing literature suggests that border residents tend to develop liberal attitudes toward immigration. For example, analyses about regional integration in Europe find that border residents display more positive opinions about the European Union than the rest of the population (Berezin & Díez-Medrano, 2008; Kuhn, 2012). Also, utilizing survey data on the Czech-German border areas, Mirwaldt (2010) shows that the bordering areas where people from both countries interact to a higher degree tend to produce more favorable attitudes than elsewhere in Germany toward the country beyond the border. The argument that the border regions would nurture more lenient immigration attitudes is also aligned well with the existing studies which show that Hispanic public opinion is different from that of Anglos (Greene & Kim, 2019; Huo et al., 2018; Rocha et al., 2011, 2015) and various factors contribute to variation of immigration attitudes among Hispanic population (Binder et al., 1997; Rocha et al., 2015; Schildkraut et al., 2019; Stringer, 2018).
Based on the previous studies, we expect the RGV public opinion in relation to immigration to be distinctive from the rest of the country. We further believe that there might be a difference between the RGV Hispanic population and the nationwide Hispanic population, which has not been explored previously in the literature. Given the fact that most studies treat Hispanic opinion as a minority opinion contextualized at the national level, we believe that even if the national Hispanic population shares a similar stance on immigration policy with Hispanics in the RGV, the mechanism of how these opinions are formed could be different from the RGV regions. For this purpose, this study aims to provide a systemic comparative analysis of immigration attitudes across not only different racial but also geographical samples by focusing on border security and border wall construction.
In the spring of 2018, we fielded a public opinion survey of RGV residents through the Center for Survey Research and Policy Analysis at the University of Texas Rio Grande Valley. Three questions were asked to gauge RGV residents’ opinion on immigration issues. First, we asked what the priority for U.S. immigration policy should be. The given options were: (1) Ensuring better border security and strengthening immigration enforcement; (2) Creating a way for undocumented immigrants living and working in the U.S. to obtain a legal resident status or citizenship if they meet certain requirements; or (3) both should be given equal priority. Second, the respondents were also asked if they are in favor of, or oppose, building a wall along the border to Mexico. Lastly, we asked respondents how respondents evaluate the effect of the border wall on immigration reduction. Three options were given: (1) a major reduction in immigration, (2) a minor reduction in immigration, and (3) no reduction in immigration. These questions follow the Pew Political Survey questions, which provide an exclusive opportunity to explore and compare how these attitudes differ across samples.
When we compare border security attitudes across different samples, RGV, RGV-Hispanic, National, and National-Hispanic populations, it clearly shows that RGV residents predominantly believe that the U.S. immigration policy should prioritize to find a way for undocumented immigrants to become legal residents or citizens when requirements are met. About 48% of RGV residents and 51% RGV Hispanics agreed with the statement. Only 11% (9% for Hispanics) respondents consider better border security and immigration enforcement should be the priority of U.S. immigration policy. According to the 2018 Pew Political Survey, 5 only 31% of the national public agree to provide a legal pathway for undocumented immigrants, while about 21% put more emphasis on the betterment of border security. This indicates that the RGV residents are more empathetic toward undocumented immigrants and hesitant to the idea of reinforcing border security than the general public. These differences are statistically significant at the 0.01 level. However, the national Hispanic population shows a similar sentiment to the RGV population. From the Hispanic subsample of the 2018 Pew Survey (216 respondents), we see that about 44% agreed to provide a legal pathway for the undocumented immigrants and its difference from the RGV residents (47% agreed) is not statistically significant.
Figure 1 presents the attitudes toward a border wall. According to the 2017 Pew Political Survey, approximately 63% of the general public opposes the construction of a border wall, while 34% favors it. The highest opposition can be found among RGV Hispanic residents (81.15%), followed by the general RGV residents (77.20%). The national Hispanic community shares a similar sentiment with the RGV community. According to the 2018 National Survey of Latinos, conducted by the Pew Research Institute, about 75% of the national Hispanic population is against the wall while 22% supports it. Similar to the issue of border security versus a legal pathway as a priority of U.S. immigration policy, the difference in the opposition to a border wall between RGV and the general public (14.48%) is statistically significant at the 0.01 level but not between RGV and national Hispanic samples (2.82%). However, the differences in those who favor the wall both between RGV public and Hispanic populations (5.23%) and between RGV Hispanic and national Hispanic population (8.14%) are statistically significant at a 0.01 level. In short, more Latinos nationwide are in favor of constructing a border wall than RGV residents in general and more so than RGV Latinos.
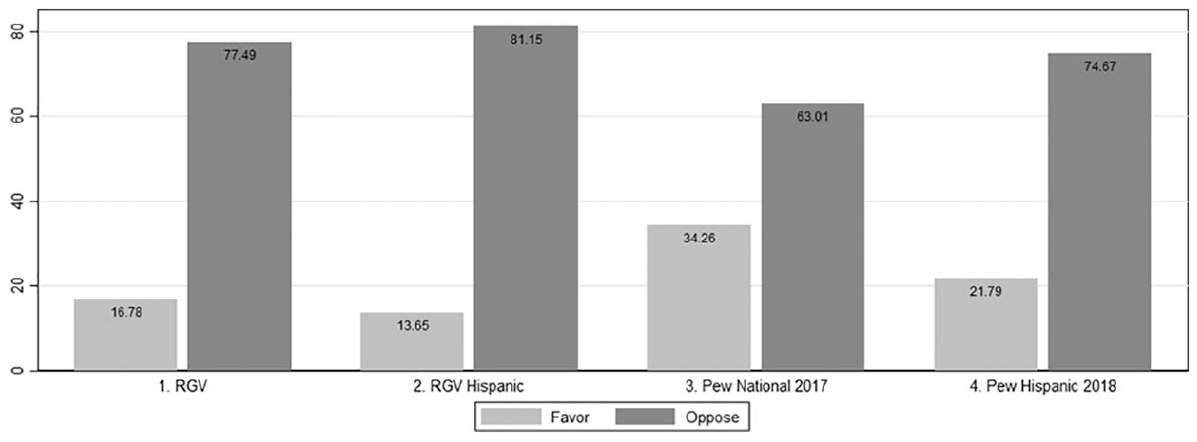
The U.S.-Mexico border wall.
In our survey, we asked a followup question to those who opposed a border wall as to why they were against it. Among the 474 respondents who expressed their opposition, 408 of them provided responses. About 59% of them (242 respondents) said that building a border wall is a waste of money because it would not work. For example, many of them stated, “waste of money,” “it would not work,” “people will still cross,” or “it won’t make much difference.” The second most stated response was that it would create the division of people (approximately 10%). Respondents stated, for instance, “it will separate a lot of families,” “we have families in Mexico,” or “there shouldn’t be a division.” It reflects the fact that the volume of transborder activities is high in the RGV through family ties, business, and other daily activities. The remaining statements include concerns about discrimination, racism, negative image of the country, and harmful effects on the environment and wildlife, etc.
Lastly, we gauge opinions on the effectiveness of a border wall. In line with the previous findings, the percentage of respondents who do not believe in the effect of a border wall is high in RGV areas. About 50% of RGV (51.7% RGV Hispanic) residents think that there would be no effect of a border wall on reducing immigration at all, whereas only 44% of the general population believes so. Interestingly, a slightly higher portion of the national Hispanic population shows a pessimistic view of the effectiveness of a wall (55.17%). 6 However, the difference between the RGV and the national Hispanic samples falls short of statistical significance. On the flip side, about 7%-8% more national Hispanic believe that a border wall will effectively reduce immigration than do RGV general and Hispanic populations. This is statistically significant at a 0.05 level.
Through the comparative analysis among RGV, general U.S., and national Hispanic populations, we are led to a simple conclusion. RGV residents in general hold more lenient attitudes toward immigration policy than the rest of the country, and this tendency becomes more evident among RGV Hispanics. About half of the respondents in our RGV sample believe that the government should find a way for undocumented immigrants to become legal residents or citizens when requirements are met. About four of five RGV residents oppose the construction of a border wall, and half of the respondents are skeptical about the effect of a wall in reducing immigration. These findings conform to our expectations and the implications of prior research. In the next section, we explore the individual-level factors that affect these attitudinal patterns across the RGV, general U.S. and national Hispanic samples. By doing so, we aim to examine if there are any different dynamics in the formation of immigration attitudes depending on racial and residential contexts.
The Correlates of Border Wall Opinions
In this section, we investigate the immigration attitudes of the RGV community more in depth at the individual level. What accounts for the variation of opinions among RGV residents? How are they similar to or different from the general population and the nationwide Hispanic population? In order to address these questions, we analyze our RGV survey data as well as the 2017 Pew Political Survey 7 and the 2018 National Survey of Latinos (Pew Research Center, 2018). These three data sets include the same question regarding the border wall construction, which allows us to compare the different populations. The pattern of border wall opinion largely conforms to that of the general immigration policy attitudes as discussed above. Thus, we plan to delve into the correlates of the opinion on a border wall across four different samples: RGV residents, RGV Hispanic residents, national Hispanic, and national non-Hispanic populations.
The dependent variable is a dichotomous measure of border wall opinion, which takes the value of one when respondents oppose the construction of a border wall and 0, otherwise. As dealing with multiple survey instruments, we need to be careful to include a standardized set of control variables that are available in all three different survey projects. First, we include five demographic variables: education, income, race, gender, and age. The education variable measures the highest level of education the respondent attained. It varies from “1” Never went to school to “7” Master’s or professional degree or higher in the RGV survey while it varies from “1” Less than high school to “8” Postgraduate or professional degree in both the Pew Political Survey and the National Survey of Latinos. The income variable measures each respondent’s household income. Again, this variable is operationalized on different scales by each survey: The RGV survey utilizes six categories of income, while the Pew Political Survey and the National Survey of Latinos utilize nine categories of income (We can provide specific coding rules for each survey upon request.). As for race of respondents, various measures are adopted depending on the availability and relevance of each data set. For the sample of RGV residents, we include a dichotomous variable for those who identify themselves as having a Hispanic origin. The same variable is not included in RGV Hispanic, national Hispanic, and national non-Hispanic models due to its irrelevance. For the national non-Hispanic sample, we include other racial categories, “Black” and “Other” (both dichotomous variables), leaving “non-Hispanic Whites” as a reference category. Gender is coded as a binary variable for females across the surveys. Lastly, age is measured as a continuous variable.
We also include a set of political variables in our analysis: political ideology and party identification. In both RGV and 2017 Pew surveys, respondents were asked to place themselves on the liberal-conservative ideological scale. Thus, ideology is measured as an ordinal variable, where higher values indicate conservatism. In the RGV sample, the variable is measured on a 1-7 scale, where “1” indicates Extremely liberal and “7” Extremely conservative. In the Pew Political Survey, the variable is measured on a 1-5 scale, where “1” means Very liberal and “5” Very conservative. Unfortunately, however, the 2018 National Survey of Latinos does not have a comparable ideology variable. In order to control for ideology, we employ a proxy using the question about religious service attendance measured on a 1-6 scale, where “1” means More than once a week and “6” means Never. We convert the scale so that higher values indicate more frequent attendance in religious services, suggesting conservatism. Although it is not a perfect proxy for ideology, we find this the best measure that is available in the data set.
With this caveat, we propose expectations as follows: Conservatives are more likely to favor the construction of a border wall than liberals. They are more likely to believe that the reinforcement of border security should be prioritized over the provision of a legal pathway to citizenship than their liberal counterparts. They are more likely to be optimistic about the effect of a border wall in reducing immigration flows than liberals. Lastly, we include two dichotomous variables for Republican and Democratic Party identifications, respectively. The reference category is independents. We expect that being Democrats leads to more opposition to the construction of a border wall compared to being Republicans.
Some additional control variables are also included in our analysis. First, we believe that immigration attitudes vary depending on the immigration status of respondents. Although the 2017 Pew Political Survey does provide data about citizenship status, only 6% of the respondents answered the question. In both RGV and the National Survey of Latinos, respondents were asked about their birthplace, instead of a citizenship status question. Thus, we create a dichotomous variable, foreign-born, for those who answered that question other than the United States. Of course, those who are born outside the U.S. could be citizens. However, following the existing literature, we expect that there will be a significant difference between foreign-born and native-born Latinos in their attitudes toward immigration (Rocha et al., 2011, 2015; Rouse et al., 2010; Sanchez, 2006; Stringer, 2016, 2018). Foreign-born Latinos are expected to have more lenient immigration attitudes than their native-born counterparts. Second, as discussed in the previous section, RGV residents oppose the construction of a border wall for many reasons. Among them, a significant portion of opposition was related to the skepticism on the effectiveness of the wall to reduce flows of immigration. Thus, we believe that controlling for its effect is important to see the dynamics of RGV immigration attitudes.
As the dependent variable is binary, we employ a logistic regression analysis with robust standard errors. The focus of the estimation is to compare the correlates of the opposition to the construction of a border wall across four different samples: RGV general, RGV Hispanic, national Hispanic, and national non-Hispanic. Although the RGV is a Hispanic dominant region, by excluding those who identify themselves as other category and missing observations, the percentage of Hispanic respondents in the RGV sample goes down to 78%, which gives us a reasonable subsample size for estimating the opinion of the RGV Hispanic population. We are interested in comparing its correlates to those of the national Hispanic community. Lastly, as we have both RGV Hispanic and national Hispanic samples, it would be analytically more interesting to compare these to the non-Hispanic general population. Thus, instead of the general population sample provided by the 2017 Pew Political Survey, we utilize non-Hispanic population sample by excluding Hispanic respondents from it.
Analysis and Results
Table 1 presents the results of the logistic regression analysis. Some interesting patterns emerge. First, the construction of a border wall turns out to be a highly salient and polarized issue along the ideological and partisan cleavages. Second, following conventional wisdom, education does have a liberalizing effect on the national non-Hispanic population. Interestingly, however, it does not have any influence on the national Hispanic population while having a conservatizing effect on RGV residents. Lastly, while foreign-born Hispanics in the national sample are more likely to oppose the border wall construction, the same status does not have any meaningful effect in the RGV. From the analysis of the correlates, we can conclude that both Democratic Party identification and widespread disbelief in the impact of a border wall make a strong basis for the opposition toward the proposed U.S.-Mexico border wall. We discuss each point in depth in the remainder of this section.
The Border Wall Opposition across Different Samples.
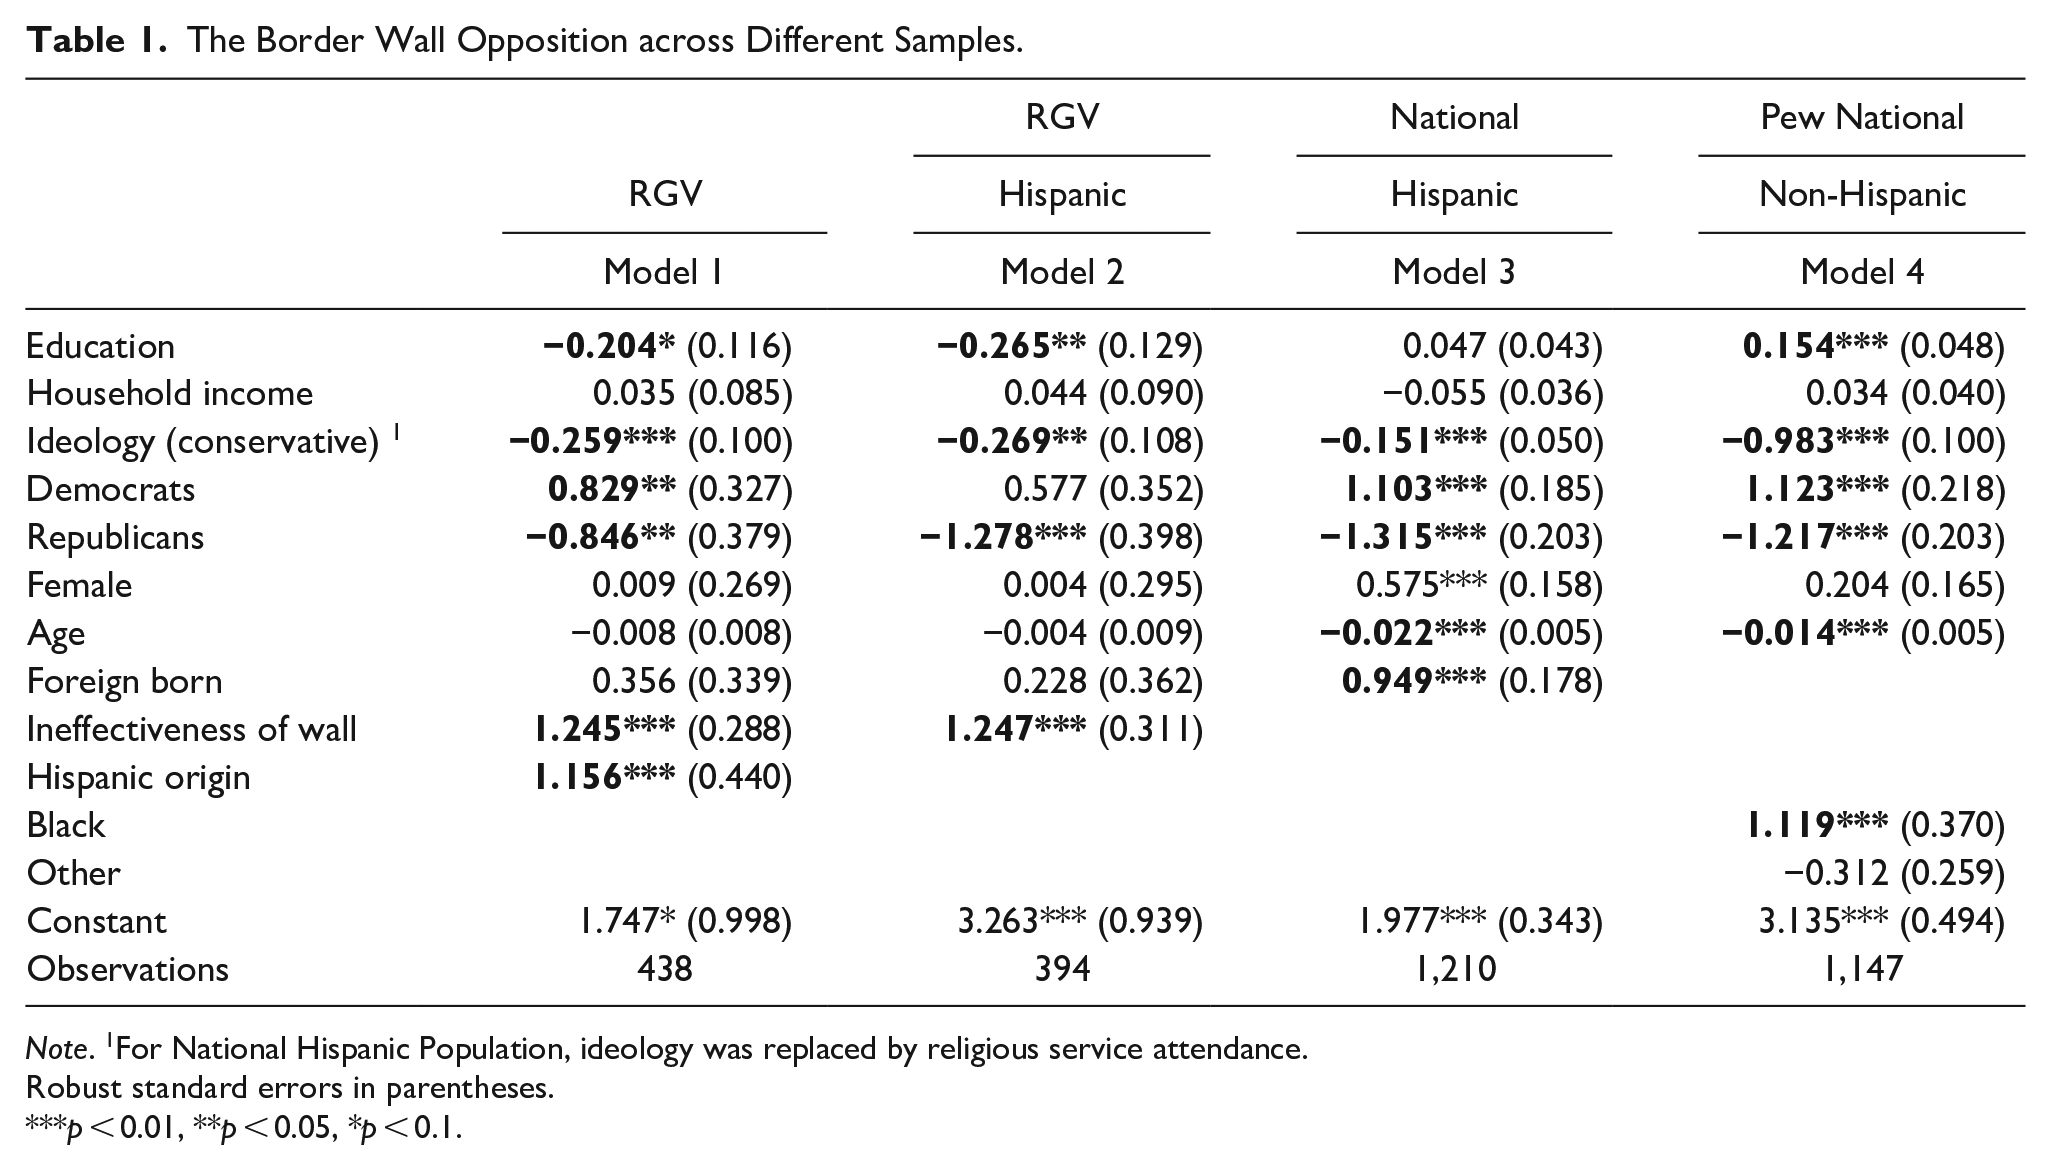
Note. 1For National Hispanic Population, ideology was replaced by religious service attendance.
Robust standard errors in parentheses.
p < 0.01, **p < 0.05, *p < 0.1.
It is not surprising to note that a border wall was a highly salient and polarized issue around 2018. Our comparative analysis of multiple data sets provide solid evidence for this point. As Table 1 shows, both conservatives and Republicans favor the border wall construction while liberals and Democrats are against it. This pattern is found consistently across all four samples. The regression coefficients of both ideology and Republicans are negative and statistically significant at a 0.01 level while the variable, Democrats, is positive and statistically significant except for the RGV Hispanics.
In Table 2, we calculate the marginal effects of party identification variables. While holding other variables at their mean values, Republicans are about 18 to 31% points more likely to approve the construction of a border wall than independents across samples. The differences in predicted probabilities for Republicans are smallest in the general RGV sample (18%), followed by RGV Hispanic Republicans (24%). We find the biggest marginal effect among national Hispanic Republicans (31%), followed by national non-Hispanic Republicans (30%). Thus, at the national level, Republicans with a Hispanic origin are about 31% more likely to approve a border wall than their independent counterparts, all else equal.
The Marginal Effect of Party Identification on Wall Opposition.

Democratic Party ID has an opposite effect on the opinion of a border wall. Democrats are more likely to oppose the wall regardless of locality. In the RGV, Democrats are about 11% more likely to oppose the construction of a border wall than independents. Among Hispanic and non-Hispanic populations in the nation, Democrats are about 16% and 20% more likely to oppose the wall than independents, respectively. There is one exception to this pattern. Interestingly, among RGV Hispanics, Democratic Party ID does not have any discernible difference from independents on the opposition of a border wall. As the RGV being a Hispanic dominant region, this suggests that the partisan cleavage on the border wall issue is driven by Republicans in the RGV.
A similar pattern is found with ideology. Table 1 shows that the ideology variable has a negative and statistically significant coefficient across all four samples. Given that we use a proxy variable, the frequency of religious service attendance, for the National Survey of Latinos and that it is difficult to pinpoint a reference category for getting marginal effects, we calculate predicted probabilities instead for each value of the ideology variable for respective surveys.
Table 3 presents the results. Across the samples, it is found that ideology has statistically significant effects on the opposition of a border wall by moving one standard deviation below and above the mean. For example, in the RGV sample, those who identify themselves as “Liberal” are about 19.4% more likely to oppose the wall than those who identify themselves as “Conservative”; the percentage difference slightly drops to 12% for RGV Hispanics. Although we should be cautious to make an inference from the proxy measure of ideology adopted for the national Hispanic population, we find a similar pattern. The more secular (liberal), the more against a border wall. The ideological cleavage around a border wall seems enormously profound among the national non-Hispanic population. Liberals are about 58% more likely to oppose the idea of border wall construction than conservatives in the national non-Hispanic population. These suggest that a border wall falls along the left-right ideological cleavage and the ideological chasm is deeper among non-Hispanic populations outside of the RGV.
The Predicted Probability of Ideology on Wall Opposition.

Other demographic variables also provide some interesting insights. The effect of education in the RGV stands out. In the literature of American public opinion, the general consensus is that education pushes one toward the liberal side of the ideological continuum. Model 4 in Table 1 confirms the conventional wisdom; education leads to the opposition to a border wall among the national non-Hispanic population. However, Model 3 in Table 1 suggests that education does not have any influence among the national Hispanic community. More interestingly, as suggested by Model 1 and Model 2, education turns out to have a conservative effect among RGV residents. Residents with higher levels of education are more supportive of a border wall in the RGV. In order to explore the dynamics, we calculate predicted probabilities across the different values of the education variable for both RGV Hispanic and national Hispanic samples.
Figure 2 displays the results. The negative trend on the probability of opposing the wall is apparent as the level of education progresses in the RGV Hispanic sample. The probability of opposing a border wall is above 90% among RGV Hispanics with no education at all and less than 9th grade education (lowest two categories of education). As the years of education increase, the predicted probability of opposing a wall decreases and becomes statistically at a 0.10 level at the education value of 5 (“some college”). Our findings complement those found by Binder et al. (1997) and Miller et al. (1984). On the other hand, we do not find a similar pattern among the national Hispanic population (see Appendix Figure A.1). Regardless of the levels of education, the predicted probability of opposing a border wall stays constant around 77%. For the national non-Hispanic sample, the predicted probability for the lowest education category, “Less than high school,” is about 52%. As education increases, the probability of opposition continues to rise, and the marginal effect becomes statistically significant at a 0.01 level when education reaches the level of 5 “Two years of an associate degree from a college”.
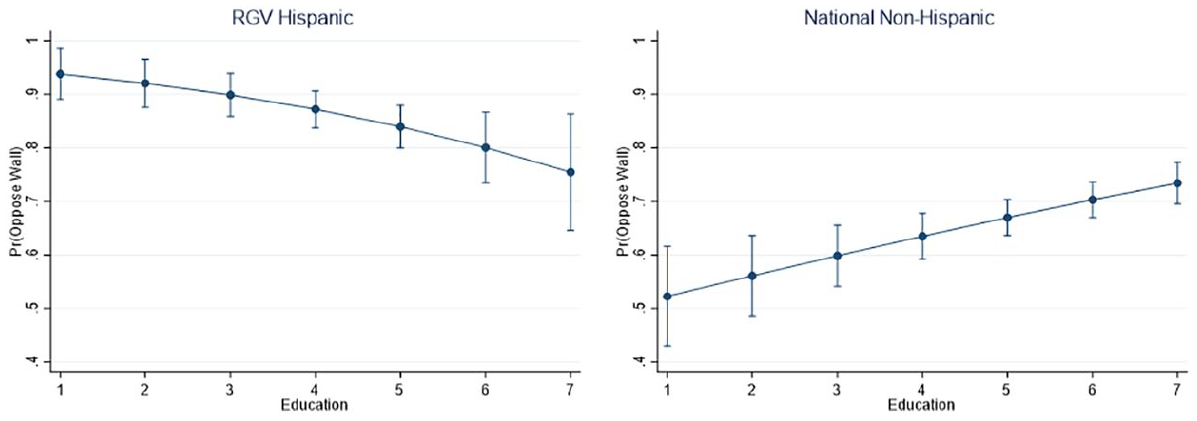
The Predicted Probabilities across Education: RGV Hispanic versus National Non-Hispanic.
Both gender and age have some interesting results. First, the female variable has a positive influence on the opposition to a border wall only for the national Hispanic population while it does not have any statistically significant effects in other samples. Our calculation of predicted probabilities suggests that nationwide, Latinas are about 8% more likely to oppose a border wall than Latino males, all else equal. The age variable yields the opposite pattern. Age has a negative and statistically significant coefficient in both national samples. As age increases, individuals tend to be more supportive of a border wall nationwide. However, age turns out to have no significant effect in the RGV samples.
We also include place of birth, coded as “Foreign Born.” In line with previous studies, Model 3 shows that foreign-born individuals tend to oppose the construction of a border wall more than those who were born in the U.S. It confirms that those who have immigration backgrounds are likely to be empathetic regarding immigration policy. Its coefficients in Models 1 and 2 do not reach a statistical significance but still their signs are positive. Relatedly, being Hispanic in the RGV sample seems to define individuals’ opinion on a border wall strongly as suggested by Model 1 of Table 1. Lastly, not surprisingly, skepticism on the effect of the border wall has a positive influence on the opposition to its construction. As discussed above, it is straightforward to expect that those who believe building a wall is a waste of money or it divides family ties would object the border wall construction.
Discussion
Since 2016, border security has emerged as one of the most hotly debated issues in American politics as President Trump focuses policy effort and resources on building a border wall. In the midst of the ongoing debate, however, public opinion in the U.S.-Mexico border regions is largely missing, although the proposed wall would impact these communities directly. In this regard, this article provides a missing piece to the current debate. Through the exploration of the 2018 RGV survey in comparison to the 2018 National Survey of Latinos and the 2017 Pew Political Survey, we systematically analyze immigration attitudes of the residents of the Rio Grande Valley. Largely in line with the previous research on borderlands, RGV residents hold a more lenient stance on immigration than those residing in the rest of the nation. The vast majority of the RGV residents display considerable opposition to the construction of a border wall, but a high level of support for the idea that grants a legal pathway for undocumented immigrants to become residents or citizens.
However, RGV opinions are hardly liberal monolithic, but some interesting variations are found in comparison to the national Hispanic and national non-Hispanic populations. First, unlike other areas of the country where education is associated with more liberal and empathetic immigration attitudes, education tends to foster conservative attitudes in the southmost borderlands of Texas. Given that the RGV is one of the most economically disadvantaged regions of the nation, some might argue that education works as a proxy measure of socioeconomic status, which in turn correlates with conservative immigration attitudes in the region. However, in our models, household income does not have a statistically significant effect. Although the correlation between education and household income is quite high (r = .52), excluding education from the regression analysis does not make the income variable statistically significant.
Instead of socioeconomic status, we suggest education may capture an acculturation effect in the RGV. As discussed above, the RGV is one of the regions with the highest volume of transborder mobility in the nation. For this reason, a significant portion of the population in the RGV has immigration backgrounds to various degrees and the level of exposure to immigrants or foreign nationals is considerably high. In this context, the level of educational attainment may capture the time individuals spent in the U.S. and the degree of assimilation or embeddedness into the American society. If this is the case, we can assume that the more educated individuals become, the less sympathetic they become toward newcomers and are more willing to differentiate themselves from newcomers. This requires a further analysis.
Second, another interesting finding is that the role of ideology in forming immigration attitudes in both RGV and national Hispanic populations is less significant than in the national non-Hispanic population. As is shown in Table 3, in the non-Hispanic national sample, the percentage difference in the predicted probability of opposing a border wall is approximately 76% between “Very liberal” and “Very conservative.” The gap shrinks dramatically to 12.6% in the overall RGV sample and to 19.5% in the RGV Hispanic sample. A similar pattern is also found in the national Hispanic sample; there is only 11% difference in the predicted probability of opposing a border wall between those who “Never” attend religious services and those who attend “More than once a week.” Why is the impact of ideology on the opposition to a border wall considerably weaker in the RGV and among national Hispanic population than the national non-Hispanic population? Does it suggest that the national debates over a border wall and other controversial immigration policies have been driven by the ideological cleavage that exists in the non-Hispanic populations? Or conversely, does immigration policy deepen the existing ideological cleavage in the non-Hispanic populations at the national level? Or, does this simply mean that the conservatives in the RGV and the nationwide Hispanic population are not conservative enough? It will be interesting to investigate RGV conservatives and conservative Hispanics at both RGV and national levels further and figure out the factors that make these particular populations different from the rest of the nation.
Lastly, we also find that the differing effects of gender across the samples need further explanations. Why does being female lead to more opposition to a border wall among the national Hispanic population only whereas it has no effect on other samples? We leave all these unanswered questions for our future research projects.
Supplemental Material
Supplemental_Material_Kim_et_al_002 – Supplemental material for A Comparative Analysis of the Attitudes toward the U.S.-Mexico Border Policy: Evaluating Perspectives on Border Security and Building a Wall in the Rio Grande Valley, National Hispanic and General U.S. Populations
Supplemental material, Supplemental_Material_Kim_et_al_002 for A Comparative Analysis of the Attitudes toward the U.S.-Mexico Border Policy: Evaluating Perspectives on Border Security and Building a Wall in the Rio Grande Valley, National Hispanic and General U.S. Populations by Dongkyu Kim, Mi-son Kim and Natasha Altema McNeely in Hispanic Journal of Behavioral Sciences
Footnotes
Acknowledgements
The authors would like to thank Dr. Laryssa Mykyta, the previous co-director of the Center for Survey Research and Policy Analysis at the University of Texas Rio Grande Valley, for her advice and expertise in designing and fielding our survey. We also thank the Office of the Executive Vice President for Academic Affairs for providing funding for our survey through the Transforming Our World Strategic Plan. Lastly, we thank Dr. Jinwoo Choi, the director of the Hanyang Peace Institute at Hanyang University in South Korea, for the colloquium invitation and thoughtful advice on the earlier version of this manuscript.
Declaration of Conflicting Interests
The author(s) declared no potential conflicts of interest with respect to the research, authorship, and/or publication of this article.
Funding
The author(s) disclosed receipt of the following financial support for the research, authorship, and/or publication of this article: This research was funded by the Office of the Executive Vice President for Academic Affairs at the University of Texas Rio Grande Valley through the 2017-2018 Transforming Our World Strategic Plan.
Supplemental Material
Supplemental material for this article is available online.
Notes
Author Biographies
References
Supplementary Material
Please find the following supplemental material available below.
For Open Access articles published under a Creative Commons License, all supplemental material carries the same license as the article it is associated with.
For non-Open Access articles published, all supplemental material carries a non-exclusive license, and permission requests for re-use of supplemental material or any part of supplemental material shall be sent directly to the copyright owner as specified in the copyright notice associated with the article.