
Abstract
Little is known about the characteristics, transition education, and postschool outcomes of English learners with disabilities (ELSWDs), despite that English learners are a rapidly growing group of U.S. students with consistently poor outcomes. This study examines a nationally representative sample of ELSWDs through a secondary analysis of the National Longitudinal Transition Study-2 (NLTS2). Complex Samples statistical analyses were used to identify ELSWDs’ sociodemographic characteristics, education and transition program characteristics, and postschool outcomes. Results confirmed disproportionate identification by race/ethnicity for Latinos and White as ELSWDs. Findings also illustrated alignment between transition planning and courses taken, yet postschool employment was significantly lower for ELSWDs. Implications include the need for research methods that address ELSWDs disproportionality in high school and transition outcome variables unique to this population. Implications for practice include the development of teacher preparation programs that apprise secondary special educators of ELSWD characteristics and their transition-related preferences, strengths, and needs.
Keywords
English learners (ELs) 1 with disabilities are simultaneously members of two groups of U.S. students who face multiple obstacles to achieving the benchmarks of postschool success such as college enrollment, degree completion, and employment. Identifying and providing access to appropriate educational opportunities and positive postsecondary outcomes for adolescents identified as both ELs and as students with disabilities (ELSWDs) are complex endeavors, further complicated by limited knowledge about the diverse sociodemographic, linguistic, and disability characteristics of members of this group (Artiles & Klingner, 2006). Transition research about ELSWDs is sparse, reflected in the dearth of studies about their secondary education experiences including access to general education, transition planning and instruction, and postschool outcomes. This secondary analysis is an initial examination of a nationally representative group of ELSWDs, including the population’s characteristics, high school experiences, and postschool outcomes. We conducted a secondary analysis of data from the second National Longitudinal Transition Study-2 (NLTS2).
Identifying the Population of ELSWDs
The growing diversity of the school-aged U.S. population includes an increased number of ELs, who are also diverse (Artiles, Rueda, Salazar, & Higareda, 2005). Approximately 21% of public school students, or about 11.2 million, speak languages other than English at home (Aud et al., 2011). Not all multilingual students, however, need language assistance. Approximately 9% of U.S. public school students receive English language services at school (Kena et al., 2014). Similarly, 9% of students who receive special education are dually identified as ELs (National Center on Educational Outcomes, 2011).
Typically, ELs are considered to be students who speak languages other than English in their homes and receive various language instructional services in public schools, including English as a second language (ESL), bilingual education, or language immersion programs. Identifying ELs is not consistent across states; although many states use home language surveys and a starting point, these surveys have not been standardized or validated and potentially result in inconsistent identification (Linquanti & Cook, 2013). Furthermore, English proficiency, expressed as a composite score of four domains on a range of state standardized assessments, lacks an operational definition. Therefore, a student may be considered bilingual and proficient in one domain (e.g., speaking) but continue to struggle in one or more of the other domains (e.g., listening, reading, and/or writing), remaining classified as EL (Linquanti & Cook, 2013). Furthermore, exiting (also called reclassification or redesignation) ELs from English language programs is based on criteria such as English proficiency and parental decision (Linquanti & Cook, 2013) and can result in diminished access to needed services. The EL student population is also comprised of students from a variety of socioeconomic, racial/ethnic, and linguistic backgrounds. Students who share the EL identification may or may not have immigrated to the United States, live in various language communities, and attend schools in states that are positioned on a continuum of English language education policies spanning from emphases on English-only to bilingual proficiency instructional approaches. Despite this diversity, two thirds of ELs live in families nearing or at the threshold of poverty (Aud et al., 2011).
Identifying ELs who have disabilities (i.e., the subject of this study, ELSWDs) is similarly challenging and has resulted in disproportionate representation in special education, primarily documented in the high-incidence disability categories such as learning disability (LD), emotional and behavioral disability (EBD), and intellectual disability (ID; Artiles & Klingner, 2006). Based on a systematic review of the extant literature, Sullivan (2011) identified several reasons for special education disproportionality among ELs, including teachers’ hesitancy to refer students who are learning English for disability identification; insufficient access to EL services in school districts; poorly understood educational needs; a lack of nondiscriminatory, reliable, and valid assessment tools and practices specific to this population; and similarities in the presentation of linguistic difference and disability, resulting in both under- and over-representation of ELSWDs in high-incidence disability categories. In addition, many ELs are members of historically marginalized racial groups and/or are from low socioeconomic backgrounds, notable because race and class are identified as key factors in over-representation in special education, limited access to inclusive school services and programs, and poor postschool outcomes (Artiles, Klingner, & Tate, 2006; Arzubiaga, Artiles, King, & Harris-Murri, 2008; Blanchett, 2006). Hence, ELSWDs likely represent a group of youth with a wide range of disability- and/or linguistic-related needs. Further study is needed to better understand who is included among ELSWDs, particularly in high school.
Transition to Adulthood for ELSWDs
Historically, students with disabilities (SWDs) have experienced poor postschool outcomes when compared with their peers without disabilities. Special education individualized transition planning and education are intended to support positive postschool outcomes for SWDs, including ELSWDs. Unfortunately, information about transition for ELSWDs is quite limited. Of the handful of studies addressing ELSWDs, we found no studies focused on their transition into adulthood describing the population characteristics, transition programming, and postschool outcomes such as high school completion, postsecondary education, and employment. Nevertheless, concern for transition outcomes for this population is warranted and needs examination because this group is likely to have unique postsecondary strengths, needs, and preferences relative to their cultural and linguistic identities and experiences. For example, ELSWDs who want to attend postsecondary education and/or maintain a job will need to understand and prepare for the linguistic demands associated with higher education and employment. Furthermore, parent expectations have consistently been an important predictor of transition goal attainment, yet little is known about how ELSWD parents support their children with disabilities through the college application process—one where their experience is limited.
Both ELs and SWDs concurrently experience some of the lowest rates of high school completion, predictive of other postschool outcomes and reflective of a potentially greater risk to those who are dually identified (i.e., ELSWDs). Approximately 7% of U.S. students leave high school before receiving a diploma, but the dropout rate for students born outside the country, many of whom are ELs, is 16% (Kena et al., 2014). School completion rates vary across the 13 disability categories now recognized in the Individuals With Disabilities Education Improvement Act (IDEA) of 2004. For example, 75% of young adults with LD (75%) have completed high school; the same is true for 56% of young adults with EBD (56%) and 72% of those with ID (Wagner, Newman, Cameto, Garza, & Levine, 2005). Based on 2012 data, dropout rates for the U.S. students with and without disabilities varied by race/ethnicity, illustrating a continued historical pattern; 8% of African Americans and 13% of Latinos (i.e., Hispanics) leave high school without diplomas, whereas 4% of Whites (i.e., European Americans) drop out (Kena et al., 2014; comparable, disaggregate data were not available for Asians or Native Americans). Regardless of linguistic background, school completion for White and African Americans with disabilities is 74% and 78%, respectively, and for Latinos with disabilities, the rate is 60% (Wagner et al., 2005).
Enrollment in postsecondary education and employment are two postschool outcomes indicating positive transitions to adulthood. Approximately 45% of young adults with disabilities, irrespective of linguistic background, enroll in vocational, 2- or 4-year postsecondary education program after high school (Newman, Wagner, Cameto, & Knokey, 2009). Unfortunately, there are no studies that present data on national numbers or percentages of ELs in each IDEA-recognized disability category. Although the NLTS2 has provided percentages of children in each disability category whose home language is other than English, they do not present this information by the students’ EL status. Because ELs are often identified as students with LD, and because this group comprises largest subgroup of SWD, it is important to consider outcomes for this population specifically. Although 47% of young adults with LD enroll in postsecondary education, and this is similar to the enrollment rate of young adults with disabilities from all categories combined, enrollment in postsecondary education is noticeably greater for youth in some other disaggregated disability categories. For example, 72% of young adults who are deaf/hard of hearing enroll in postsecondary programs, as do 78% who have visual impairments. The rate of postsecondary enrollment of those with LD is the fourth lowest of 12 disability categories, higher only than youth with EBD, ID, and multiple disabilities (Newman et al., 2009). Young adults with EBD enroll in postsecondary education at a rate of 34%, significantly lower than youth with hearing, visual, speech language, orthopedic, and other health impairments. The same is true for youth with ID, 27% of whom enroll in some type of postsecondary education. Postsecondary education enrollment varies across racial/ethnic groups by institutional type. For instance, 15% of White students and Latinos enrolled in 4-year institutions, while the same was true for 5% of African Americans; however, the overall postsecondary enrollment across groups is not significantly different (Newman et al., 2009).
Within 4 years after leaving high school, 57% of young adults with disabilities obtain employment with a range of outcomes in duration and intensity of work, wages, benefits, and opportunities for promotion (Newman et al., 2009). This compares with a 66% employment rate for similar-aged youth without disabilities. Unfortunately, the duration of employment at the time of the NLTS2 interviews illustrated that only 21% of youth with disabilities had been employed for more than 12 months in their current jobs, 1 to 4 years after high school. Not surprisingly, employment outcomes, including getting hired, maintaining a job, and receiving benefits, improve as individuals with disabilities accrue education (Newman, Wagner, Knokey, et al., 2011). Based on data from the NLTS2, up to 8 years after leaving high school, employment rates for adults with disabilities are relatively high, ranging from 63% for individuals with multiple disabilities to 96% of individuals with other health impairment (Newman, Wagner, Knokey, et al., 2011). The lack of longevity and unstable consistency of employment, however, indicate the need for improved employment outcomes across disabilities; 59% of individuals with disabilities reported having quit a job, 19% had temporary jobs that ended, 14% had been laid off, and 9% had been fired, 5 to 8 years after leaving high school (Newman, Wagner, Knokey, et al., 2011). Although racial/ethnic differences in employment rates were not statistically significant, socioeconomic backgrounds were with the poorest group being the least likely to obtain employment since high school. For ELSWDs, both postsecondary enrollment and employment introduce potentially unique problems to be addressed in transition, and yet little is known about this group’s outcomes in either area.
Transition planning and education constitutes a concerted effort to improve secondary experiences and postschool outcomes for all high school SWDs. Planning is individualized, yet evidence-based practices and postschool outcome predictors have been identified through systematic reviews of correlational, experimental, and quasi-experimental research (Test, Fowler, et al., 2009; Test, Mazzotti, et al., 2009). Evidence-based practices include student-focused planning practices such as teaching daily living skills and self-determination, providing transition information to families, and providing community-based instruction. Test, Mazzotti, and colleagues (2009) also identified predictors of a range of postsecondary education and employment outcomes including career awareness and instruction in the general education classroom, work experience, and enrollment in academic and occupational courses. Although some studies have focused on populations that may include ELSWDs—for example, Gil-Kashiwabara, Hogansen, Geenen, Powers, and Powers’s (2007) study of transition planning with Latinas and Trainor’s (2005, 2007) studies on self-determination and racially/ethnically diverse students with LD—no published studies examine a nationally representative of ELSWDs characteristics, experiences, and outcomes.
Understanding who the national sample of ELSWDs includes, as well as the types of transition instruction they typically receive, and their postschool outcomes can establish a foundation for research and practice that is tailored to meet the needs of this population. The following research questions guided this secondary analysis of the NLTS2 data:
Method
This study is a secondary analysis of the NLTS2, a publically available, nationally representative dataset comprising secondary and outcome data on SWDs. Its use requires federal permission and institutional human subjects review, both of which we obtained prior to conducting this research (see www.nlts2.org for complete information about the dataset and permissions). The NLTS2 was funded by the Institute of Education Sciences (IES) in the U.S. Department of Education. Data collection, which occurred in a series of five waves from 2001 to 2009, included parent and youth surveys, teacher and administrator school and program surveys, direct assessments of students, and course transcripts. In 2000, when the original sample was selected, approximately 11,000 adolescents with disabilities, aged 13 to 16 years, participated in the study. Participants were identified with at least one disability from the then 12 IDEA-recognized categories. The dataset includes more than 40,000 variables, and data are weighted across waves and instruments. This complex sample reflects a two-stage stratified cluster sample design based on districts’ geographic region, enrollment size, and community wealth (Newman et al., 2009).
Study Sample
To identify the sample from the larger NLTS2 dataset, we included students whose School Program Surveys in Waves 1 and 2 indicated bilingual, Limited English Proficient (LEP), or non-English speaking students; students whose school program included ESL or bilingual courses; or students whose transcripts included bilingual or ESL courses. Transcript data across all years of high school had a response rate of approximately 84% (Newman, Wagner, Huang, et al., 2011). The school program surveys collected in Waves 1 and 2 had respective response rates of 48% and 50% (Javitz & Wagner, 2005). Identification resulted in an unweighted sample of 800 EL participants, rounded to the nearest 10 in compliance with IES rules for using restricted datasets. The sample represents approximately 7% of the weighted NLTS2 sample. The sociodemographic profile of study participants is provided in Table 1.
Demographic Characteristics of ELSWDs in Wave 1.
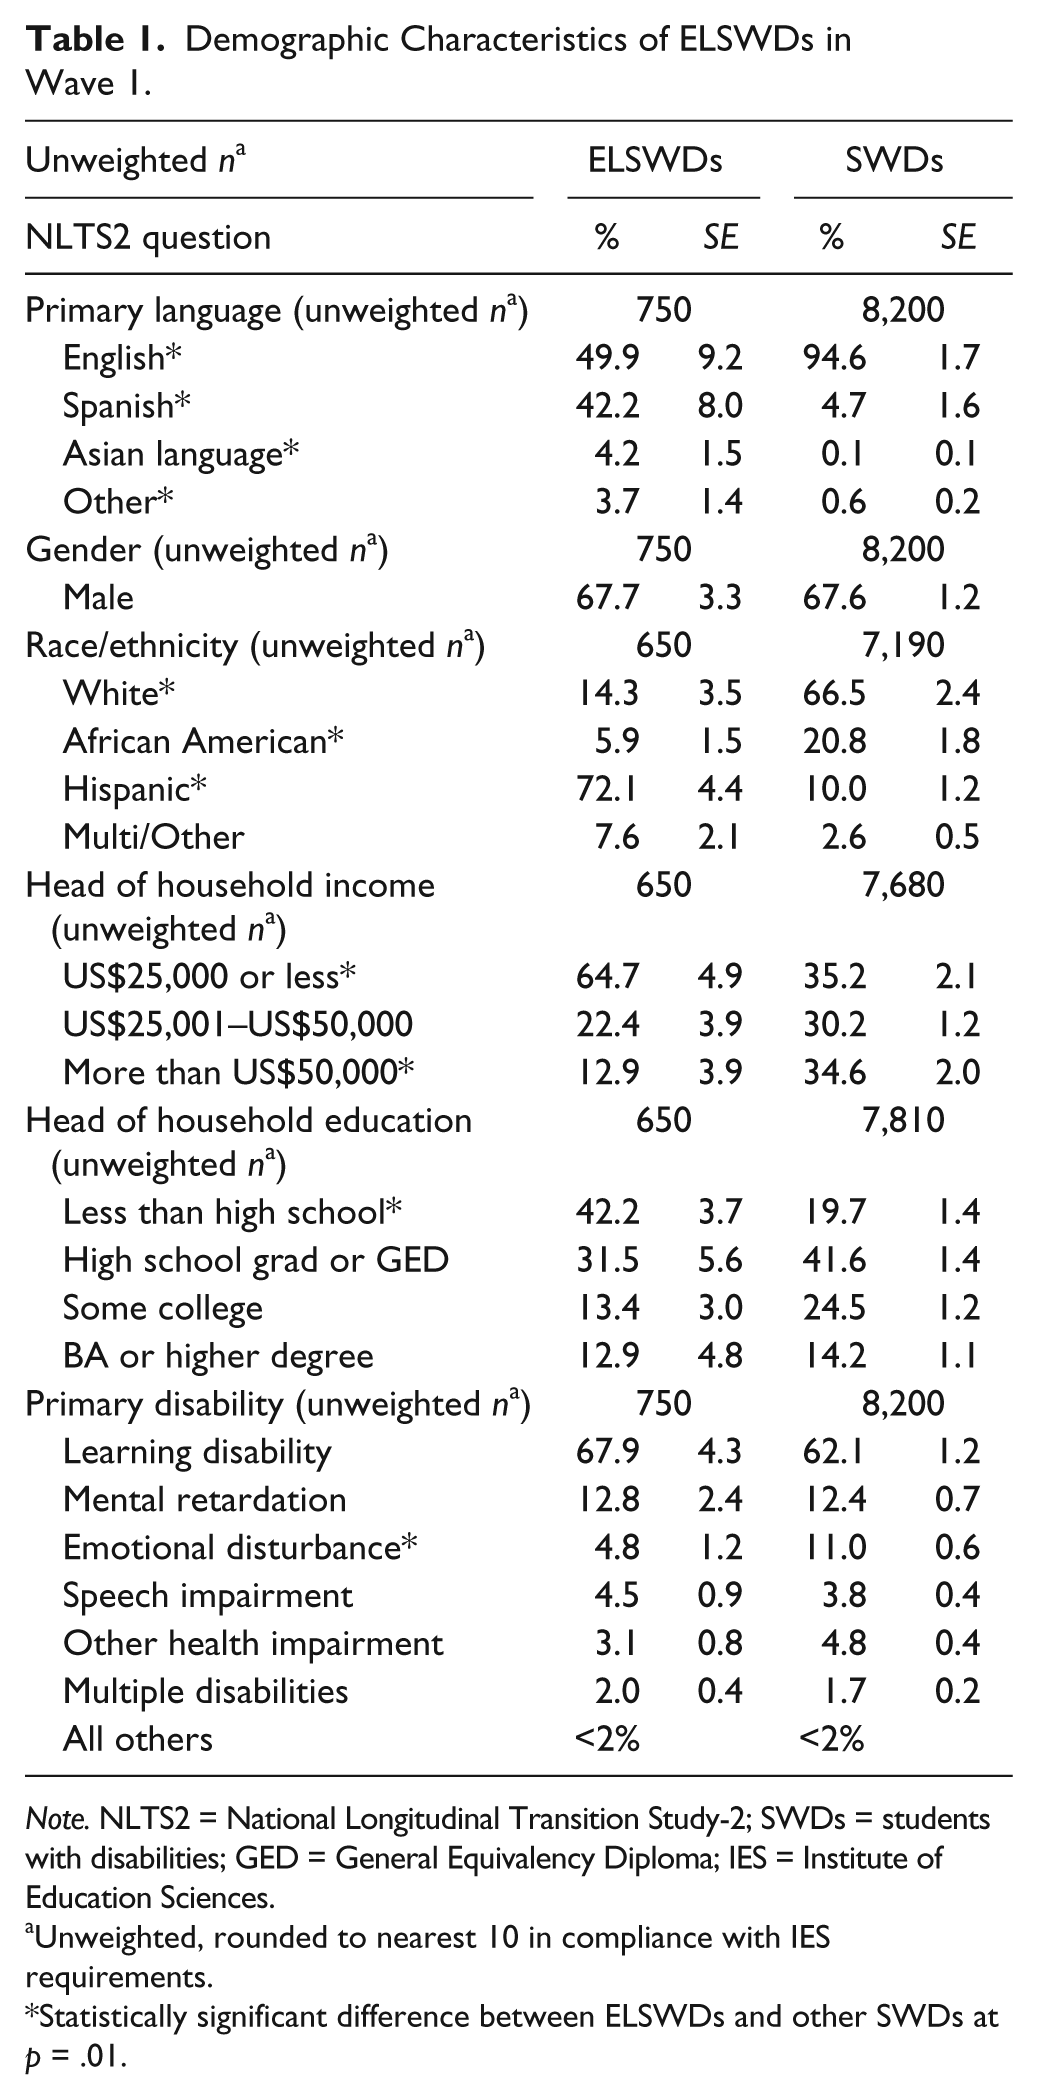
Note. NLTS2 = National Longitudinal Transition Study-2; SWDs = students with disabilities; GED = General Equivalency Diploma; IES = Institute of Education Sciences.
Unweighted, rounded to nearest 10 in compliance with IES requirements.
Statistically significant difference between ELSWDs and other SWDs at p = .01.
Parent Surveys, conducted in Spanish and English in Wave 1, provided participants’ sociodemographic variables. The Wave 1 School Characteristics Survey, completed by school personnel, provided participants’ school data, and the School Program Surveys from Waves 1 and 2 provided information about transition planning and other services. Because data were longitudinal and collected over multiple waves, a collapsed variable reflected transition services received at any point during high school. For example, if we chose to use Wave 1 to represent transition experiences, an individual who had missing data in that wave would be lost. Instead, we filled in data from Wave 2 for that student to obtain a more complete dataset that represented students receiving transition services at either Wave 1 or Wave 2. We also analyzed variables from the Waves 1 and 2 Parent/Youth surveys about participation in transition planning. Transcript data collected in Wave 5, covering students’ entire secondary school careers, were used to ascertain course taking and attendance from permanent records. Variables from Waves 4 and 5 Parent/Youth Surveys provided postschool employment and postsecondary education outcomes.
Missing Data
The NLTS2 dataset is longitudinal and comprises variables from multiple data collection instruments, each having complex skip-logic and varied response rates. Parent Surveys in Wave 1 had the highest practical response rate of 82% (Javitz & Wagner, 2005). Subsequent Parent/Youth Survey response rates were 61%, 50%, 50%, and 48% in Waves 2, 3, 4, and 5, respectively (Newman, Wagner, Knokey, et al., 2011). Varying subgroup unweighted sample sizes are noted because missing data were on a case-by-case basis.
Data Analysis
We used SPSS 20.0 Complex Samples Module to obtain descriptive statistics. This module allows for the calculation of estimated standard errors associated with a weighted and stratified sample characteristic of the NLTS2, resulting in estimates that are representative of the national population of ELSWDs. We used a collapsed variable to reflect transition services received at any point during high school. Across all variables examined, we used the subsample of NLTS2 of non-EL SWDs as a comparison group. In other words, the comparison SWD group does not include ELs. We highlight statistically significant differences between the groups herein. For nominal variables, crosstabs analysis within the Complex Samples Procedure was used along with Pearson’s chi-square test to compare ELSWDs with SWDs at a significance level of p < .01. For continuous variables, the General Linear Model procedure available in the Complex Samples Module was used to compare the groups of interest. We used a significance level of p < .01 to identify significant differences between groups. We also recoded the 12 disability categories into two disability groups: high-incidence disabilities and other, low-incidence disabilities, for some analyses. High-incidence disabilities included LD, ID, EBD, and speech/language impairment (SLI). This group of individuals with high-incidence disabilities was compared with individuals identified in other disability categories to explore disproportionality in the same manner.
Results
Results of this secondary analysis of the NTLS2 data indicate that ELSWDs, secondary SWD who are dually identified as ELs, are a diverse group of young adults who experience transition planning in high school, but whose postschool employment is unexpectedly low. In the presentation of results, we compare ELSWD characteristics, transition-related experiences, and outcomes with the larger NLTS2 SWD sample (i.e., SWD who were not also EL).
Sociodemographic Characteristics
The ELSWD population is predominantly Latino, likely to be living in poverty, and likely to be identified with disabilities that are among the most prevalent disabilities recognized in the IDEA. Table 1 presents a comprehensive view of sociodemographic results.
Language, gender, and socioeconomic background
Of the more than 25 languages identified as primary languages spoken at home, the most common was English, followed by Spanish. Similar to the larger SWD population, the majority of ELSWDs are male. These data illustrate the low socioeconomic backgrounds of ELSWDs: 65% (SE = 4.9) came from homes with incomes less than US$25,000 and 42% (SE = 3.7) lived with a parent who had not completed high school, representing a statistically significant difference from SWDs, income χ2 = 190.76, adjusted F(2, 100) = 17.79, p < .001; education χ2 = 159.34, adjusted F(2, 1030) = 7.68, p < .001.
Disability and race/ethnicity
For ELSWDs, the four disabilities with the highest prevalence included LD, ID, EBD, and SLI; LD was the predominant disability and was over 5 times the size of the next largest disability category. Significantly fewer ELSWDs were identified as EBD (4.8%, SE = 1.2) when compared with SWDs (11%, SE = 0.6), χ2 = 1942.94, adjusted F(2, 1200) = 16.13, p < .001. Approximately 72% (SE = 4.4) of ELSWDs identified as Latinos, constituting the largest racial/ethnic group by a wide margin.
To explore disproportionality of secondary ELSWDs, we compared the racial/ethnic distribution across high- and low-incidence disabilities. We constructed a high-incidence disabilities group (i.e., LD, ID, SLI, and EBD) and a low-incidence disabilities group (i.e., the remaining IDEA disability categories: other health impairments, multiple disabilities, hearing impairments, orthopedic impairments, autism, visual impairments, deaf/blindness, and traumatic brain injuries). These data show that Latinos comprised 75% (SE = 4.3) of the high-incidence ELSWD group, but only 45% (SE = 4.8) of the low-incidence ELSWD group. The difference in disability identification, when compared with White ELSWDs with high-incidence disabilities (12%, SE = 3.5) and low-incidence ELSWD disabilities (37%, SE = 4.9), was statistically significant, χ2 = 39.22, adjusted F(2, 440) = 10.34, p < .001. Further comparisons with the racial/ethnic composition of high- and low-incidence disabilities among SWDs (i.e., non-EL) are notably different (see Table 2).
Race/Ethnicity Characteristics of Transition-Aged ELSWDs and SWDs by Disability Type.
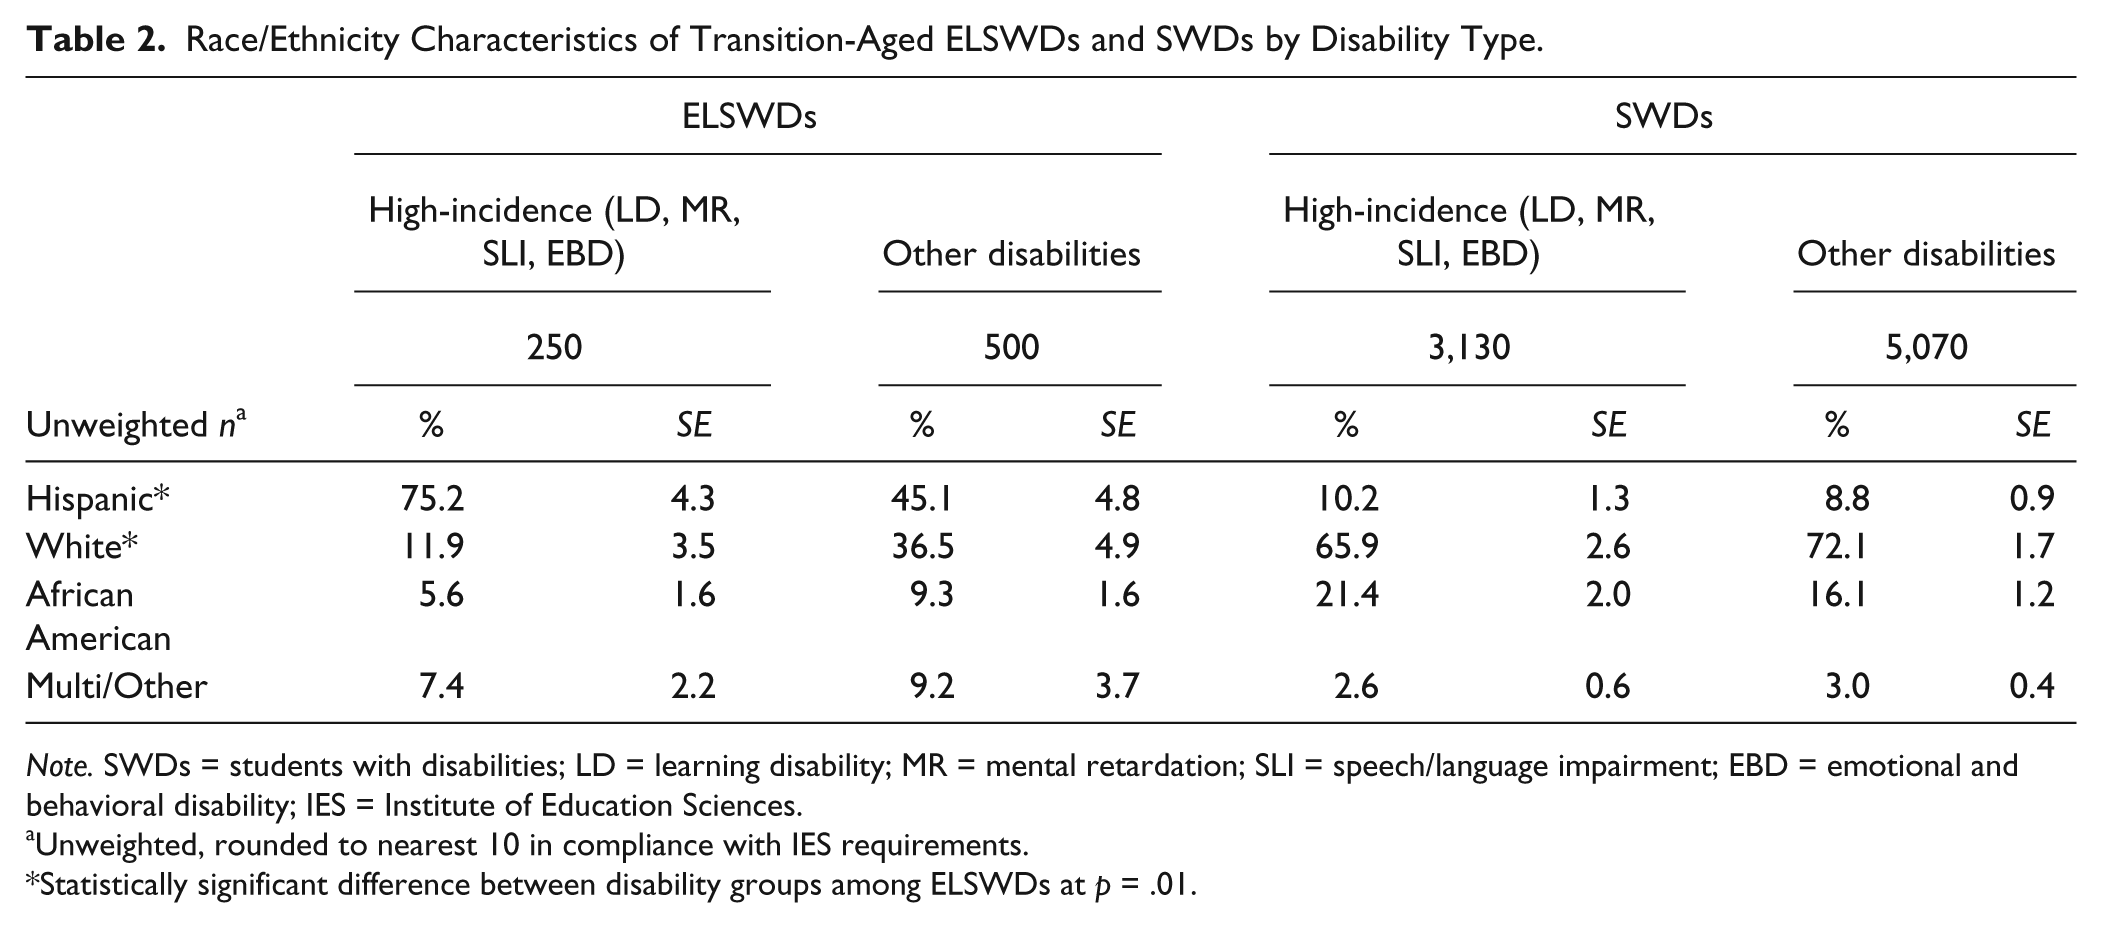
Note. SWDs = students with disabilities; LD = learning disability; MR = mental retardation; SLI = speech/language impairment; EBD = emotional and behavioral disability; IES = Institute of Education Sciences.
Unweighted, rounded to nearest 10 in compliance with IES requirements.
Statistically significant difference between disability groups among ELSWDs at p = .01.
Community and school sociodemographic characteristics
The composition of the student populations in schools attended by ELSWDs was markedly different from school populations in schools attended by SWDs. Schools attended by ELSWDs were predominantly situated in urban communities (44%, SE = 7.0), with the smallest proportion in rural locales (11%, SE = 3.2). This was significantly different from SWDs with a much lower proportion in urban communities (20%, SE = 2.3) and a higher proportion in rural areas (25%, SE = 2.8), χ2 = 170.60, adjusted F(2, 720) = 9.158, p < .001. As Table 3 illustrates, ELSWDs were significantly more likely (13%, SE = 4.0) to attend schools with high populations of ELs (i.e., schools with 20% or more of the total student population identified as EL) than were SWDs (2%, SE = 0.4), χ2 = 317.62, adjusted F(2, 830) = 30.79, p < .001. ELSWDs mostly attended schools with majority Latino and African American student populations; over half attended schools where less than 25% of the total school population was White, which is significantly higher than SWDs, 11% who attended schools where White students were a minority, χ2 = 798.65, adjusted F(2, 1150) = 51.40, p < .001. Although not statistically significant, nearly one third (27%, SE = 5.9) attended schools where 75% or more received free/reduced-price meals.
School Characteristics.
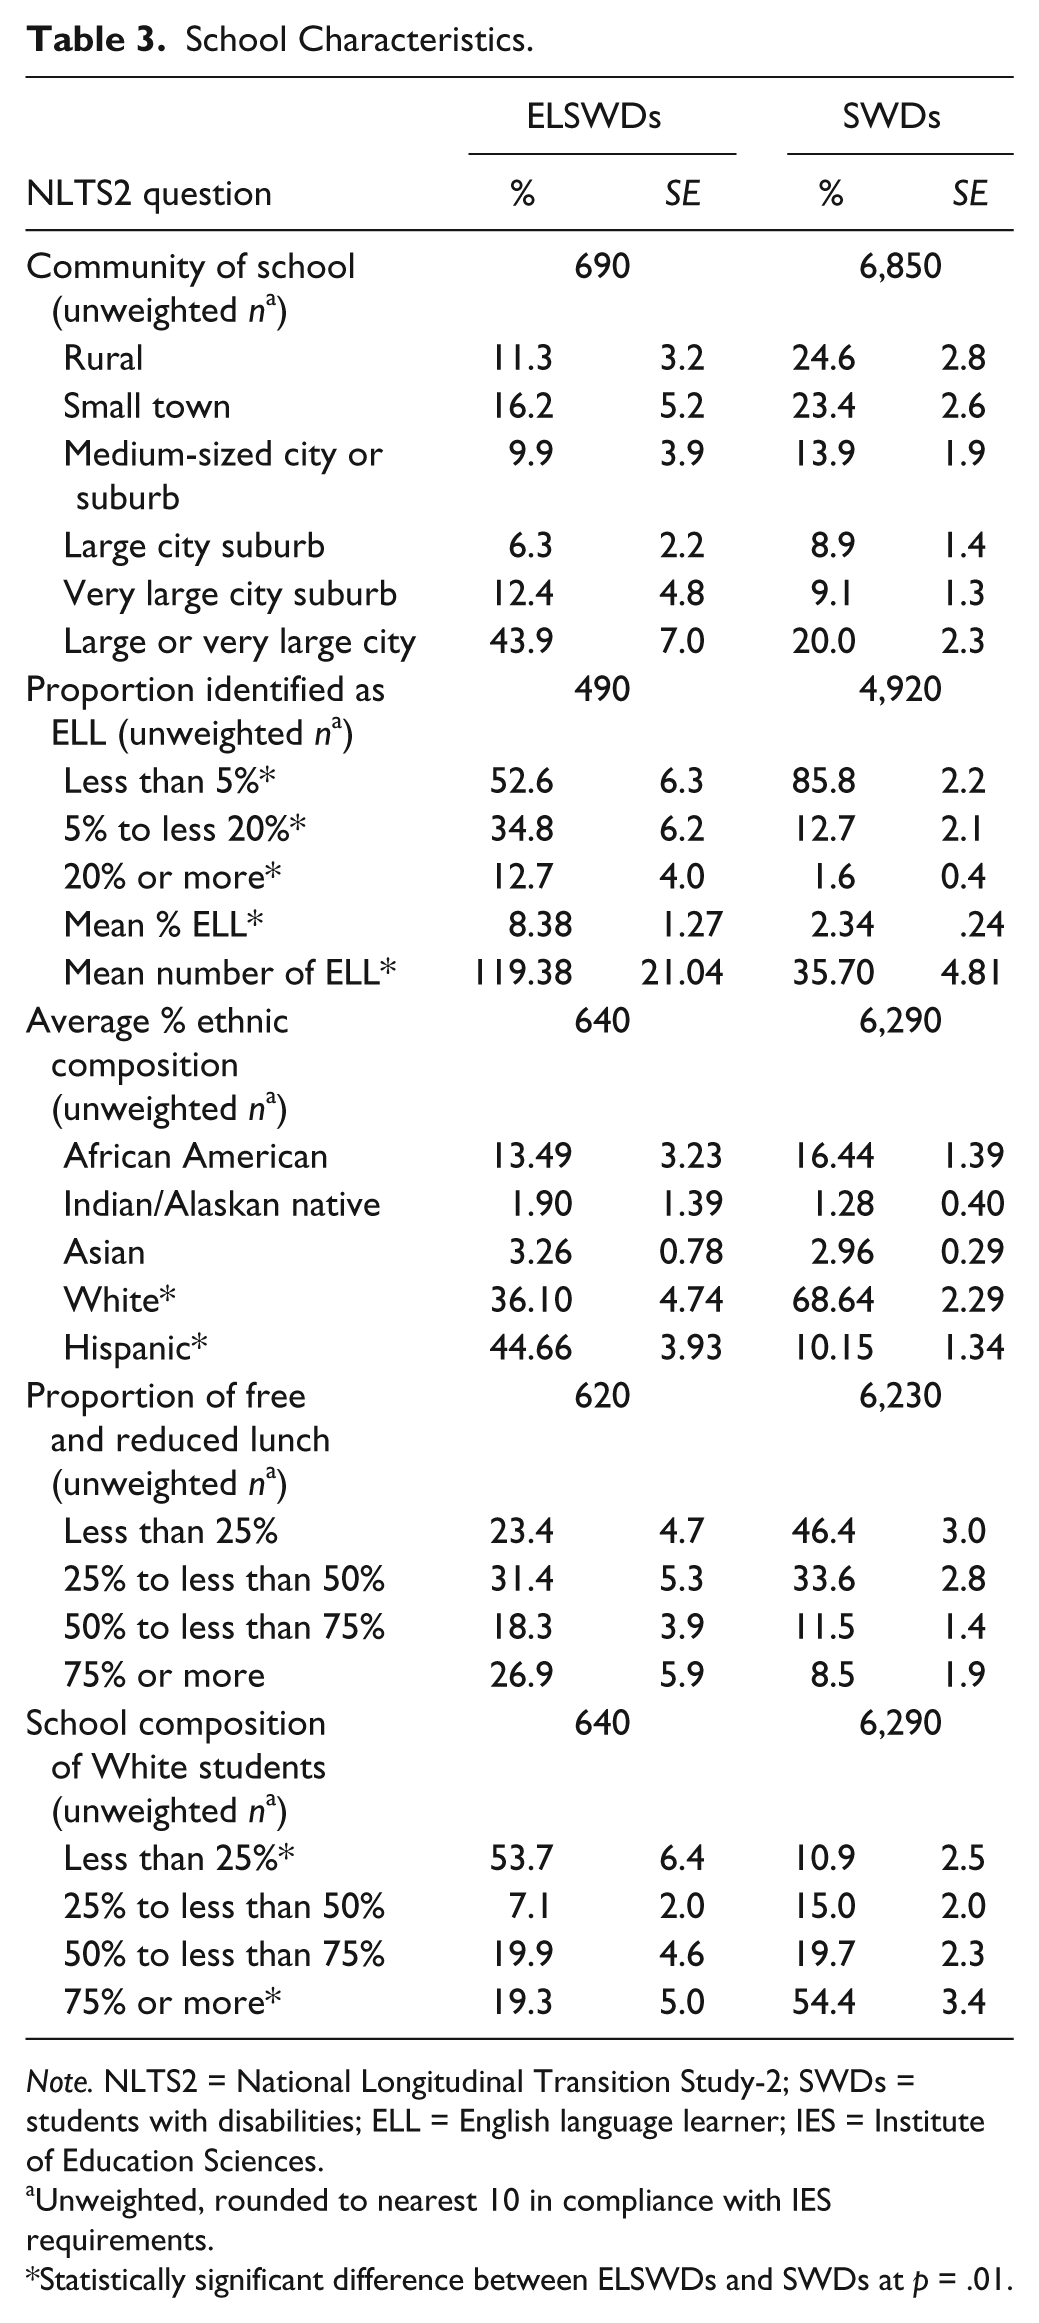
Note. NLTS2 = National Longitudinal Transition Study-2; SWDs = students with disabilities; ELL = English language learner; IES = Institute of Education Sciences.
Unweighted, rounded to nearest 10 in compliance with IES requirements.
Statistically significant difference between ELSWDs and SWDs at p = .01.
Education and Transition Program Characteristics
Transition plans
School personnel reported that, similar to SWDs, nearly all ELSWDs (93%, SE = 1.8) received transition planning during Waves 1 and/or 2. Of those ELSWDs who received transition planning, 76% (SE = 4.7) received instruction that aligned with their postsecondary goals and 80% (SE = 4.3) were enrolled in an appropriate course of study. These results are similar to transition program characteristics of SWDs. In the domain of employment, only 58% (SE = 3.2) of ELSWDs had competitive employment goals, while far fewer had sheltered or supported employment goals (13%, SE = 2.4, 10%, SE = 2.2, respectively). Slightly more than half of ELSWDs (54%, SE = 3.6) also had independent living goals on IEPs, and almost one quarter (23%, SE = 4.3) had functional independence goals. Postsecondary education goals, including going to vocational training programs (45%, SE = 4.1) and going to college/university (42%, SE = 7.9), were included at rates that approached those of employment goals. Approximately 32% (SE = 5.1) of ELSWDs had IEPs with goals that addressed improving interpersonal relationships (see Table 4). School Program Survey data illustrate active IEP engagement by most key stakeholders. Although students’ IEP meetings were nearly always attended by a special education teacher (97%, SE = 0.8), general education vocational teachers and related service providers were among those school district professionals who were among the least likely to attend (42%, SE = 3.5, and 28%, SE = 5.0; see Table 4 for more details).
Goals and Participants in Transition Planning of Transition-Aged ELSWDs and SWDs.
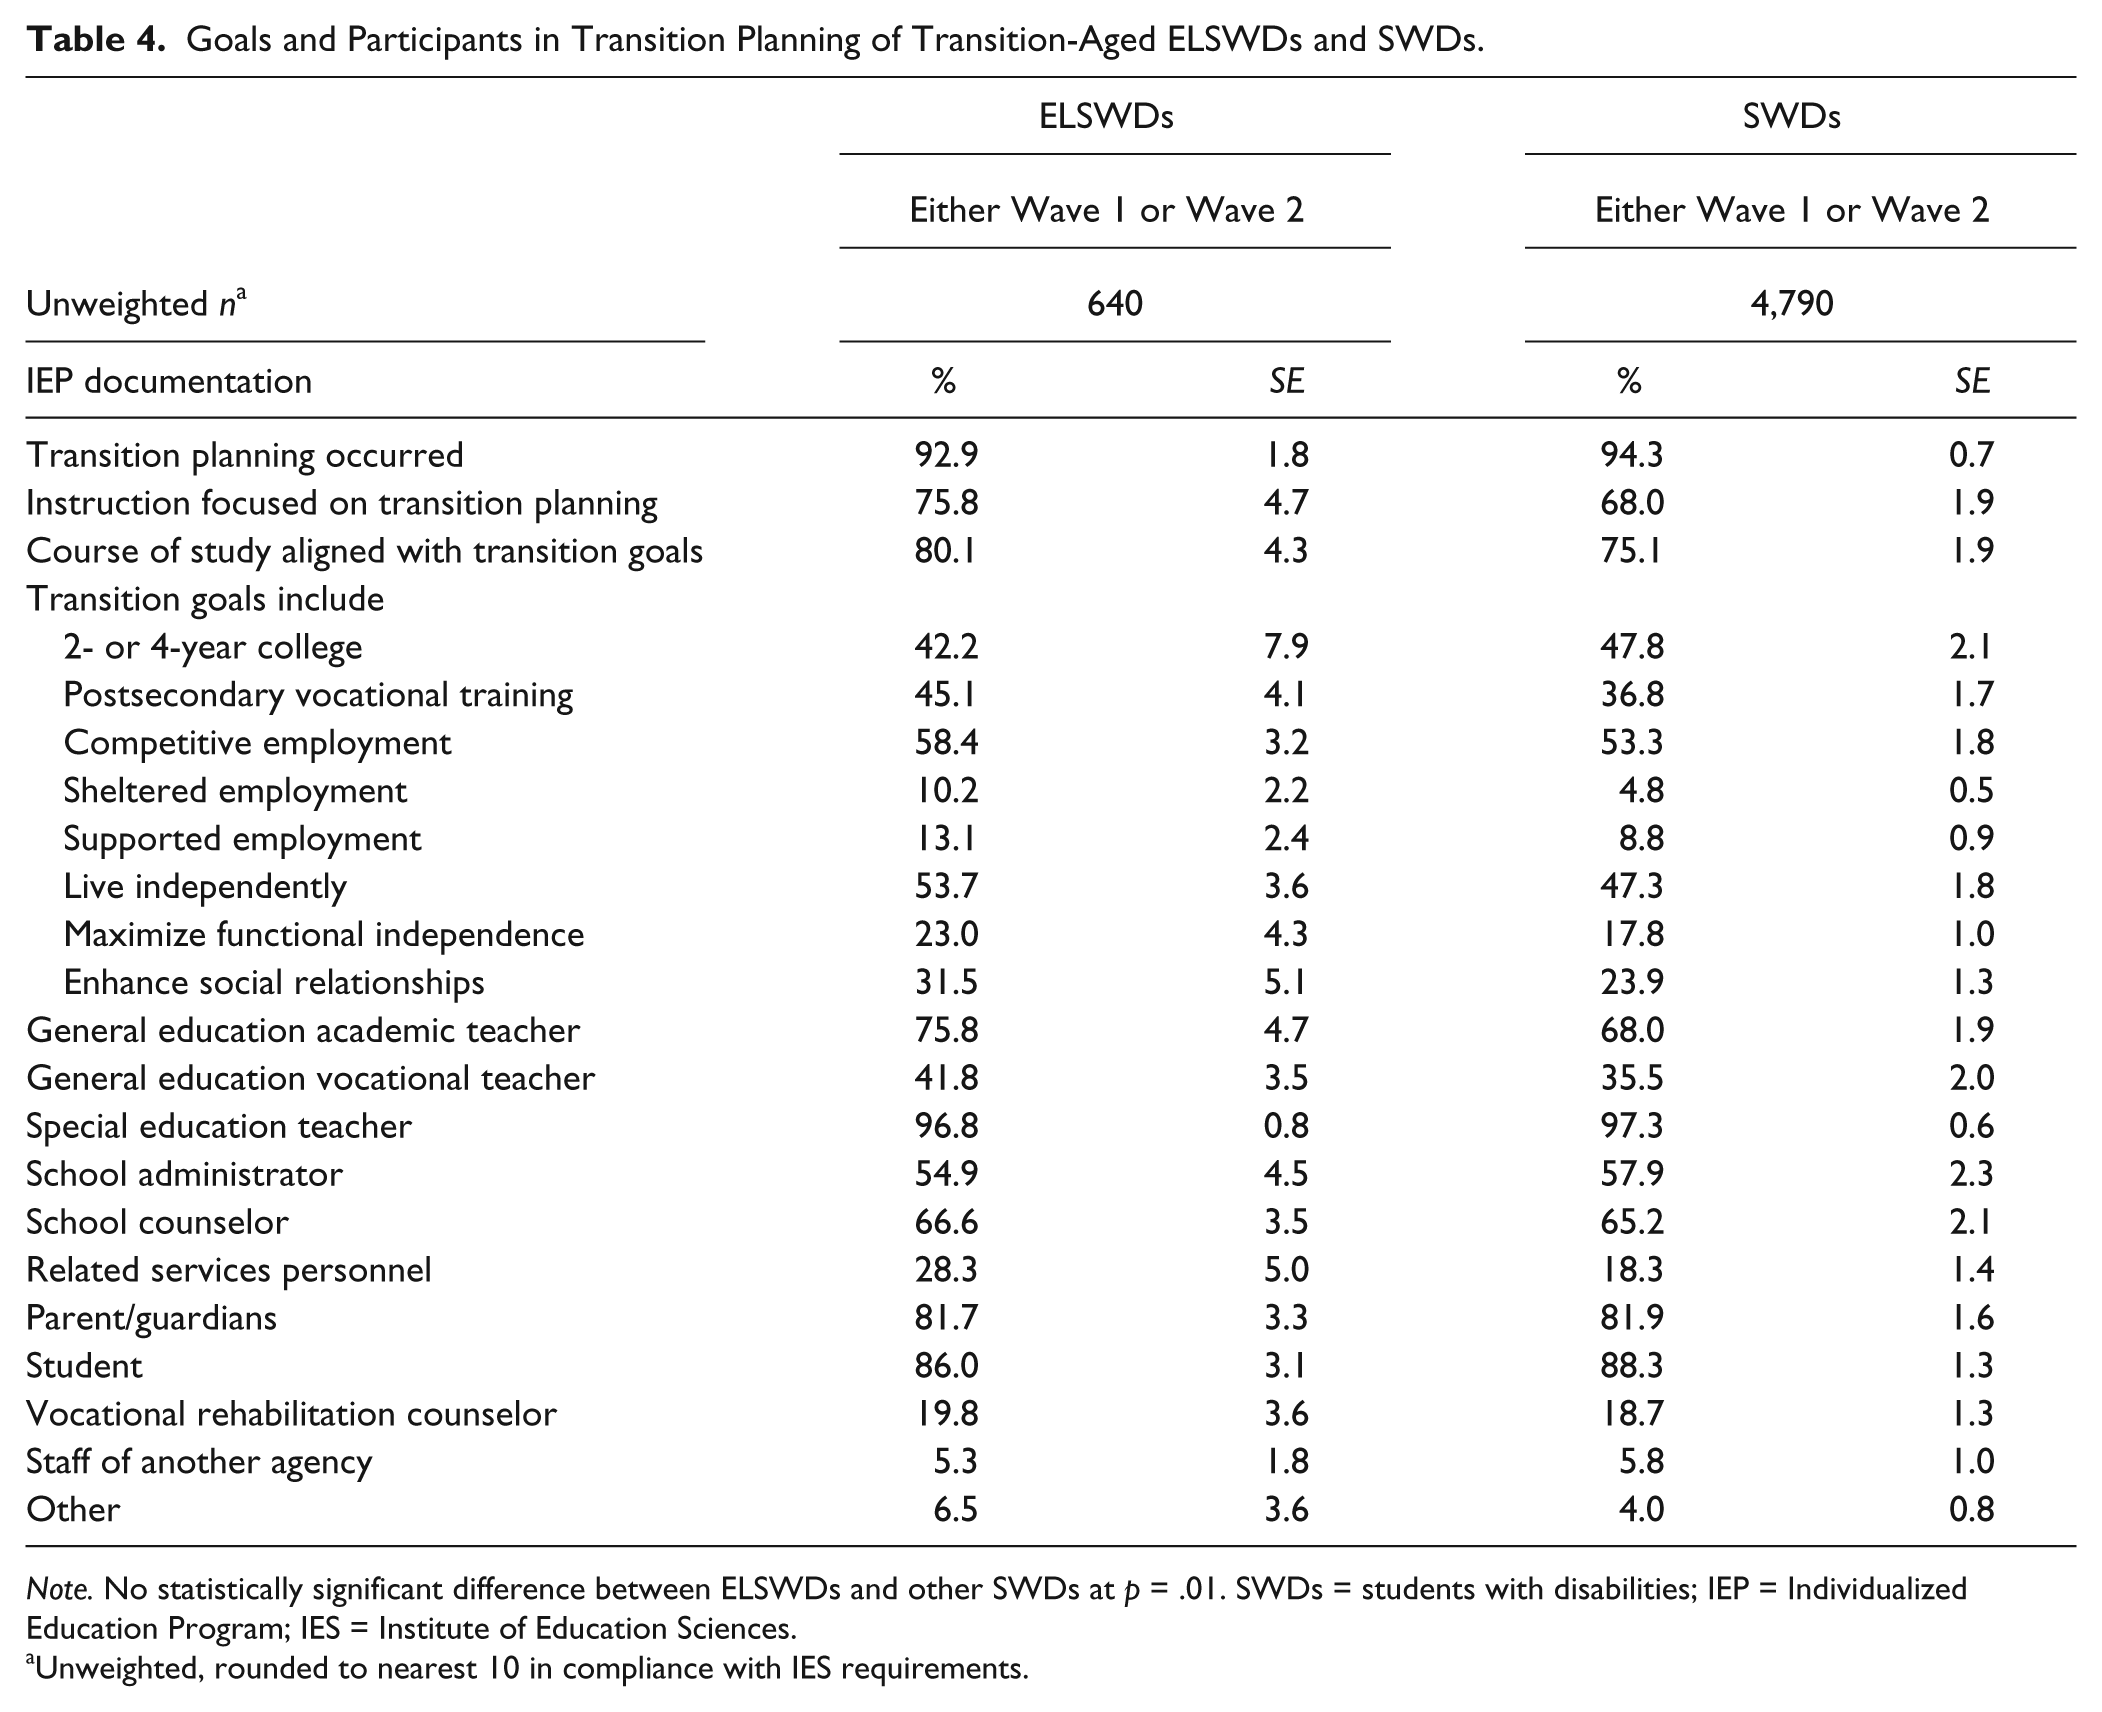
Note. No statistically significant difference between ELSWDs and other SWDs at p = .01. SWDs = students with disabilities; IEP = Individualized Education Program; IES = Institute of Education Sciences.
Unweighted, rounded to nearest 10 in compliance with IES requirements.
Courses and educational settings
Across disability categories, course-taking patterns for ELSWDs included courses in both general and special education settings. According to transcript data, ELSWDs (N = 530) received instruction in general education settings for at least one of the following core instructional subjects during high school: English, 83% (SE = 3.3); math, 74% (SE = 4.0); science, 76% (SE = 4.6); and social studies, 79% (SE = 4.3). Rates of instruction in special education settings for at least one of the core courses were as follows: English, 67% (SE = 4.0); math, 49% (SE = 5.4); science, 39% (SE = 5.5); and social studies, 42% (SE = 7.1), illustrating a lean toward inclusive classrooms across ELSWD programming. See Table 5 for compared enrollments of ELSWDs and SWDs in vocational and transition courses, and in courses associated with academic supports, illustrating little measurable difference. Interestingly, ELSWDs had a statistically significant higher mean for Carnegie units earned in academic courses (14.35, SE = .49) than did SWDs (12.59, SE = .18), Wald F(1, 430) = 12.94, p < .001.
Educational Settings of Courses Taken by ELSWDs and SWDs.
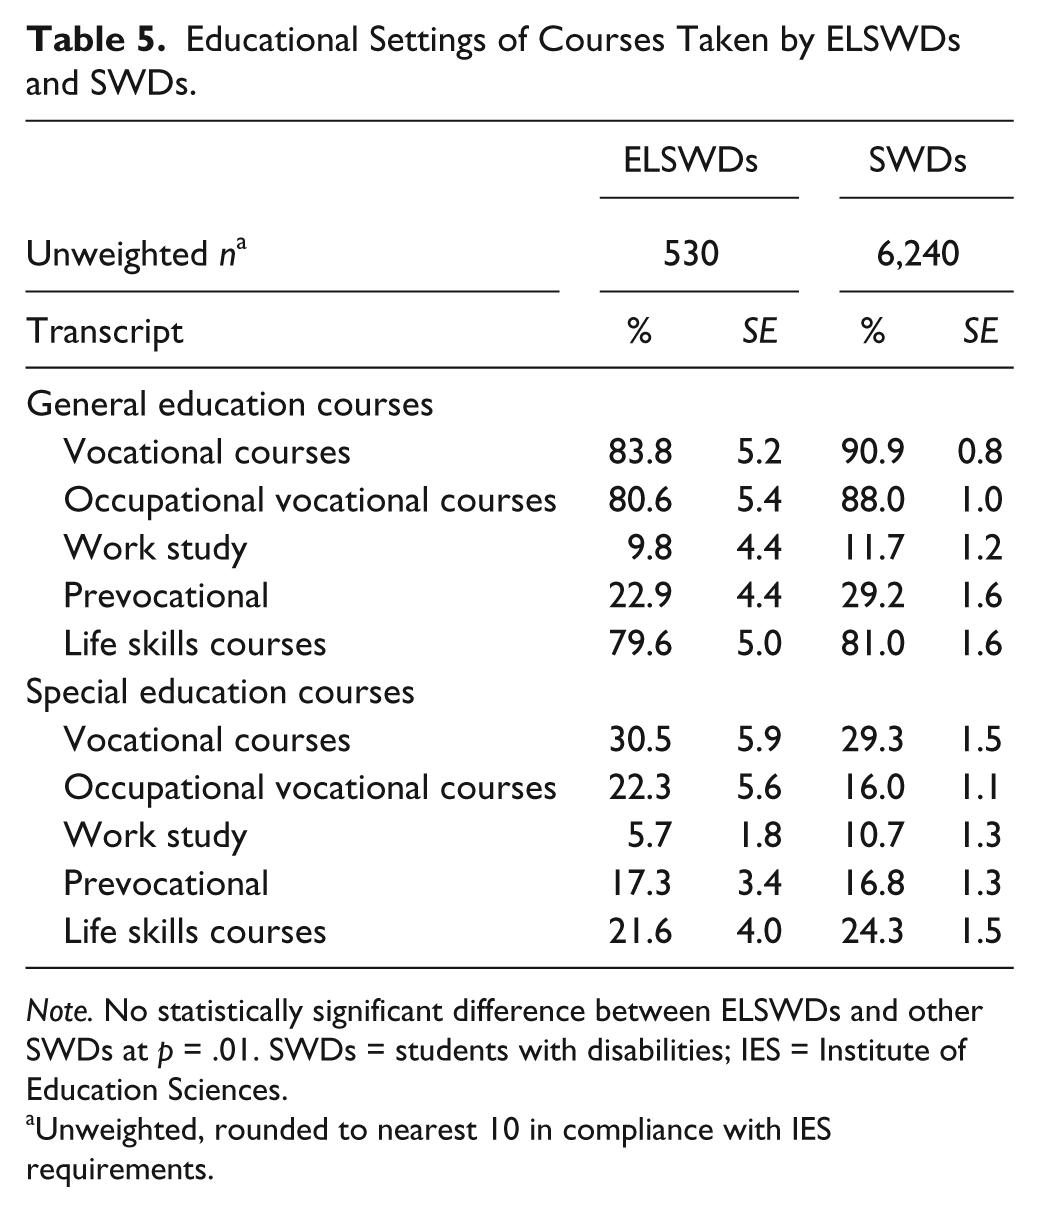
Note. No statistically significant difference between ELSWDs and other SWDs at p = .01. SWDs = students with disabilities; IES = Institute of Education Sciences.
Unweighted, rounded to nearest 10 in compliance with IES requirements.
Postschool Outcomes in Education and Employment
In the NLTS2, school completers included both those who earned diploma and those who aged out without a regular diploma. Two thirds of ELSWDs (66%, SE = 5.9) graduated with the majority earning a regular diploma. The dropout rate for ELSWDs was 15% (SE = 3.2), 3% (SE = 1.0) aged out, and 4% (SE = 1.7) moved, and school completion data were unknown for another 11% (SE = 3.3); these results are similar to those for SWDs. As Table 6 illustrates, other postschool outcomes for ELSWDs included securing employment at any point since high school (80%, SE = 2.8), which was statistically significantly lower than the employment rate for SWDs (91%, SE 1.0), χ2 = 35.87, adjusted F(1, 440) = 10.84, p = .001. Postsecondary education attendance across institutional settings for ELSWDs was 62% (SE = 4.5), also similar to postsecondary enrollment rates for SWDs. For 4-year colleges, the enrollment of ELSWDs was 14% (SE = 3.9); for 2-year colleges, their enrollment was 36% (SE = 5.6); and for vocational/technical schools, their enrollment was 39% (SE = 5.8).
High School Completion, Employment, and Postsecondary Outcomes of ELSWDs and SWDs.
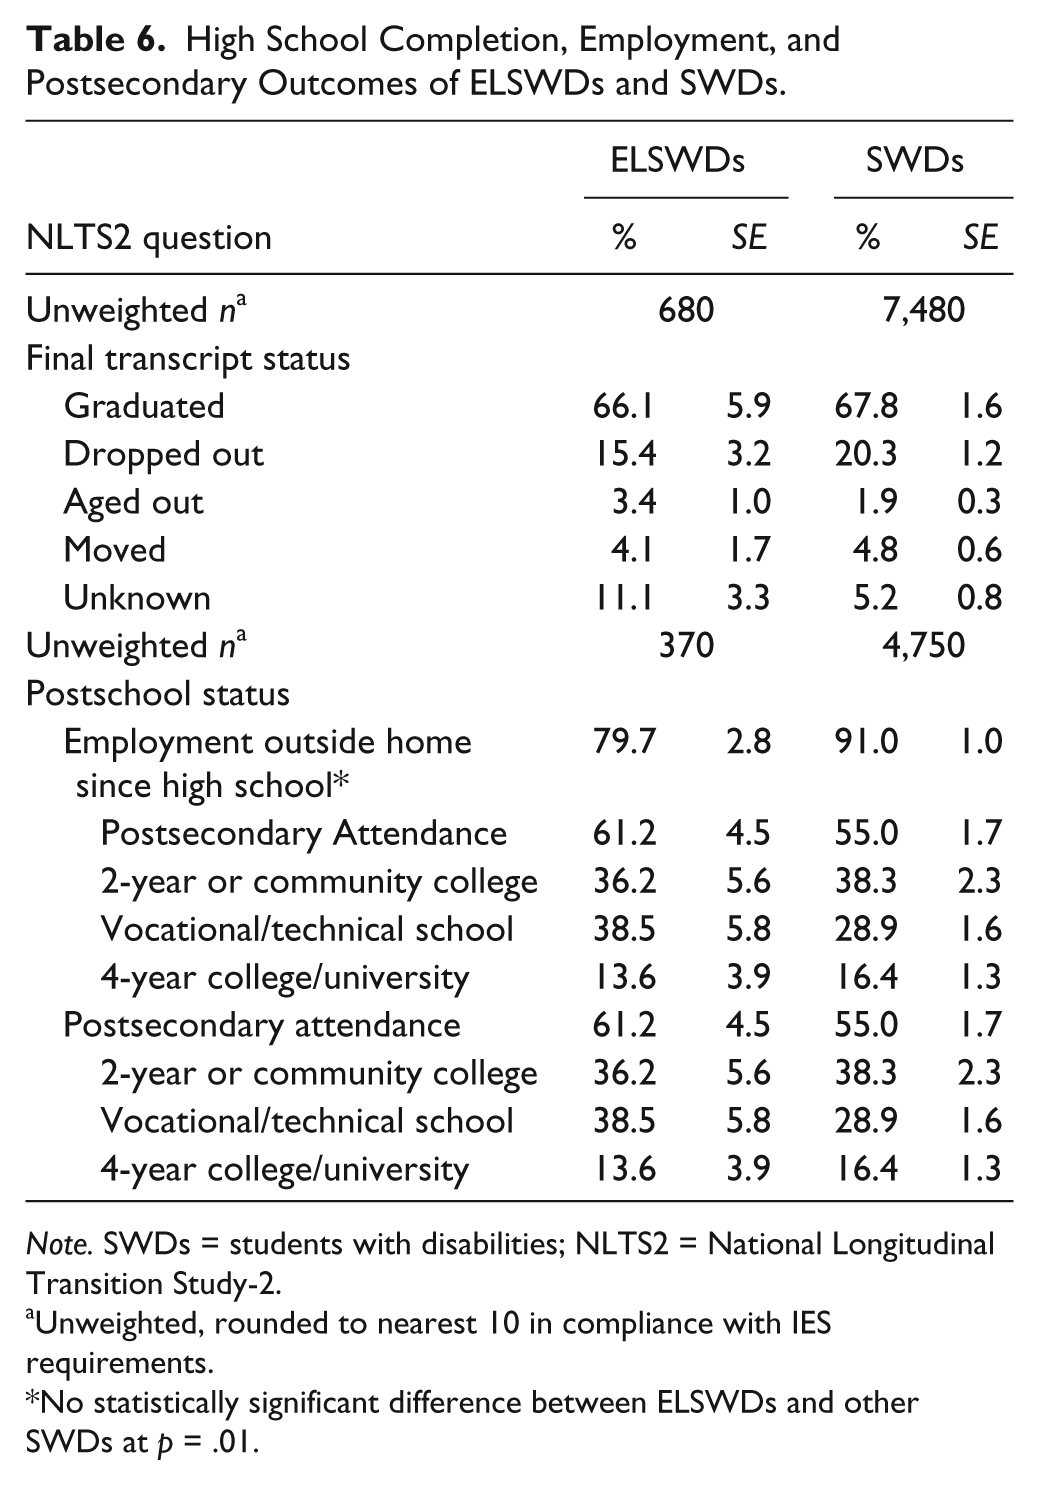
Note. SWDs = students with disabilities; NLTS2 = National Longitudinal Transition Study-2.
Unweighted, rounded to nearest 10 in compliance with IES requirements.
No statistically significant difference between ELSWDs and other SWDs at p = .01.
Discussion
As Wagner, Cameto, and Newman (2003) reported, secondary ELSWDs are a growing subpopulation, increasing nearly 11%, from 3% in 1987 to 14% in 2001. More recent national data are not available, nor is the total number of U.S. ELSWDs, disaggregated for specific disabilities, known. Although LD is the largest subcategory of SWD and learning English in addition to a different home language can mirror the characteristics of LDs for some students, approximating the population is imperfect. In fact, this study intentionally framed the first research question for the purpose of identifying the population of adolescent ELSWDs. This study is one of the first to examine the secondary and postsecondary characteristics and transition experiences of ELSWDs. Because limited knowledge about ELSWDs contributes to ineffective education policies and practices, and thus to continued marginalization and unequal access to education (Artiles & Klingner, 2006), addressing this knowledge gap is an important contribution.
This study’s limitations are important to consider in the context of its findings. Results reflect the NLTS2 data available for secondary analysis; the original study did not focus on ELSWDs or related research and education issues. Therefore, the dataset did not contain information, for example, about proficiency over time in either the home language or English, nor did it contain information about school history such as a history of interrupted formal schooling experienced by some immigrant, transnational, and/or migrant students. Related challenges include analyzing longitudinal data with a missing rate of more than 50% for some variables of interest. The school program surveys detailing access to transition education had some of the lowest responses rates overall. Some studies have demonstrated that some groups of ELs are a highly mobile population (Herbers, Reynolds, & Chen, 2013) potentially contributing to missing data in the NLTS2. Assessing language proficiencies, documenting school histories, and measuring school mobility in future longitudinal studies would help contextualize ELSWDs’ secondary experiences. Despite its limitations, this study provides valuable knowledge about secondary ELSWDs, focusing on discrete transition outcomes such as postsecondary education and employment, which are historical criteria for judging successful transitions to adulthood based on one of the strongest subset of observable data available in the NLTS2.
The analysis of high- and low-incidence disability categories for the purpose of describing the range of disabilities identified in this population is rudimentary. Despite that extant literature has documented similar school experiences for students with LD, ID, and EBD, the transition literature has begun to document the ways in which postschool outcomes differ for adolescents and young adults with ID when compared with postschool outcomes for individuals with other high-incidence disability categories such as LD and EBD (Morningstar, Trainor, & Murray, in press; Trainor, Morningstar, & Murray, 2015). Our division of high- and low-incidence disabilities, however, uses a framework in the study of disproportionality, which has traced the challenges associated with identifying disability in categories in which the judgment of professionals and the interpretation of achievement and aptitude scores can be difficult when students are also developing linguistic skills and knowledge in two languages, one at school and one at home (Artiles et al., 2006; Skiba et al., 2008).
Characteristics of Secondary ELSWDs
Sociodemographically, ELSWDs are racially/ethnically and linguistically similar to ELs without disabilities, the largest subgroup of which is Spanish-speaking, Latino adolescents (Aud et al., 2011). Examining subgroups of high- and low-incidence disabilities and the distribution of racial/ethnic categories indicates potential disproportionate identification of ELSWDs. Across all ELSWDs, Latinos were significantly more likely to be identified with high-incidence disabilities, and White students significantly more likely to be identified with low-incidence disabilities. This was true despite that across all races/ethnicities, ELSWDs were underrepresented in the category of EBD, and that Asians were underrepresented in the dataset even though Asian languages represented the third largest subgroup of students’ primary languages. These observations indicate that disability identification for ELs continues to be imprecise (Klingner, Artiles, & Barletta, 2006) and contributes to disproportionality (Sullivan, 2011). Both disability characteristics and special education services received are important factors in transition education and related interventions, and both require accuracy in disability identification. Results on the potential for disproportionality of ELSWDs pose important questions to the field, despite the preliminary nature of these findings. In addition to questioning identification accuracy, questions about disproportionality and the restrictiveness of educational settings, often tethered to disability identification, should be further examined. For example, inclusive settings have been associated with successful postschool outcomes such as enrollment in postsecondary educational settings (Rojewski, Lee, & Gregg, 2015). Are ELSWDs receiving services in the least restrictive environment (LRE) and do these reflect an accurate identification of their preferences, strengths, and needs, as pertains to their disabilities?
Although we cannot use the NLTS2 data to generate reasons for these observations, we can turn to what is known about ELs without disabilities to look for potential explanations. For example, difficulty developing English proficiency is associated with language of origin, citizenship status, and poverty status (Aud et al., 2011). Although only 4% of U.S.-born ELs experienced difficulty speaking English, the same was true for 35% of those born outside the U.S. Similarly, 10% of ELs living in poverty faced difficulty speaking English, true for just 3% who did not live in poverty. These factors may contribute to special education referrals, particularly in the area of LD, which is difficult to distinguish from problems associated with learning ESL (Artiles & Klingner, 2006; Klingner et al., 2006). Furthermore, unlike native speakers with high-incidence disabilities (e.g., LD, SLI) who are typically identified in elementary grades, immigration and English learning occur across grades and may necessitate collaboration between secondary general educators and ESL/bilingual and special educators. Accurate special education referrals require teachers who understand the oft-conflated challenges of learning English, immigration stress, and disability manifestations (Ortiz et al., 2011). High school teachers may have fewer referral experiences, have less time for collaboration across departments, and have expertise that is more focused on their content area (e.g., literature vs. reading).
One unanticipated finding was that English was the most frequently reported language used at home. Home language, gleaned from the parent/youth surveys, may reflect perceptions about the importance of English or may indicate the use of English at home in an effort to practice and assimilate. Home language is pertinent to dual language development in the early grades when dual proficiencies shift and respond to multiple linguistic environments (Collins, O’Connor, Suarez-Orozco, Nieto-Castañon, & Toppelberg, 2014); less is known about home language and transition-related issues of school achievement, employment, and enrollment in postsecondary education specific to disability. From an ecological perspective, both community and family factors warrant consideration in ELSWD transition; intergenerational immigration experiences, linguistic backgrounds, and expectations affect postsecondary education, employment, and engagement (Lui, Chung, Wallace, & Aneshensel, 2014).
Transition Education Experiences of ELSWDs
One positive finding that stands apart from other studies of SWDs (see Grigal, Hart, & Migliore, 2011) is that nearly all ELSWDs had both transition planning and plan alignment with their course of study, two broad indicators of effective transition education. The quality of the plans and the extent to which they incorporated evidence-based practices, however, remain unobservable using this dataset. Poor employment outcomes indicate that the transition education of ELSWDs was insufficient for career-related goal attainment. Another possibility is that the challenges of living in poverty and attending schools where the majority of students are eligible for free/reduced-price meals and members of historically marginalized racial/ethnic groups require more pointed attention in the consideration of employment and other postschool goals. Membership in linguistic minority communities may magnify risks associating poverty and SWDs (Oswald, Coutinho, & Best, 2002; Skiba, Poloni-Staudinger, Simmons, Feggins-Azziz, & Chung, 2005), and general education settings characterized by unchallenging curricula and inadequate materials, subpar physical space and resources, and a less-experienced teaching force associated with poverty create gaps in opportunity (Ladson-Billings, 2006). Poverty has been also considered an important influencing factor specifically for SWDs and postsecondary education enrollment and degree attainment (Madaus, Grigal, & Hughes, 2014). These obstacles may seem beyond educators’ direct reach. Yet targeted transition education is designed to address postsecondary employment and education goals, and these were often missing on these ELSWDs’ transition plans representing a missed opportunity to potentially address these needs.
Academics, Graduation, and Postschool Outcomes
On the surface, ELSWDs had access to core academics associated with postsecondary preparation; however, their course-taking patterns are difficult to interpret. Although we found no significant differences in general and special education course enrollment between ELSWDs and SWDs, the number of academic Carnegie units earned by ELSWDs was significantly higher than SWDs. This finding surprised us because it does not seem to fit the well-documented patterns of difference in achievement between ELs and non-ELs. Based on consistent gaps in National Assessment of Educational Progress (NEAP) data, ELs with and without disabilities have scored far lower (on average, 45 points lower on eighth-grade reading and 41 points lower on eighth-grade math in 2013) than their peers who are not EL, since 1998 (Kena et al., 2014). Therefore, this finding, albeit a positive one, begged additional questions. More research is needed to understand whether this is a possible indication of inaccuracies in disability identification. The availability of ESL/bilingual educators in core academic subjects is also unknown. Furthermore, little is known about program characteristics, instructional delivery, and shared roles and responsibilities of ESL/bilingual, special, and general educators. For SWDs, generally, however, access to the general education curriculum, inclusive education, and individualized planning influence successful transitions to adulthood in the domains of postsecondary education and employment (Test, Mazzotti, et al., 2009; Wehmeyer, 2002), making these variables of interest for ELSWDs.
In this study, graduation rates of ELSWDs are commensurate with those of SWDs. This finding is surprising given that disability, immigrant status, and poverty, and other factors associated with the ELSWD population are also correlated with elevated dropout rates (Aud et al., 2011, Aud et al., 2013). High school completion rates for ELSWDs have much room for improvement potentially leading to better outcomes in postsecondary enrollment and employment. Furthermore, these data shed little light on the paths to postsecondary education for ELSWDs. Unfortunately, ELSWDs were significantly less likely than SWDs to have been employed at some point since high school and prior to the fifth wave of data collection, at which point the youngest ELSWDs would have been 19 years old and eligible for full-time employment. Limited employment and postsecondary may indicate citizenship documentation issues face by some ELSWDs.
Implications for Research and Practice
The NLTS2 data provide an important first glance at the characteristics, transition experiences, and postschool outcomes for ELSWDs; however, future research is needed to go beyond the descriptions that can be gleaned from NLTS2 analyses likely necessitating the implementation of small scale studies that use methods for in-depth examination of ELSWD transition experiences. For example, we need to know how disability identification is associated with variables related to immigration histories, community language experiences and environments, and reclassification and/or long-term EL status. Also, to better understand differences in high- and low-incidence disability identification, in-depth data on the processes and reasons influencing identification decisions are critical. Previous research has focused on elementary referral processes and distinctions between English acquisition and disability (Artiles & Klingner, 2006), but secondary identification and services need examination. The NLTS2 data provide important information such as the underrepresentation of ELSWDs in the EBD group, yet we need additional research to determine why this is so.
Although the NLTS2 data help us understand the scope of poverty for the ELSWD population, understanding how and why the high likelihood of both having a transition plan and one that teachers considered to be aligned with postsecondary goals did not correspond to more employment and postsecondary education goals for ELSWDs is confusing. Yet, the ELSWD population in the NLTS2 demonstrated relatively high course credits and graduation rates, making aspects of resiliency for this population (e.g., such as individualized attention via special education) of interest for further study. Recent work linking academic task engagement, achievement, and school attendance (Fantuzzo, LeBoeuf, Rouse, & Chen, 2012); self-determination and positive racial identities (Goodkind, Hess, Gorman, & Parker, 2012); and positive peers and teacher relationships (Zolkoski & Bullock, 2012) to academic achievement for adolescents without disabilities pinpoint potential future variables of interest in studies of ELSWDs. In particular, further research on self-determination, associated with SWD employment (Madaus & Shaw, 2006) and with positive outcomes for ELs without disabilities, may forward our understanding of ELSWD transition and postschool outcomes.
The NLTS2 dataset reflects some previously identified predictors of postschool outcomes in planning and secondary programming such as student participation in IEP meetings. This analysis provides a glimpse of how ELSWDs experience those predictive factors; however, additional research is needed to examine how parents’ and adolescents’ attitudes about and use of languages (e.g., identifying English as the predominant home language) affects such planning and participation in goal setting. For example, the evidentiary support of participation in transition planning is among some of the strongest in predictors of positive postschool achievement (Test, Fowler, et al., 2009; Test, Mazzotti, et al., 2009), yet ELSWDs have not generally been the focal population for large-scale studies. Replication of this body of work with ELSWDs is important. This analysis shows that, despite high rates of planning and participation by parents and adolescents, outcomes in employment and postsecondary remain low. Generalizing evidence-based practices to ELSWDs requires a more complete knowledge base.
Moreover, establishing an effective set of interventions requires culturally responsive research design, implementation, and analyses disaggregated by salient learner and contextual characteristics (Trainor & Bal, 2014). Although some NLTS2 interviews were collected in Spanish, the study was not designed for interviewing bilingual populations, and concepts such as disability and parent participation may require context that goes beyond the direct translation (Kalyanpur & Harry, 1999), such as discreet, low-context survey items. Qualitative methodologies support contextualization and knowledge depth while providing opportunities for researchers to address interpretation and co-constructed perceptions about experiences alongside community insiders. For example, understanding the barriers to transition planning for ELSWDs might explain why transition planning may not be sufficient for goal attainment. Furthermore, examining the intersectionality of race/ethnicity, disability, socioeconomic status (SES), and language will augment our understanding of transition experiences and outcomes of diverse young adults that comprise the ELSWD subpopulation (Arzubiaga et al., 2008; Garcia, Ortiz, & Sorrells, 2012). This may require oversampling, as did the NLTS2 recruitment for low-incidence disabilities.
Implications for practice include the need for teachers to have a sophisticated understanding of ELSWD home and school experiences contributing to special education referrals. In addition, prioritizing transition-related academic and linguistic preferences, strengths, and needs that align with individual and family is needed. For example, many ELSWDs in this study experienced poverty and had parents who did not attend postsecondary education, both of which have implications for increasing knowledge about college and vocational postschool programs.
Course-taking patterns also revealed that ELSWDs are accruing credits in general education, underscoring the importance of collaboration between special and general educators (including bilingual/ESL and vocational teachers) to maximize a complete understanding of the student’s present level of performance and to identify appropriate instructional approaches. Together, educators should consider students’ curricula individually paying careful attention to resources and needs associated with second language learning, disability, and postsecondary goals in both postsecondary education and employment. Competing demands for courses and challenging scheduling issues will likely emerge, underscoring the need for ongoing assessment necessary for educational decision making, one requirement of IDEA that is not easily tracked using NLTS2 data. Furthermore, previous studies have demonstrated that parent involvement is critical to transition and that immigration experiences influence parents’ perceptions, making teachers’ use of culturally responsive communication essential for meaningful involvement (Rueda, Monzo, Shapiro, Gomez, & Blacher, 2005; Trainor, 2005, 2007).
Exploring transition for this nationally representative sample of secondary ELSWDs illustrates notable patterns that inform how we research and educate this group of adolescents whose prevalence is increasing. As this population continues to grow, the need for a more precise understanding of special education transition for ELSWDs is underscored to effectively provide equitable access and positive outcomes.
Footnotes
Declaration of Conflicting Interests
The author(s) declared no potential conflicts of interest with respect to the research, authorship, and/or publication of this article.
Funding
The author(s) received no financial support for the research, authorship, and/or publication of this article.