



Abstract
Individuals who are deaf have historically faced significant obstacles to equity in employment. This secondary analysis of data from the second National Longitudinal Transition Study (NLTS2) examined (a) intensive vocation-related courses taken by students who are deaf and (b) their impact on long-term employment outcomes. Deaf students in general education schools and special education schools were equally likely to take a four-course sequence of vocational classes. However, students in general education schools were less likely to enroll in at least a year of work-study courses. Propensity score analyses indicate there were no significant effects of enrollment in vocation-related course taking on employment outcomes for deaf students within the study time frame. Implications of these findings are provided both in terms of how the NLTS2 dataset is used to determine significant predictors of longer term outcomes for deaf individuals and potential inferences of nonsignificant results for the field.
For many individuals, secure and gainful employment is a pathway toward independent living and meaningful contributions to a diverse and vibrant society (Jahoda, 1981). In contrast, underemployment or lack of opportunity to develop one’s career path can contribute to ongoing economic, physical, and mental health challenges for individuals and their families (Dooley, Prause, & Ham-Rowbottom, 2000; O’Brien & Feather, 1990; Payne, Warr, & Hartley, 1984). Yet for many traditionally marginalized groups, access to training and sustainable careers has been out of reach (Phelps & Hanley-Maxwell, 1997; Rusch, Hughes, Agran, Martin, & Johnson, 2009; Wagner, Newman, Cameto, Garza, & Levin, 2005; Wells, Sandefur, & Hogan, 2003). Individuals who are deaf or hard-of-hearing (deaf, see Note 1), the focus of this study, face many obstacles to reaching successfully their potential in education and in the workforce (Freebody & Power, 2001). Some of these issues are a result of systemic challenges that are similar to those faced by students with other disabilities, such as the need for employers to build an inclusive workplace environment (Charles, 2004; Hendricks, Dowler, & Judy, 1994). Other challenges lay in the need for individuals to develop successful strategies for navigating the transition from school settings to workplace settings (Bullis, Davis, Bull, & Johnson, 1995; Carter, Austin, & Trainor, 2012). The purpose of this article is to focus specifically on vocation-related course taking experiences that students have while they are in high school, particularly those afforded to individuals who are deaf as part of their larger transition planning process.
Consideration of the demographic characteristics of individuals who are deaf is foundational to understanding the potential impact of secondary school experiences on later postsecondary employment, particularly in the area of school programming and transition support. The low-incidence nature of this population results in transition service professionals having limited experience working with students who are deaf (Cawthon & The RES Team, 2012). Fewer than 5,000 students who are deaf, and receiving services, left high school in the 2010–2011 school year, representing less than 1% of the exiting high school population in the United States (National Center for Education Statistics, 2013; U.S. Department of Education, 2013). Individuals who are deaf comprise a highly diverse population in terms of etiology of deafness, cultural identification(s), language usage, and communication modality (Marschark, Lang, & Albertini, 2002). The diversity within the deaf student population increases the degree of expertise needed for education professionals to serve students effectively (Cawthon & The RES Team, 2012). For example, students who are deaf may use both visual and auditory language modalities to communicate, including American Sign Language (ASL), spoken English, sign-supported English, and text-based representations of English (Baker-Shenk & Kyle, 1990; De Clerck, 2010; Najarian, 2008).
Deaf education has a distinct history that had, up until early versions of the Individuals With Disabilities Education Act (IDEA; 1997), largely resulted in separate education placements for students who are deaf. In addition to local programs linked to district or other regional educational structures, schools for the deaf in the United States have been a significant part of the Deaf community for over 100 years, and serve as a potential placement for students who may not have full access to instruction in a general education classroom (Van Cleve, 2007). Students who are deaf have a broad range of overlapping individual, family, and community identities, as well as potential co-occurring disabilities (Shaver, Marschark, Newman, & Marder, 2014), all of which may influence decision-making about education and training for future careers (Foster & MacLeod, 2004; Goldhaber, 1999; Li, Bain, & Steinberg, 2003; Punch, Creed, & Hyde, 2006; Schick et al., 2012).
Education and training are traditionally important antecedents to successful employment for all individuals, and there is evidence of strong progress toward parity in educational attainment for deaf individuals (Newman, Wagner, Cameto, Knokey, & Shaver, 2010). Although high school graduation rates need improvement, with less than 75% of exiting deaf students receiving a high school diploma (U.S. Department of Education, 2013), these levels are comparable with their hearing peers. One unique aspect of postsecondary education for deaf students is opportunity to attend schools specifically designed for deaf populations. Established institutions include Gallaudet University, National Technical Institute for the Deaf at Rochester Institute of Technology, and large programs at locations such as California State University, Northridge. However, the majority of students who are deaf now enroll in general education programs for postsecondary education. Recent postsecondary education enrollment rates for deaf individuals are also on par with hearing peers, at nearly 75%, a 30% increase from 15 years earlier (Newman et al., 2010). Postsecondary graduation is also at similar levels with hearing peers, at about half of the enrolled population. Although trends in postsecondary enrollment and graduation for deaf young adults seem promising, there are some important nuances to consider. For example, although enrollment in postsecondary training is comparable between deaf individuals and hearing peers, deaf individuals are more likely to enroll in a 2-year degree program (51% of enrolled individuals) than hearing peers (21% of enrolled individuals). On the contrary, deaf individuals are far more likely to enroll in a 4-year program (34%) than students with disabilities as a whole (19%), and not far behind the general population (40%; Newman et al., 2011). One’s perspective on the success of transition outcomes for deaf individuals thus depends, in part, on the reference group (e.g., students with disabilities or hearing peers) and definition of success (e.g., persistence through training and type of degree attained).
Despite positive postsecondary enrollment trends and improvements in legal policies surrounding access, anti-discrimination, and the workforce, particularly through the Americans With Disabilities Act, employment outcomes for individuals who are deaf remain mixed (Pepnet2, 2014; U.S. Department of Commerce, Bureau of the Census, 2011). Employment rates for deaf individuals in 2011 was an estimated 48%, compared with 70% of the general population, and nearly twice as many deaf adults aged 21 to 65 (45%) as the general population (23%) were not in the workforce. However, young individuals who are deaf (ages 21–25) were employed at rates less than 10% below their hearing peers, nearly at equal levels. A related issue is that of underemployment or employment at positions that are below an individual’s training (MacLeod-Gallinger, 1992; Schroedel & Geyer, 2000; Winn, 2007). Underemployment is troublesome because it means that the investment of time and resources an individual makes to improve employability are not fully realized. There is some evidence that individuals who are deaf receive more training for the same level of work as their hearing peers, an indicator of disproportionate underemployment compared with the general population (Cawthon & The RES Team, 2012). This effect can be cumulative over a person’s work history and can affect mobility into higher levels of employment over time (Kelly, 2013). Even when holding the same credentials, deaf individuals express frustration at being passed over for advancement and skill development (Cawthon & The RES Team, 2012). A discrepancy in wages and opportunity for career advancement highlights a need to understand what factors contribute to career development and long-term sustainable employment for individuals who are deaf.
Transition Planning Legislation, Design, and Impact
In the past, educational transition referred to the period of time immediately following high school in which young adults entered the postsecondary realm of employment or higher education (Collet-Klingenberg, 1998). A more contemporary conceptualization of educational transition for students with disabilities refers to the “passage from one distinct educational stage to the next, during which children and youth may enter, continue, or exit from special education services” (Cameto, Levine, & Wagner, 2004, p. 1). As the field has recognized that students with disabilities, including those who are deaf, have not had adequate support to make a successful transition out of secondary and into postsecondary education and employment settings, recent reauthorizations of IDEA have focused specifically on transition services (Carter et al., 2012; IDEA, 2004; Lindstrom, Kahn, & Lindsey, 2013; Murray & Doren, 2012). The transition component of a student’s Individualized Education Program (IEP) plan must now include measurable postsecondary goals related to vocational training, education, employment, independent living skills, and the coursework services needed to assist the student in reaching those goals.
Transition planning, including the development and implementation of an IEP, encompasses a wide range of domains. In a review of correlational transition literature, Test et al. (2009) created a taxonomy of evidence-based transition practices, including school-based activities such as paid employment/work experience, course taking, independent living and social skills training, vocational education, and transition programming. More specifically related to employment outcomes, previous research has linked high school work experience with successful postschool vocational outcomes for students with disabilities (e.g., Bullis et al., 1995; Irvine & Lupart, 2008; Rabren, Dunn, & Chambers, 2002; Test et al., 2009). The effect can be pronounced, such as a twofold increase in the likelihood of postschool employment for students who participated in work-study programs (Baer et al., 2003). Several studies have demonstrated the importance of integrated transition programs or transition programming that combines skill-development-focused course content, school-supervised work experiences, employability, and functional occupational skill building, and academics appear to produce better vocational outcomes for students with disabilities (Phelps & Hanley-Maxwell, 1997). Shandra and Hogan (2008) found that students who participated in programs that combined academic and vocational studies in a job field that was related to the student’s occupational interests were more likely to be employed after high school.
Although there are strong employment-related outcomes associated with many transition practices, other research has demonstrated that not all work experiences are equally predictive of future employment for youth with different types of disabilities. For example, in a study on the influence of early work experiences on future employment for youths with visual impairments, McDonnall and O’Mally (2012) found that student participation in school-sponsored work alone was not associated with future employment. Rather, level of future employment was associated with the degree to which students with visual impairments found a job independently, held multiple jobs, and held jobs for longer periods of time during their transition years. Wagner, Newman, and Javitz (2015) analyzed the relationship between career and technical course taking with short- and long-term employment outcomes for individuals with learning disabilities; although there were some short-term benefits for some types of courses, their study did not indicate an effect in later years. In an application of the Test et al. (2009) taxonomy on transition planning for students who are deaf, Coyle (2012) investigated the relationship between in-school practices and education and employment outcomes for students who were educated in general education settings. Her regression analysis found that factors such as inclusion in general education for a large majority of the school day (vs. instruction mainly in pull-out or separate settings), obtaining a regular high school diploma, parental satisfaction, work-study, paid work, and inter-agency involvement in transition were related to positive postsecondary employment.
Some recent research in deaf education raises questions as to the adequacy of preparation for deaf individuals for employment after high school (Luft, 2012). Wagner, Newman, and Cameto (2004) indicated that the proportion of courses students who are deaf take that are related to career and technical education has dropped as emphasis on academic courses has increased, potentially leading to a decreased level of readiness for the workforce. Using the Transition Competence Battery to measure the transition strengths and needs of 53 deaf students in middle and high school, Luft and Huff (2011) found that the majority of students were lacking skills to acquire employment and to live independently. The authors suggested that school-based transition programming for students who are deaf should focus on long-term needs and skill building rather than focusing on skills needed immediately after high school (see also Luft, 2012).
The Present Study
Current research on transition programming suggests that individuals with disabilities may experience differential outcomes based on specific course enrollment, and programs and services they receive in high school (Baer et al., 2003; Harvey, 2002; McDonnall & O’Mally, 2012; Repetto, Webb, Garvan, & Washington, 2002; Shandra & Hogan, 2008; Solberg, Howard, Gresham, & Carter, 2012). Furthermore, studies by Luft and colleagues suggest that more intensive experiences, those that work toward long-term vocational skill building, are especially needed for deaf students. The purpose of this study was to (a) describe intensive vocation-related course taking utilized by students who are deaf and (b) measure the impact of taking such courses on long-term employment outcomes.
Method
Dataset
NLTS2 data collection
This secondary analysis used data from the second National Longitudinal Transition Study (NLTS2; Newman et al., 2011), a large-scale, longitudinal study of transition experiences of students with disabilities, including individuals who are deaf. The OSEP and the Institute for Educational Sciences (IES) commissioned the NLTS2 dataset so that researchers would have a resource to understand the accomplishments of students with disabilities (Newman et al., 2011). Surveyors collected data biannually in five waves, beginning in 2001 and ending in 2009. Youth were between 13 and 16 years old in the first wave, making them between 21 and 25 years old in the final wave. Surveyors contacted youth, their parents, their teachers, their school administrators, and other stakeholders for different components of the data collection process. The remainder of this section discusses data collection procedures for NLTS2 as a whole; demographics of the deaf students included in this analysis are provided in the “Study Participants” section.
NLTS2 employed a sampling scheme that used stratification and weighting to improve generalizability and increase the precision of estimation. The design stratified at both the local education agency level and at the disability status level. To stratify local education agencies, surveyors categorized each agency on the basis of region, enrollment size, and district wealth. After education agencies were stratified and randomly sampled, students with disabilities were then stratified on the basis of their primary disability. Based on statistics from other government agencies, NLTS2 surveyors then provided sample weights for each student in this stratified sampling scheme. The current analysis used sample weights calculated for any wave and any source, as data were drawn from parents, students, the school program, and transcripts. The rest of this subsection gives more exact detail on the stratification process for local education agencies.
First, the region stratification categories included Northeast, Southeast, Midwest, and West, categories used by the U.S. Department of Commerce, the National Assessment of Educational Progress, and the U.S. Bureau of Economic Analysis. In other words, the region stratification in NLTS2 aligns with other similar stratification schemes in other large-scale datasets of American employment and education outcomes. Next, surveyors based the school enrollment size stratification on the number of students enrolled in Grades 7 to 12, inclusive. Enrollment sizes of fewer than 1,600 students were classified as being small. Enrollment sizes between 1,600 and 4,700 were classified as medium-sized. Enrollments of 4,700 to 15,000 students were classified as large; and finally, if a local education agency had more than 15,000 students, its enrollment was classified as being very large. The district wealth stratification was based on the Orshanky index (i.e., the percentage of students below the poverty line; see Fisher, 1992). Education agencies had low district wealth if 25% to 43% of youth lived below the poverty line. Alternatively, education agencies with 14% to 24% of youth below the poverty line were classified as having medium district wealth. Outside this range, education agencies were classified as having either high or very low district wealth. Finally, it should be noted that the NLTS2 oversampled at schools serving students with disabilities, including schools for the deaf.
Study inclusion criteria
The inclusion criteria for this analysis were twofold. First, individuals were included if their district-designated primary disability was the Federal disability classification of “hearing impaired.” These data were taken from the district roster. The NLTS2 dataset did not distinguish between deaf or hard of hearing students in this initial classification (see additional information in the description of study participants). Second, to be included in any particular analysis, a youth had to have nonmissing data on the treatment variable (described in the study variable section, below). These criteria resulted in a sample size of 580 (out of 9,230 students in the total sample for the first wave) and 460 (out of 5,310 students in the total sample for the fifth wave) in the final wave.
Study Participants
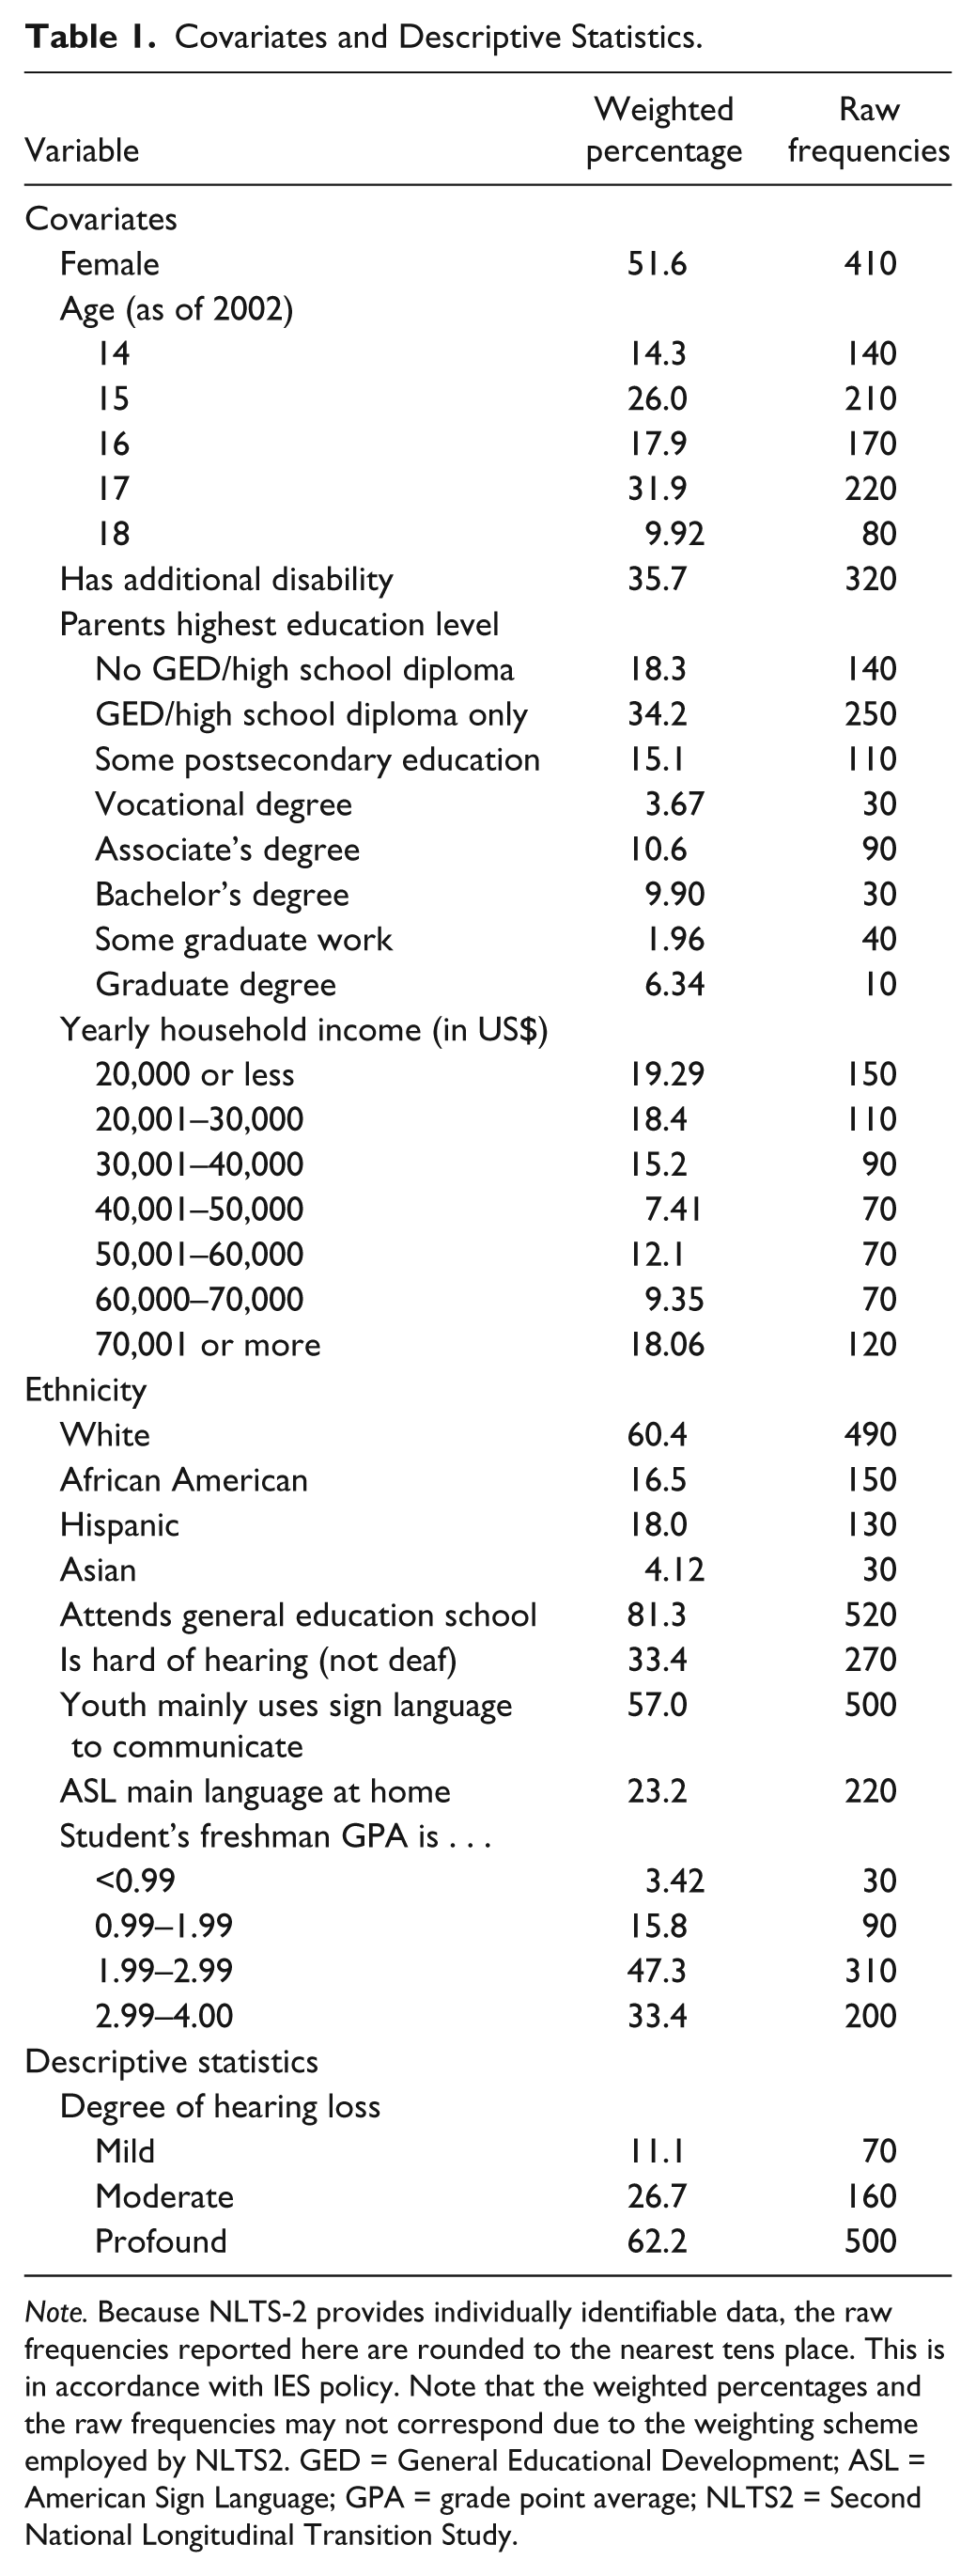
Descriptive statistics for the sample, both in weighted percentages and in frequencies, are included in Table 1. With the exception of degree of hearing loss, all of these variables were used as covariates in the propensity score analysis. Just over 80% of the sample was enrolled in a general education school in Wave 1 of NLTS2 data collection. In the first wave of data collection, parents gave a description of the school type their child attended in the past year. This question included a variety of alternative settings such as whether or not the child attended a charter school, a magnet school, or a juvenile justice facility. In this study, we provide data on the prevalence of intervention use in the first two placement options listed on the parent questionnaire: (a) a regular school that serves a wide variety of students (i.e., general education school) and (b) a school that serves only students with disabilities (i.e., special education school). The general education school category thus includes students who are in special education settings such as pull out or support services for part of the day but who also spend part of their instructional time with students without disabilities. The special education school category includes institutions that primarily serve students with disabilities in a separate environment, including schools for the deaf. Because the NLTS2 instrument was designed for a broad demographic sample, the survey did not allow parents to designate whether their child attended a school for the deaf, specifically, or to make distinctions between residential and day schools.
Covariates and Descriptive Statistics.
Note. Because NLTS-2 provides individually identifiable data, the raw frequencies reported here are rounded to the nearest tens place. This is in accordance with IES policy. Note that the weighted percentages and the raw frequencies may not correspond due to the weighting scheme employed by NLTS2. GED = General Educational Development; ASL = American Sign Language; GPA = grade point average; NLTS2 = Second National Longitudinal Transition Study.
The sample included 11.1% of youth with a mild hearing loss, 26.7% with a moderate hearing loss, and 62.2% with a profound hearing loss. Although the inclusion criterion for “hearing impairment” was a general one, this analysis also included three covariates in the dataset related to deafness and language use: “is hard of hearing (vs. deaf),” “mainly uses sign language to communicate,” and “American Sign Language (ASL) is the main language at home.” In this sample, 33.4% of youth were considered hard of hearing, 57% primarily used sign language to communicate, and 23% had ASL as the main language at home.
Table 1 also includes information on additional demographic variables used as covariates in this analysis. For example, just over 60% of participants were Caucasian. Ethnicity data were taken as indicator variables for African American, Asian, and Hispanic students, against a Caucasian comparison group. Although the literature indicates a need for more careful exploration of racial categories and overrepresentation of racial minority groups within special education research (Sullivan & Artiles, 2011), within the context of propensity score matching, the choice of Caucasian as a comparison group has a specific analytical function. The purpose of propensity score matching is that the treated and control groups need to have a similar demographic makeup. If all but one demographic covariate is similar between these groups, then the last covariate, of being Caucasian, must be similar also. This allows for unbiased causal inference.
A variety of variables for a range of co-occurring disabilities were included in the propensity score analysis, with separate indicators for students who had an attention deficit disorder, students who were deaf-blind, students who had a learning disability, students with intellectual disabilities, students with orthopedic impairments, and students with other health impairments. A total of 35.7% of sample participants were identified as having some sort of additional disability. The freshman-year GPA, drawn from the student transcripts, corrects for student achievement in this analysis. Although other achievement data are available, such as the Woodcock Johnson III score, it is possible that those data were collected after students participated in the independent variable. In propensity matching analysis, it is important that the covariates be exogenous to the independent variable. Therefore, no other achievement variables were used as covariates.
Variables
Independent variables and covariates for this analysis were entirely drawn from the first two waves of NLTS2, which were collected in 2001 and 2003. The dependent variables were drawn from across the last three waves, ending with the final wave in 2009.
Independent variables
Two of the independent variables were taken from the school transcript, and one was taken from the parent–youth survey. Parents and youth reported whether the student had a stated IEP goal of developing vocational or prevocational skills. From the transcript, one variable reported whether the student had taken more than 1 year’s worth of instruction in a work-study program. Finally, the last independent variable reported whether the student had taken a sequence of vocational courses, that is, four or more courses in the same occupational area.
Dependent variables
There were one binary and three continuous employment outcomes measured in this analysis. The binary outcome reported whether the student was promoted, got a raise, or felt that she had opportunities to work her way up in her work environment (i.e., the variable was coded as “true” if one or more of these occurred). The first continuous outcome reported the youth’s hourly wage, if employed, in the final wave of analysis. The second continuous outcome reported the number of jobs the youth had since graduating from high school. The final continuous outcome, the job satisfaction score, consisted of seven questions which evaluated satisfaction with compensation, career advancement potential, and social aspects of work.
Propensity score covariates
Covariates in this analysis have largely been drawn from prior research on factors that affect educational and occupational outcomes for deaf students using the NLTS2 (Cawthon, Garberoglio, Caemmerer, Bond, & Wendel, 2015; Coyle, 2012; Garberoglio, Cawthon, & Bond, 2013; Garberoglio, Schoffstall, Cawthon, Bond, & Ge, 2014; Marschark, Shaver, Nagle, & Newman, 2015; Shaver et al., 2014), as well as for youth with disabilities as a whole (Shogren, 2013; Shogren, Kennedy, Dowsett, & Little, 2014; Shogren, Wehmeyer, Palmer, Rifenbark, & Little, 2015). More specifically, we co-varied for all of the demographic information provided in Table 1 with the exception of degree of hearing loss (i.e., classifications of mild, moderate, and profound). These hearing loss designations, without additional information such as age of onset or type and degree of access to language, are not reliable predictors of many language, academic, and employment outcomes for deaf individuals, and thus have been included only as descriptors in this analysis.
In addition to the demographics in Table 1, we included covariates on parent perspectives about their child: parent expectations for future outcomes and parent rating of their child’s social skills. Previous research has found these parent expectations to be predictive of transition outcomes for students with disabilities in general (Carter et al., 2012; Doren, Gau, & Lindstrom, 2012; Froiland, Peterson, & Davison, 2012) and for deaf students, in particular (Cawthon, Garberoglio, et al., 2015). Parent expectations covariates were drawn from the parent survey. First, parents stated the likelihood that the student would attend postsecondary school, on a 4-point scale. Second, parents stated the likelihood that the student would live away from home without supervision, also on a 4-point scale. Finally, this analysis included a measure of student social skills, the parent rating utilizing the Social Skills subscale of the Social Skills Rating Scale (SSRS; Gresham & Elliott, 1990). Parents rated 11 questions, on a 3-point scale, measuring how often their child exhibited different kinds of social competencies. These questions represented three different social competency domains: assertion, self-control, and cooperation. In a broad sense, assertion measured “youth’s ability and willingness to become involved in social activities,” self-control measured “youth’s ability to cope with frustration and to deal with conflict,” and cooperation measured “youth’s ability to cooperate and stay on task” (Wagner, Cadwallader, & Marder, 2003). Previous findings indicate that social skill development in high school may be related to high graduation rates in postsecondary settings; findings are mixed as far as a predictor of long-term employment outcomes (Cawthon, Caemmerer, et al., 2015).
Propensity Score Analysis Plan
In contrast with regression analysis, propensity score analysis corrects for the effect covariates have on the treatment assignment process (see Note 2). Rather than modeling the relationship between the treatment and the outcome directly, propensity score analysis begins by modeling the treatment assignment as a logistic regression, dependent on a variety of covariates. The ultimate objective of this logistic regression is to define treated and untreated groups that are similar on the set of identified covariates. To do this, the propensity score, defined as the probability of being treated, is obtained for each participant from the logistic regression. Next, treated and untreated participants are matched so that their propensity scores are similar. Participants with the same propensity scores must have the same distribution of covariates (Rosenbaum & Rubin, 1983), which removes this source of bias in the relationship between the treatment and the outcome.
Finally, once treated and untreated participants are matched on the basis of this propensity score, regression analysis or t tests may be used to estimate the treatment effects. The t tests may be preferred for their simplicity in some cases, but this study uses regression analysis to correct for whatever bias remains in the covariates. Theoretically, a perfectly matched dataset on the propensity score would ensure that no bias would exist, but in practice, perfect matches are extremely unlikely. As such, regression analyses correct for the remaining difference in the covariates.
The analysis proceeded in three stages to estimate the average treatment effect on the treated (ATT). First, a propensity score model was fitted for each program, using the study covariates. To handle missing data, we used multiple imputation with chained equations (van Buuren & Groothuis-Oudshoorn, 2011) in R (R Core Team, 2013), and took the propensity score as the average value across imputations. This multiple imputation process did not include any treatment or dependent variables. Once the propensity score had been estimated for a treatment, a caliper matching procedure was conducted, matching students within 0.25 standard deviations on the propensity score, without replacement, using the “Matching” package in R (Sekhon, 2011). Next, balance was assessed for each covariate (postbalance statistics available upon request). Adequate balance was defined as a less than 0.25 standardized mean difference (Ho, Imai, King, & Stuart, 2007). These balance assessments were completed using the weighted data. When inadequate balance was obtained on more than two covariates, interaction terms and squared terms were added to the propensity score model. We repeated this process until we had adequate balance on at least all but two covariates for each intervention. To correct for the remaining imbalance postmatching, all the covariates were used in ordinary least squares (OLS) regression on the postmatching dataset to estimate the effect of each treatment on the outcomes. The treatment variable was allowed to interact with each covariate in the latter regressions, and we used a type I error rate of 0.01. Multiple imputation with chained equations was used again in these latter regression analyses (van Buuren & Groothuis-Oudshoorn, 2011). For each multiple imputation, we used 20 imputations and 10 iterations. Every covariate in this analysis had at most a 20% rate of missingness. No variable of substantive interest was eliminated due to a high rate of missingness.
The use of multiple imputation requires the assumption of data being missing at random (MAR), meaning that, once covariates are controlled for, the probability of a variable being missing does not depend on the value of that variable (Allison, 2001). In short, the assumption is that there is no response bias after correcting for every variable. While it is not possible to evaluate this assumption directly, having a large number of variables in the missing data model makes the assumption more credible (Collins, Schafer, & Kam, 2001). The large number of covariates in this study, in combination with the relatively low rate of missingness, helps to ensure the feasibility of this assumption.
Throughout the analysis, unless otherwise noted, we used the survey package in R to account for the survey sampling design (Lumley, 2004). Because NLTS2 was intended to be nationally representative, surveyors employed a stratified weighted sampling scheme. As such, both the propensity score matching and the later regression analyses were adjusted using the weighting, cluster, and stratification data provided in the dataset, using the weights calculated for any wave and any data source.
Results
Descriptive Statistics
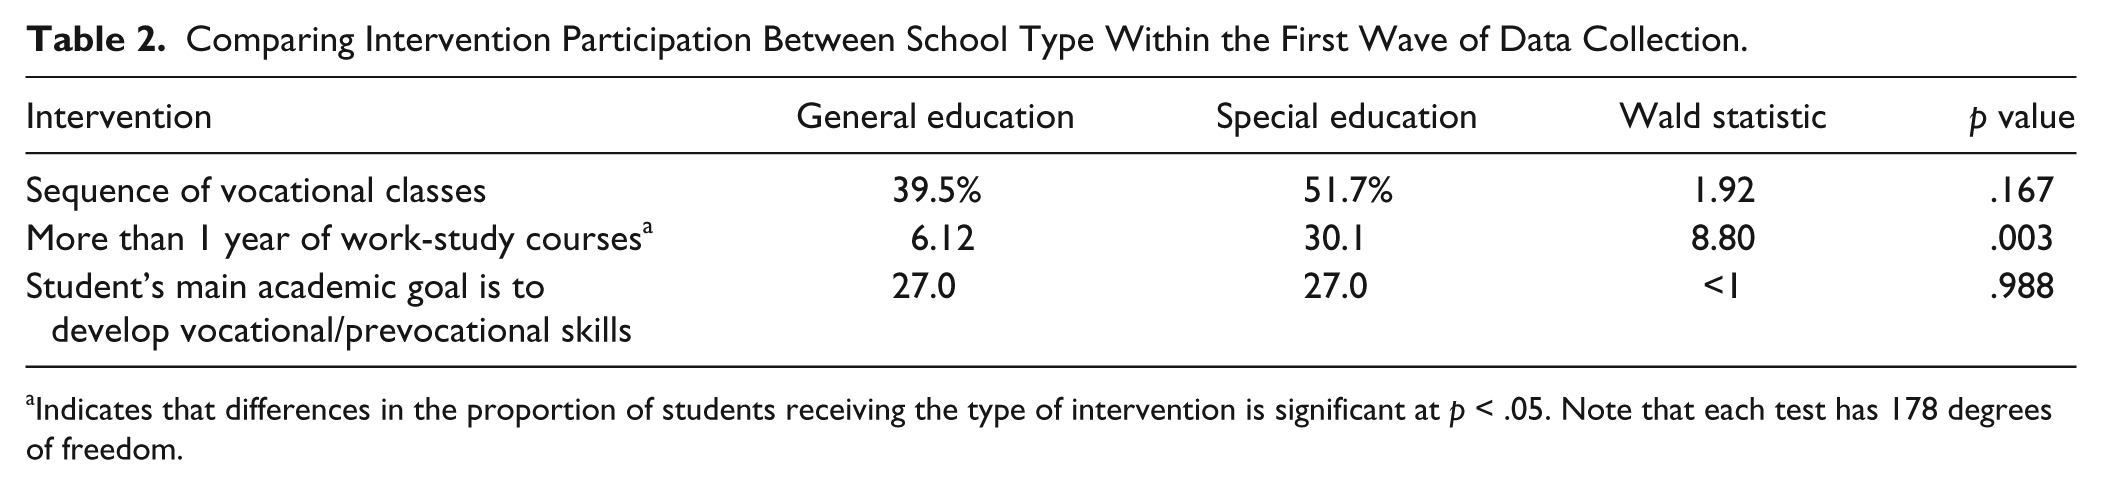
The first purpose of this study was to describe vocation-related course taking utilized by students who are deaf (see Table 2). Because of the historical emphasis on educational placement within deaf education, we disaggregated these data between general education schools and special education schools. First, there were no differences in the proportion of deaf students who had a main academic IEP goal to develop vocational/prevocational skills (27% for both general education and special education schools). Given what we know about the complexity and potentially overlapping characteristics of students who are deaf across school type in secondary grades, this is perhaps not a surprising result (Shaver et al., 2014).
Comparing Intervention Participation Between School Type Within the First Wave of Data Collection.
Indicates that differences in the proportion of students receiving the type of intervention is significant at p < .05. Note that each test has 178 degrees of freedom.
What did implementation of these IEP goals look like in terms of course taking related to vocational skill development? Our analysis focused on intensive experiences, those that had the potential to build skills over a long period of time and thus more likely to have an impact on later employment outcomes. Students in general education schools (39.5%) and special education schools (51.7%) were equally likely to take a sequence of vocational classes (four or more courses on a specific occupational area) as part of their high school curriculum, χ2(178) = 1.92, p = .162. This finding shows that a substantial proportion of students who are deaf receive coursework that could help prepare them for more advanced work in a content area as part of their transition into a postsecondary training or employment experience. However, a smaller proportion of students, 6% and 30% for general education and special education schools, respectively, enrolled in more than 1 year’s worth of work-study courses while in high school (χ2 = 8.80, p < .01).
Propensity Score Models
First, we report two-way relationships for each intervention variable (e.g., course taking) and each measured employment outcome variable. For continuous outcomes, we report naive point-biserial correlation coefficients. The relationship between identified independent variables and our outcome variables appear to be weak. More specifically, every correlation between coursework enrollment and long-term employment outcomes were less than 0.20. Also, for the binary outcome of promotion opportunities, no two-by-two chi-square test with coursework taken and the binary outcome was statistically significant. Although the naïve estimates of the treatment effects are low, it is possible that this is due to heterogeneity in the treatment effect, which the later analysis accounts for.
Following the procedure outlined in the analysis plan section, above, certain interaction terms were included to improve balance on the specified covariates. One out of the three independent variables achieved adequate balance without adding any of these terms. Namely, the sequence of vocational courses variable had adequate balance without adding any interaction terms. The other two independent variables each had separate specifications. First, the independent variable stating whether the student’s main IEP goal was to improve vocational skills had three interaction terms. Freshman-year GPA was allowed to interact with parent-ratings of social skill and parental expectations about their child’s postsecondary attendance. Also, parent ratings of social skill interacted with parent expectations about postsecondary attendance. It was difficult to obtain proper balance on the final independent variable, spending more than 1 year’s worth of coursework in a work-study program. Every continuous covariate except age had a two-way interaction with every other continuous covariate. In a typical regression approach, this sort of specification might be thought of as overfit. However, the only purpose of the propensity score analysis is to achieve balance on the covariates. Essentially, whatever specification achieves this is admissible in a propensity score approach (Ho et al., 2007; Sekhon, 2011).
Postmatching balance assessments
We were able to obtain balance on all covariates for each intervention. Inadequate balance was defined as a Cohen’s d greater than 0.25, or, for binary covariates, a proportionate difference greater than 0.25. A proportionate difference is defined as the difference between the treated and untreated groups in the probabilities that the binary covariate is equal to a certain value. For example, if 75% of people in the treated group were male and only 45% in the untreated group were male, there would be a proportionate difference of 0.30, and this would indicate inadequate balance on this covariate. Complete information on balance for each intervention is available upon request.
Postmatching regressions
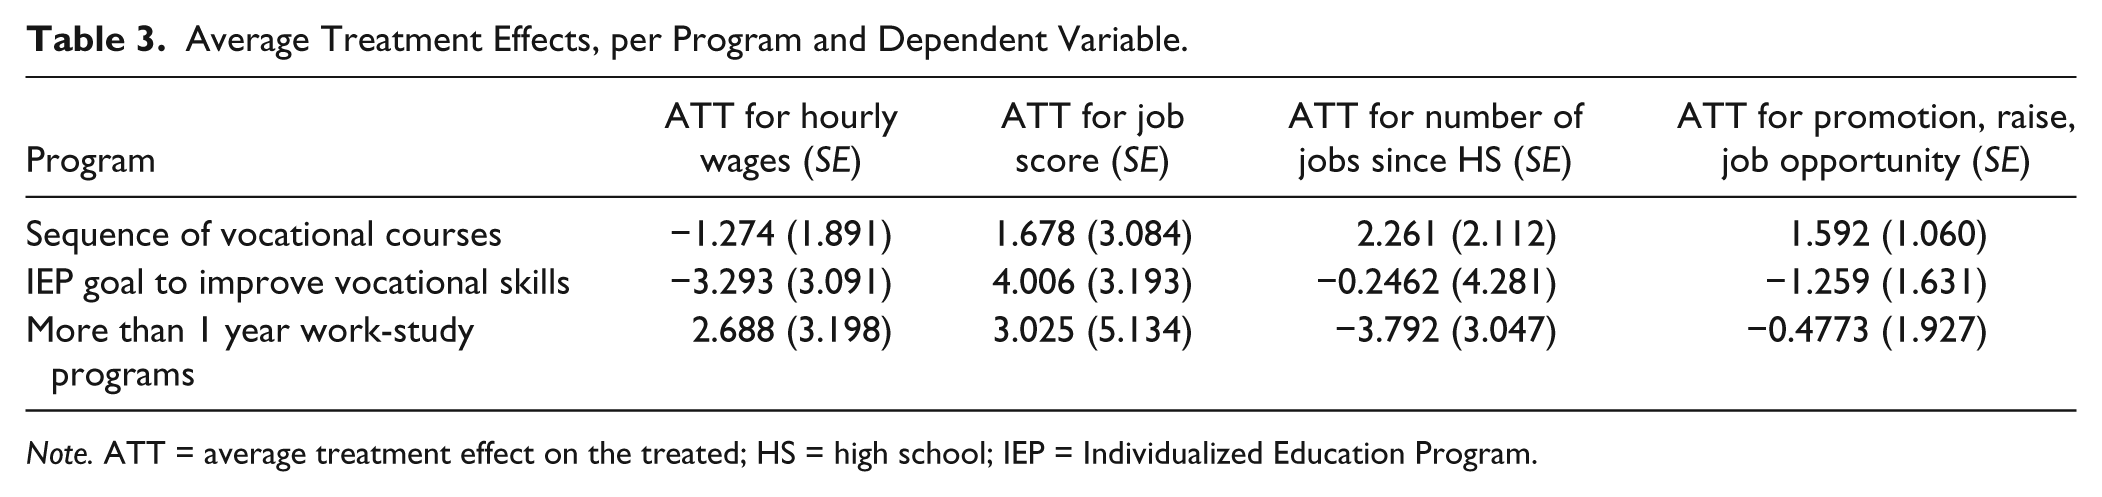
The purpose of the propensity score analyses was to estimate the effect of vocation-related course taking on employment outcomes approximately 8 years after their completion. With an alpha level of .01, we failed to find significant results on any outcomes for any intervention. Most treatment effects on the treated had standard errors that were greater than their average value. These findings were robust to matching with or without replacement. Equal numbers of this effect size were positive and negative, with standard errors sometimes twice the size of the ATT (Table 3).
Average Treatment Effects, per Program and Dependent Variable.
Note. ATT = average treatment effect on the treated; HS = high school; IEP = Individualized Education Program.
Discussion
The purpose of this study was to (a) explore the types of vocation-related courses taken by students who are deaf across general educational schools and special education schools and (b) measure the impact of taking these courses on long-term employment outcomes. We focused on intensive high school coursework experience in an attempt to capture the potential impact of longer sequences of instruction related to building vocational skills. Results of this analysis indicate that (a) deaf individuals from general education and special education schools were as likely to have a main academic IEP goal focused on developing vocational skills and to take a sequence of at least four courses in an occupational area, (b) individuals in general education schools were less likely to take more than a year’s worth of work-study courses than individuals in special education schools, and (c) deaf students who were enrolled in these courses had similar employment-related outcomes at the end of the study period as those who were not enrolled in these courses. More specific discussion of each of these findings, limitations of this analysis, potential interpretation of the propensity score findings, and implications for the field are provided below.
Prevalence
Student enrollment in intensive vocation-related coursework varied across types, with higher rates for opportunities already integrated into the school’s instructional structure than those that operated outside of it. An intensive sequence of courses in a related area was more prevalent than work-study coursework. The former category is a kind of instructional approach to transition support, one that is perhaps more reasonable in a school setting because it aligns more closely with the other resources available in a school than internships or other off-site opportunities. Work-study course enrollment levels for more than a year, in contrast were utilized by less than 10% of students in the general education school sample and no more than a third of students in the special education school sample. It is possible that there is not time in the schedule or opportunities for additional work-study beyond 1 year due to other constraints on the course schedule, particularly in general education schools where the focus is potentially on broader range of students than at special education schools. Yet these findings are higher than those found for average work-study enrollment for participants in general education settings, where work-study credits ranged on average from .2 credits to .8 credits (one credit = 1 year), depending on the disability category. Work-study courses require greater coordination between school resources and external agencies or institutions, and thus are likely more difficult to easily incorporate into a student’s transition preparation experience. Note that this analysis did not include employment experience that was separate from school-based initiatives, such as having a job on the weekends that was not facilitated by a school transition program, and that students in this sample likely did have some experiences that were outside the structure of the school setting.
When there were differences in program involvement by school type, students in general education schools were less likely to enroll in a sequence of four or more vocation-related courses than students in special education schools. The descriptive analysis of course enrollment did not include consideration of covariates, such as whether or not a student had a co-occurring disability, and thus only provides a surface view of the fit between the school type and intensive vocation-related coursework. In an overview of student characteristics drawn from the same NLTS2 sample, deaf students in special secondary schools were more likely to have profound hearing loss and a disability classification of deafness, and less likely to use spoken language, than deaf students in general secondary schools (Shaver et al., 2014). However, it should be noted that even when there were statistically significant differences in course enrollment between placements, the split between proportions of students enrolled was no more than 25%. This is a relatively small margin given the estimating procedures in the analysis. Thus, even if there were significant interactions in the data based on student characteristics, it is unlikely to provide a substantively different picture of what interventions deaf students are participating in across different types of educational placements than what is provided here.
Impact on Employment
This study also examined the potential impact of vocation-related coursework on long-term employment outcomes for deaf students. The research literature implies that we might see some positive effects of school-based transition interventions, particularly if we are able (as we were) to control for other variables that are also predictive of these types of outcomes (Baer et al., 2003; Benz, Lindstrom, & Yovanoff, 2000; Roessler, Brolin, & Johnson, 1990; Shandra & Hogan, 2008; Solberg et al., 2012). This analysis did not demonstrate a significant relationship between participation in NTLS2 identified vocation-related coursework and employment-related outcomes by the end of the study period.
Before interpreting the meaning of the above findings in relation to the broader NLTS2 literature, it is important to consider the context of analytical approach. The majority of published secondary data analyses using the NLTS2 rely on regression analysis to look at significant factors associated with transition outcomes, such as academic and vocational programs and experiences, social competence, parent expectations, and academic performance (Bouck, 2012; Carter et al., 2012; Cawthon, Caemmerer, et al., 2015; Chiang, Cheung, Hickson, Xiang, & Tsai, 2012; Coyle, 2012). Although covariates do help to filter out effects from factors other than the intervention or program of interest, regression analyses are limited in their capacity to mimic a randomized control trial because they are heavily dependent on the way that they are specified, and analysts have the capability to respecify the model to obtain significant results. In contrast, propensity score matching, the method used in the current analysis, depends less on how exactly the models are specified (see, for example, Cook, Shadish, & Wong, 2008; Morgan & Winship, 2007) than for regression analyses. Propensity score matching is thus more conservative than regression analysis. This difference in analytical approach, as well as our inclusion of several covariates in our analysis, resulted in reduced variability left to explain effects of our study variables and may help to explain our noneffects.
What does it mean to have a nonsignificant effect in this kind of analysis? The remainder of this discussion will address potential limitations related to the dataset and the interventions studied, what it means to look at these variables for deaf individuals, and the relationship between these interventions and other factors that play an important role in opportunities for deaf students.
Variable Definitions
As with all secondary data analyses, there are limitations related to variable selection and construct identification that go beyond the limitations related to self-report often found in survey data collection. More specifically, although the NLTS2 design captured many important variables related to transition for students with disabilities, it was necessarily designed to capture data for a relatively broad swath of students with disabilities. Although the dependent variables in this study are items that can be relatively reliably measured (e.g., salary or employment status), vocation-related courses have a great deal of variability in how they are defined and what is included in their implementation. There is no set curriculum, for example, on what skills or opportunities students need to have when they participate in specific occupational courses or work-study course sequences. Thus, there is wide variation from setting to setting and even from class to class, how the instructor conceptualizes the work, what opportunities are available in the work setting, and how the student engages in the content. Without course syllabi and specific examples of class objectives or work contexts, as well as information about the quality of how these experiences are integrated into other components of transition for deaf students, it is difficult for a secondary analysis to meaningfully assess noneffects of these treatments on employment outcomes.
Moreover, this analysis was unable to obtain appropriate balance on another potential covariate, namely, whether or not the participants attended a general education school or a special education school. We made an attempt to include this covariate in the analysis, and, even after adding several interaction and squared terms, we were unable to specify a propensity score model which, after matching, would obtain adequate balance on this binary variable. State sponsored special schools, including schools for the deaf, were oversampled in the NLTS2 data collection (Shaver et al., 2014), which may be corrected by using survey weights. As such, we have attempted to use survey weights wherever possible in this research.
Outcomes for Deaf Individuals
Even with potential limitations in construct and population definition, the NTLS2 has been utilized by other researchers who have found a positive relationship between transition planning activities and outcomes for students with disabilities (Carter et al., 2012; Chiang et al., 2012; Grigal, Hart, & Migliore, 2011). Why might there be different results in this analysis of interventions for deaf students than for students with other disabilities (or for an analysis of students with disabilities as a whole)? One of the great challenges in this area of research is the inability to randomly assign students to different interventions, and thus the need to use other analytic strategies to control for the inherent differences between students who obtain services and those who do not. By definition, a student receives transition services because there is a perceived need for support beyond what is available to all students. If we can assume there is an appropriate match of services to student needs, such that those who receive services stand to benefit from them and those who do not are reasonably expected to succeed without them, then a nonsignificant result between students who do and do not receive services may be an indication that the intervention is successful in raising outcomes of students who need the intervention to the level of those who do not.
However, a nonsignificant result could also be an indication that there is something different about how deaf individuals experience these interventions compared with other students. It is possible, though not testable using these data, that some of the courses may be limited in their efficacy with deaf individuals. It may be that the vocation-related opportunities are not as fully accessible as they could be, or students need more foundational training before taking vocation-related coursework (Qi & Mitchell, 2012), limiting the amount of information or employment-related skills that students who are deaf receive from those experiences. For work-study opportunities, in particular, it may be that emphasis is solely on entry-level skills, even when students work in those settings for more than a year (which a third of deaf students in special education schools reported doing). That additional time may not be used effectively as an opportunity to develop high-level skills, mitigating the potential long-term impact of a more intensive work-study experience in high school. Finally, it may be that despite training and support provided at the high school level, that employment outcomes for deaf individuals are less about education and training they receive in high school and more about what happens after they leave school and enter the workforce (Kelly, 2013; Winn, 2007). This would be consistent with findings that postsecondary enrollment for deaf individuals is among the highest across all disability groups, and thus experiences in those training environments may have more of an impact than high school and transition services. These findings certainly place vocation-related course taking, even at the intensive levels measured in this study, as one part of what is necessarily a multifaceted approach to career and vocational education. The onus here is thus not only on the individual and the school system to provide training and support skill development but also on the need for larger systemic changes in the accessibility, both physically and psychologically, of the workplace environment.
Limitations and Considerations for Future Research
The purpose of the current study was to describe the types of vocation-related course-taking deaf students enroll in and to understand the potential impact of service use on long-term employment outcomes. Transition services, however, have broader goals than simply supporting individuals as they seek to start a career. Transition planning includes elements such as independent living and meaningful engagement in social environments (Kohler, DeStefano, Wermuth, Grayson, & McGinty, 1994; Sitlington, 1996). This embedded scope is represented in classic definition of transition put forward by Halpern (1994):
Transition refers to a change in status from behaving primarily as a student to assuming emergent adult roles in the community. These roles include employment, participating in post-secondary education, maintaining a home, becoming appropriately involved in the community, and experiencing satisfactory personal and social relationships. (p. 116)
Although these personal and social outcomes are often related to successful employment and gainful careers, isolating work-related variables from the broader context of transition may limit the interpretability of the findings in our current analysis. Our focus on employment outcomes in this study is thus perhaps too distant from the measurable effects of transition programming; identifying mediating variables and experiences, particularly those that are relevant to the linguistic, cultural, and social context of individuals who are deaf, is an important area for future research. For instance, other literature in the field suggests that self-determination and autonomy may make an important contribution to employment outcomes (Martorell, Gutierrez-Recacha, Pereda, & Ayuso-Mateos, 2008; Shogren et al., 2015).
Second, evidence-based transition planning focuses on several key components, including parent involvement, inter-agency collaboration, direct services, and student development (Kohler et al., 1994). In the latter domain, both academic skills and “soft skills” (such as self-determination and social skills) are needed to successfully navigate workplace environments. Some of these soft skill prerequisites are captured by the variables in Waves 1 and 2 of NLTS2 and served as important covariates in the current analysis. Yet the NLTS2 design does not track the development of these soft skills through the transition process. In future study designs, it might be useful to look at development of individual factors typically used as predictors of transition outcomes, and see how these factors develop throughout the transition process. Achieving this goal would require data collection in multiple waves (beyond Waves 1 and 2). With most study participants no longer in a school setting, collecting data via direct administration of measures would prove to be a challenge. However, we cannot assume these skills are static and unaffected by transition services, especially when many of those classes or developmental experiences are designed to directly address those areas. Future models of the impact of transition programming would benefit from the inclusion of student development variables at multiple time points in addition to behavioral benchmarks such as enrolling in postsecondary training or obtaining sustainable employment.
Also, because certain models were overfit, it is possible that the variance of the treatment effect was overestimated. Certain literature suggests that when propensity score models are overfit, the variance of the treatment effect may be overestimated (Lechner & Smith, 2002). This would lead to the statistical tests failing to reject the null hypothesis, even when the null hypothesis is untrue. Possibly the nonsignificant results shown here are a result of this technicality. However, more recent work suggests that the treatment effect itself is well-estimated even when the propensity score itself is misspecified, given that balance exists in the matched dataset (Zhao, 2008). Half of the estimated treatment effects are actually negative, further suggesting null findings.
Third, there were a number of decisions made in the variable selection process that may limit the generalizability of our findings to students in different educational contexts. More specifically, we used the school type designation that was provided during the first wave of data collection rather than to consider possible shifts in school type contexts that students enrolled in across the multiple waves of data collection. Because we did not delete students who may have experienced both general education and special school settings, our designations do not allow for that complexity in enrollment across waves and resultant impact on study outcomes. We also did not exclude individuals who may have still been in a postsecondary setting during the final wave of the study from our analysis. These individuals would have had fewer opportunities, perhaps, to attain employment goals, at least within the timeframe of the data collection process. The current analysis is not able to delineate longer term impact of vocational course taking for individuals who were either in school or in combined work-school environments in the last wave of the study.
Finally, as in all studies of this type, we were unable to account for unobserved factors that may have an effect on measured outcomes. The propensity score approach adjusts for observed covariates, but does not balance on unobserved factors. In this study, we were limited to the variables available in the NLTS2 dataset, and thus there may be some unobserved confounds. For instance, the NLTS2 dataset did not capture individuals’ occupational aspirations beyond the expectation to “have a job,” and these aspirations about the type of employment that they hope to pursue are significantly related to future employment attainments (Schoon & Parsons, 2002). Some other potential confounds that we did not include in this study, and have emerged in other work as predictors of employment, include family background characteristics such as type of job held by the parent, whether parent receives governmental benefits, and the child’s household living conditions (ratio of people and rooms in the house, ownership of household; Schoon & Parsons, 2002). These findings must be viewed with caution and in the context of both the observed and unobserved factors included in the analysis.
Conclusion
Longitudinal data provide the field with opportunities to understand how experiences in secondary grades shape the transition of students with disabilities as they move into postschool environments. Because of the structure in place under IDEA, schools potentially play a pivotal role in the resources, training, and skill development students can access to support their transition process. The extent to which this programming is designed to effectively serve the needs of heterogeneous populations remains to be seen. Deaf individuals have had a long history of underemployment and societal challenges navigating what can be an inaccessible workplace environment. The results of the current analysis raise further questions as to what factors mediate the effects of vocation-related course work on long-term employment-related outcomes. Elements unique to the deaf community and not measured within a broad study of students with disabilities, including the development of cultural capital, social networks, and specific strategies for navigating a predominantly hearing environment, may be a hidden yet significant part of successful transition for deaf individuals.
Footnotes
Authors’ Note
The statements in this manuscript do not reflect the opinions of the U.S. Department of Education and should not be taken as an endorsement of any products or services.
Declaration of Conflicting Interests
The author(s) declared no potential conflicts of interest with respect to the research, authorship, and/or publication of this article.
Funding
The author(s) disclosed receipt of the following financial support for the research, authorship, and/or publication of this article: Portions of this manuscript were supported by pepnet 2. Pepnet 2 is funded by the Research to Practice Division, Office of Special Education Programs, U.S. Department of Education via Coorperative Agreement H326D110003. Funding is provided from October 1, 2011, to September 30, 2016.