
Abstract
The present investigation examines the schoolwide applications model (SAM) as a potentially effective school reform model for increasing equity-based inclusive education practices while enhancing student reading and math achievement for all students. A 3-year quasi-experimental comparison group analysis using latent growth modeling (LGM) was used with seven urban elementary or elementary/middle schools and seven matched comparison schools in the same district. Results suggest significantly larger growth for experimental school students in math and no statistically significant difference in reading score growth between experimental and comparison schools. However, reading score growth for experimental schools was statistically significant in a post hoc analysis of selected schools. Additional descriptive analysis is presented for three schools that implemented the model with the highest measured fidelity; these schools made improvements on both reading and math scores while those of matching comparison schools decreased.
Keywords
Although Individuals With Disabilities Education Act (IDEA) policies reflect movement toward inclusive education, in practice, many schools are reluctant to move all students, particularly those with the most extensive support needs, into general education classrooms (McLeskey, Landers, Williamson, & Hoppey, 2012; O’Rourke, 2015; Ryndak, Jackson, & White, 2013). Practitioners find inclusive education models to be challenging for several reasons. The primary argument against inclusion reflects a philosophy of protectiveness and shelter for students with disabilities and stresses the need for concentrating specialized supports in a single location (Kauffman, 2004). A secondary argument expresses concern about directing educational resources and instructional time primarily toward students with disabilities, thereby reducing the quality of instruction provided to students without disabilities (Kauffman, Landrum, Mock, Sayeski, & Sayeski, 2005).
A substantial body of research on inclusive educational practices does not support these common critiques. Reviews of the literature comparing segregated and inclusive educational arrangements on indicators of student achievement generally favor inclusive education for both students with and without disabilities (Cole, Waldron, & Majd, 2004; Cosier, Causton-Theoharis, & Theoharis, 2013; Jackson, Ryndak, & Wehmeyer, 2010; Kurth & Mastergeorge, 2010; McLeskey, Waldron, & Redd, 2014; Rea, McLaughlin, & Walther-Thomas, 2002; Ruijs, Van der Veen, & Peetsma, 2010; Sailor, Wolf, Choi, & Roger, 2009; Sermier Dessemontet & Bless, 2013).
In spite of these reported successes, The sticking points to inclusion still appear to be: Who takes responsibility for the students who struggle academically and socially?; the labeling of “included” students; the reorganization of classrooms to include all students; the types of curricular approaches that are most effective for those with additional needs; and the role of special educators. (O’Rourke, 2015, p. 537)
In answer to these concerns, O’Rourke (2015) pointed to an equity-based model, the schoolwide applications model (SAM 1 ; Sailor & Roger, 2005) “that is flexible, cohesive, and responsive,” requires “a new way of viewing the education of students with disability, and indeed all students,” and would “herald a change in regular schools from inflexible programs that have often denied students with additional needs success” (p. 541). A few other contemporary models support this broader definition of inclusion focused on equity for all students, including those reported by Booth and Ainscow (2011), Kozleski and Artiles (2012), and Waldron and McLeskey (2010).
SAM
SAM is unique from traditional inclusive models in at least three ways. First, SAM was conceived as an equity-based approach to providing inclusive education (Sailor & Roger, 2005). Equity-based inclusive educational environments offer an alternative to placement-based definitions of inclusion and work to increase academic achievement for all students while providing students with disabilities access to general education classrooms and integrated environments and curriculum through deployment of a multi-tiered system of support and embedded response to intervention (MTSS/RTI). Yet, equity-based inclusive education does not mean teaching all students the same way but instead relies on instructional modifications, differentiation, and supplemental supports and services that allow full membership of all students in grade-level classrooms and participation in all general education curriculum activities.
Second, SAM is focused on increasing academic achievement by fully integrating fragmented educational resources, supports, and services for the benefit of all students, not solely those receiving special education services. Schools implementing SAM subscribe to a collaborative, data-driven, standards-based educational program providing all students with the learning support they need to be successful in general education, regardless of disability classification or severity of need. SAM authors theorized, and evidence suggests, that when certain transformational processes take place in a school during a 3- to 5-year period, academic achievement scores rise for all students (Meisenheimer, Hinman, Darnold, & Margo, 2014; Sailor & Roger, 2005; Sailor et al., 2006).
Finally, SAM incorporates district-level structural features to support school-level implementation. Other models implement inclusive practice within a school, but lack a broader system support (Booth & Ainscow, 2011; McLeskey et al., 2014). Research suggests when a district is the point of intervention, schoolwide transformation and improved student outcomes become sustainable after incremental technical assistance (TA) resources are gone (State Implementation & Scaling-Up of Evidence-Based Practices Center [SISEP], 2014). Schools implementing SAM receive district support to promote sustainability and scale-up of inclusive practices. Districts collaborate with schools to provide training and TA to school-level educators, allocate resources to support transformation, and respond to policy barriers that inhibit inclusion.
SAM Guiding Principles
To help schools create an equity-based culture that enhances academic achievement for all students and is supported by districts, SAM authors articulated six guiding principles of implementation, each with a body of supporting evidence. These principles are (a) general education guides all instruction, (b) all school resources are configured to benefit all students, (c) schools proactively address social development and behavior, (d) schools are organizationally data-driven, problem-solving systems, (e) schools have open boundaries in relation to their families and communities, and (f) schools enjoy district support for undertaking extensive systems change.
General Education Guides All Instruction
SAM’s general education principle is fundamental to an equity-based inclusive education. In SAM schools, “all students with Individualized Education Programs (IEPs) are members of age-appropriate, grade-level classrooms, and they attend all non-classroom functions with their classmates” (Sailor & Roger, 2005, p. 507). Grade-level general education teachers are primarily responsible for all students, regardless of any student’s specialized support needs. Specialists (e.g., speech language pathologists, occupational therapists) work in cooperation with general and special educators to provide intervention and support to any student who can benefit. Small group and individualized instruction are available to support the general education curriculum and are offered to any student. Students are not referred for placement in special schools or segregated in specialized classrooms unless a strong parental preference is expressed.
Resource Configuration
The goal of this guiding principle is to reorganize school resources so that all students receive the services and supports they need to be successful. An obstacle to this goal is a traditional “siloization” of educational departments, creating division of school funding, resources, and services among various classification groups (Artiles, Kozleski, Dorn, & Christensen, 2006; Fuchs, Fuchs, & Stecker, 2010; Sailor et al., 2009). Research suggests that educational improvements accrue from combining all school resources, including special education, Title I, and English learning, for the benefit of all students (Sailor et al., 2009).
Social/Behavioral Development
SAM schools were assisted to incorporate research-based, effective practices to improve outcomes for students who struggle to learn. The schools used a comprehensive behavior support intervention, School-Wide Positive Behavior Interventions and Support (SWPBIS). SWPBIS was originally developed to instruct students in special education who have behavioral disabilities (Carr et al., 2002), and later extended to meet the social/developmental needs of all students (Sailor et al., 2009). Research suggests that SWPBIS reduces the rate of office disciplinary referrals and can increase academic test scores of all students (Bradshaw, Mitchell, & Leaf, 2010; Horner et al., 2009).
Data-Driven Problem Solving
SAM emphasized simultaneous top-down and bottom-up support by connecting district staff, school leaders (e.g., principal and leadership team), and educators in reform activities in a team-based problem-solving system. In such a system, various student data are collected and analyzed, which enables teaching staff to make decisions about their own school reform priorities and activities. All school personnel participate in teaching and learning for all students. Categorical services and supports (e.g., special education, Title I, English learning) are considered to be temporary resources in a fully integrated system of supports and services designed to provide an instructional match for individual students needs. This approach is all educators and staff sharing their resources and talents to instruct all students regardless of a student’s presenting problem (i.e., traditional categories).
Family engagement through partnerships
The goal of this SAM principle is to go beyond traditional parent/teacher organizations to actively engage families in formal partnerships with school personnel. Researchers recommend actively involving families in student learning to increase student achievement (Ingram, Wolfe, & Lieberman, 2007; Jeynes, 2005; Sheldon, 2003) and promote sustainable school reform (Bryk, Sebring, Allensworth, Luppescu, & Easton, 2010; Payne, 2008). Research also suggests that trust built between families and school personnel positively influences student outcomes (Tschannen-Moran & Hoy, 2000). SAM schools foster trust by facilitating open boundaries with their families and empowering parents to actively participate as members of school teams and other planning and instructional processes.
District-Level Support
Finally, district-level structural features are essential to aid in full implementation with fidelity and sustainability of SAM reform efforts. Schoolwide transformation and improved student outcomes have been shown to sustain over time with district support (Boyd, Kerchner, & Blyth, 2008; Copland, 2003; Payne, 2008; SISEP, 2014). Districts play a key role in creating a vision for change, providing relevant professional development, updating policy to support reform efforts, and providing enough time for reform efforts to develop (Payne, 2008; Sailor, 2009). This guiding principle notes the importance of garnering district-level support prior to initiating change at the school level. District teams that manage resource allocation and examine and adjust policies are vital to the success of SAM implementation.
Purpose
The purpose of this study was to extend and strengthen the evidence for schoolwide inclusive school reform models, of which SAM was one. To do so, we not only evaluated student achievement growth in SAM schools but also evaluated growth in relation to a matched control group of non-implementing schools in the same district from 2009 through 2012. Our overarching hypothesis was as follows:
The measurement for reading and math, the annual grade-level standardized assessment, included all subgroup students who took the tests. A 3-year quasi-experimental comparison group analysis using latent growth modeling (LGM) was used to test this hypothesis. In addition, a post hoc descriptive analysis of student achievement in the schools that fully implemented the model with the highest fidelity is provided.
Method
Participants
Setting/location
This study is a longitudinal investigation of a single schoolwide inclusive school reform model implemented in multiple schools located in a low-income, large inner-city area, that is, the District of Columbia Public Schools (DCPS, 2012). Seven elementary or elementary/middle schools participated as implementation sites and seven schools as comparison (i.e., control) sites. Failure to meet national academic proficiency standards contributed to DCPS’s decision to implement inclusive school reform. As of 2010, 75% of DCPS schools failed to meet annual adequate yearly progress targets for at least 2 consecutive years and were in federally mandated school improvement status (District of Columbia Office of the Chancellor, 2010).
Sampling procedures
To choose implementation sites, DCPS officials sent a letter to all their elementary principals to identify those with interest in implementing a school reform. Several volunteered, and district officials initially chose eight schools to implement the model. One school was selected because of its direct involvement in a legal dispute involving persistent segregation of students receiving special education services. The other seven were chosen because they were among the lowest performing schools in the district. Ultimately, one school opted to defer its participation until the next year, leaving seven implementation sites for this study cohort.
We purposively selected comparison schools to match each of the district-selected implementation school’s size (total students enrolled) and student demographics (percent of students in each ethnic background, status of socio economically disadvantaged, special education service, and English language instruction; see Table 1). Implementation and comparison groups each had five schools serving pre-K to fifth-grade students and two schools serving pre-K to eighth-grade students. More than 85% of curriculum and instructional materials in both groups were aligned to each other and with the district core standard. Comparison group schools were not exposed to SAM TA materials and activities such as professional development, on-site meetings, or consultations.
Demographics for SAM Implementation and Comparison Schools.
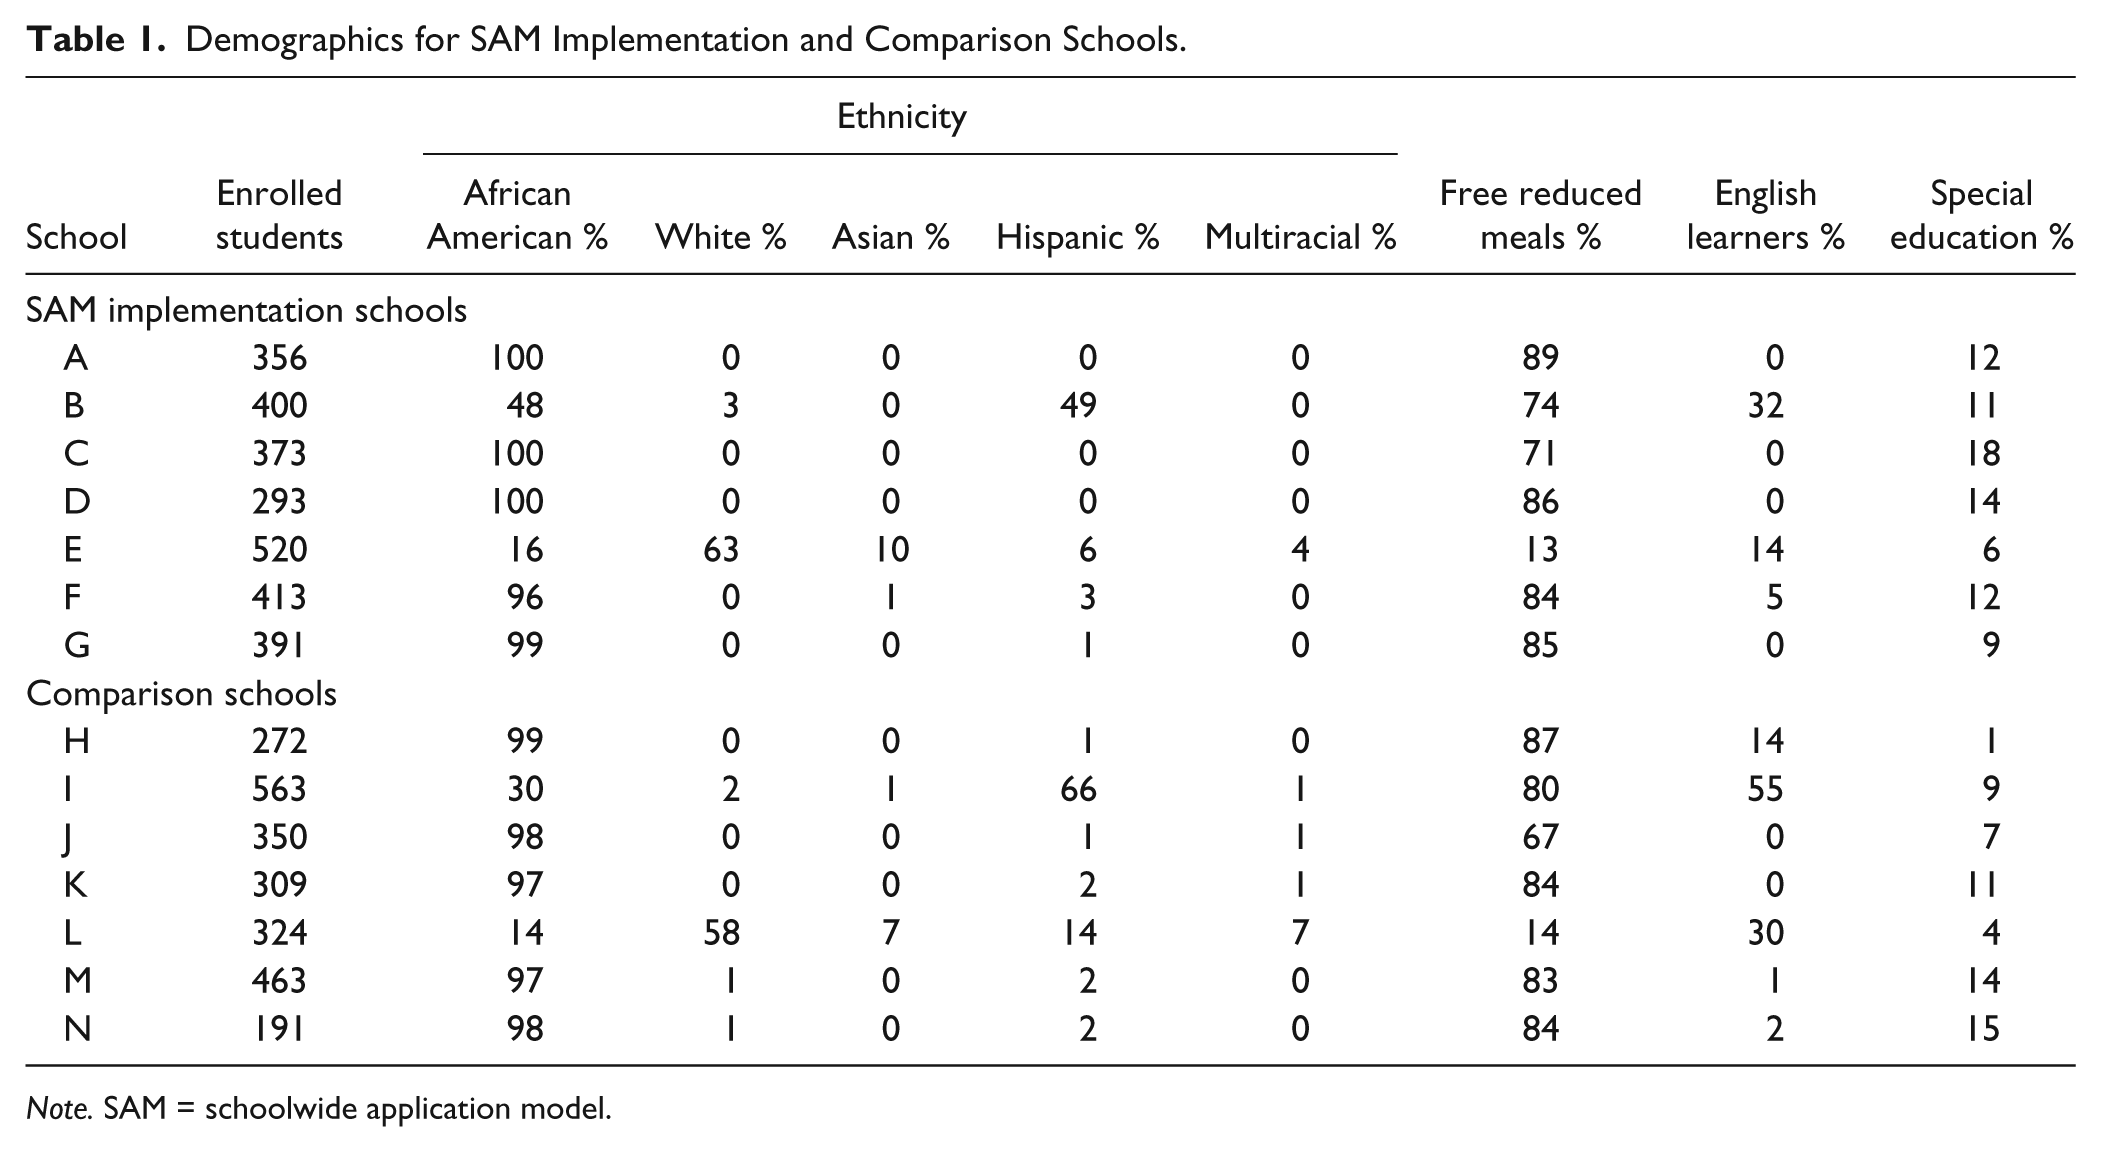
Note. SAM = schoolwide application model.
Outcome Measures
We obtained institutional review board (IRB) approval from our university and informed consent from DCPS for use of data describing schoolwide and subgroup student academic performance in all 14 schools. We used the SAM Analysis System (SAMAN) as a measure of fidelity of implementation for interpreting results.
Measures of academic performance
Secondary data obtained from DCPS’s annual grade-level standardized test data on reading and math represented academic performance. Students from third to eighth grade completed these assessments for reading and math during each year. The total sample included most students in the special education subgroup; and all but about 1% of students with IEPs took the DCPS standard assessment. The DCPS assessment system, District of Columbia Comprehensive Assessment System (DC-CAS), met established technical adequacy standards according to published reports. Across grade and content area assessments, reliabilities for the assessment average .92 for the stratified alpha. Average stratified alpha for reading assessments was .93 and was .93 for math (District of Columbia Office of the State Superintendent of Education, 2011). Reliability coefficients greater than or equal to .8 were considered acceptable.
SAMAN
Trained assessors collected primary data to examine the fidelity of model implementation using SAMAN (Sailor & Roger, 2008). SAMAN assesses installation and implementation of critical features (CFs) of SAM within a school across time. The instrument contains a Likert-type scaled set of 15 items (i.e., CFs) developed from the previously described SAM guiding principles. Each of the 15 CFs is evaluated using a scale from 0 to 3, where 0 reflects essentially no manifestation of the feature at the school and 3 represents full implementation (Sailor et al., 2006).
SAMAN is designed to be administered twice a year. Here, baseline administration occurred a month after a school-centered planning (SCP) session, and subsequent administrations followed at about 6-month intervals (Sailor & Roger, 2008). SAMAN assessors were independent contractors, trained by the researchers, but with no stake in the outcomes of the assessments. Preliminary psychometric evaluation of this tool reported an 80% average interrater agreement between any two independent assessors from a total of six sets of observations. For internal consistency, a Cronbach’s alpha for all 15 items was .95, which indicated that overall internal consistency of SAMAN was strong and exceeded the general cutoff for research purposes (Henson, 2001). Cronbach’s alphas of each subscale ranged from .80 to .91, which were also above the research purpose alpha level. Analyses revealed a strong correlation between each item and corresponding subscale. The rss score range was from .81 to .95 indicating strong correlation for internal consistency. Correlations between each item and overall total score (rtot) were also above the recommended correlation level for research purposes (Nunnally, 1975). Convergent validity could not be studied because no similar tool was available; however, SAMAN Item 7 scores (i.e., active, schoolwide positive behavior support program) were compared with Schoolwide Evaluation Tool (SET; Sugai, Lewis-Palmer, Todd, & Horner, 2001) scores to provide evidence that scores from the two measures were closely related. Pearson correlation analysis showed significant positive relationship between SET and SAMAN Item 7, M = 1.58, SD = 0.86, N = 53, r(51) = .78, p < .01, (Choi, 2007). Overall, preliminary technical adequacy evidence suggests that SAMAN was a valid and reliable assessment to measure SAM fidelity of implementation.
Administration of SAMAN involves gathering information from multiple sources, including a review of document products, observations, and staff interviews, to assess the current status of implementation of the model. SAMAN assessors spent an entire day in each school for each assessment; conducting interviews with administrators, site leadership team members, teachers, staff members, families, community representatives, and SAM district coordinators; and reviewing documents such as school meeting minutes, policies, training, and class schedules (Sailor & Roger, 2008). Because the SAMAN instrument was designed to be used to measure the fidelity of SAM implementation, it was administered only in the implementation schools.
Intervention Procedures
SAM implementation occurred in five stages over 3 years. The first stage was an introduction to SAM, which was initiated through the district and included principals from each school. Activities focused on potential challenges of supporting students with more extensive needs in the general education curriculum. The second stage was baseline administration of SAMAN and discussions with school leaders about their schools’ scores. The third stage, in which a site leadership team consisting of representatives of school personnel (e.g., representatives of grade-level teams, behavior support team, MTSS team, and so on), family members, and community representatives was established in each school. The teams set up a reform process called SCP, wherein schools engage in collaborative problem solving and host occasional events for community participation. Teams set timelines for implementation of the SAM with a focus on success as determined by a significant change in SAMAN scores. The expectation was that schools would begin to show improvement by the end of Year 3 if the CFs were implemented. Stage 4 was principals and teacher leaders discussing how resources within the school might be used differently to support students. Alternative use of general and special educators to support the needs of students was key to this discussion. Stage 5 included extensive professional development for each school and the associated professional learning communities within each school. SAM professional development began with a focus on MTSS (schoolwide) with RTI (special education identification), including SWPBIS.
Year 2 professional development activities stressed academics with attention to understanding the need for flexible grouping of students based on available data and differentiating instruction for each group while using the existing curriculum. Trained instructional coaches also enhanced DCPS’s capacity to use their academic curriculum more effectively. The training used a basic coaching framework, including classroom management, content, instruction, and formative assessment for learning (Knight, 2007). Professional learning also was provided for collaborative problem-solving approaches involving a school leadership team or educators and coaches using the instructional coaching cycle (i.e., identify, learn, and improve with data). Coaches provided model lessons, observed educator lessons with co-constructed observation forms, discussed results, and explored data with educators to provide proactive supports. In addition to the foundational work of inclusive education, academic MTSS/RTI components were carefully reviewed and refined. Using Dynamic Indicators of Basic Early Literacy Skills as a universal screener and progress monitoring tool, data-based decision systems were refined to create clear entry and exit rules for Tiers 2 and 3 interventions and monitor overall effectiveness of intervention practices with aggregate data as well as individual student’s progress monitoring. Although research-based math screening and progress monitoring tools were not available, DCPS’s benchmark assessment and teacher-created progress monitoring assessments were actively used for decisions about supplemental interventions and supports for math. Each school leadership team was trained and guided to use data, especially aggregate data for a specific subject, grade level or subgroup of students, to monitor overall effectiveness and fidelity of Tiers 2 and 3 interventions and the schoolwide system. These data supported decisions about what, how, and when to provide educators professional development, coaching, and TA to improve specific areas. Thus, a continuous educator support system through the instructional coaching and data-based decision-making systems helped to establish a strong academic MTSS foundation. SAM action plans incorporated the other CFs as well, and progress was monitored with SAMAN fidelity of implementation reviews and student outcome data.
In Year 3, SAM implementation was intensely focused on coaching district personal and school leadership teams to improve instruction and to strengthen family and community partnerships. This focus was evident in professional development within the district and ongoing modifications to resource utilization within the schools. TA activities included 2-day professional learning opportunities every semester on a bi-monthly schedule for coaches and quarterly for school leadership teams. Annual professional learning institutes included coaches, administrators, and teachers; they covered such topics as MTSS/RTI, parent engagement, universal design for learning, and inclusive educational practices. Schools received direct TA on inclusive practices, particularly for students with the most extensive support needs. TA visits occurred quarterly and on an as-needed basis. All TA activities were supported by school SAM coaches, who were, in turn, supported by a district-level SAM coordinator. This coordinator provided weekly training sessions and resources.
Research Design and Data Analysis
We chose a 3-year, quasi-experimental comparison group analysis because of the needs-based, non-random sampling procedure of implementation schools and the purposive selection of matched comparison schools. Reading and math scores were analyzed with LGM using Amos software (Arbuckle, 2006). LGM provided a better method than repeated-measures ANOVA because the unit of analysis was schools with students moving from grade-to-grade and school-to-school through the study period. LGM is a longitudinal growth model using structural equation modeling (SEM) methodology (Duncan, Duncan, & Stryker, 2006), which can assess the rate of outcome changes (i.e., latent slope growth factor). In comparison with traditional statistical approaches, LGM has the ability to evaluate its model fit and selection of criteria (i.e., adequacy of a model), accounts for measurement error by using latent repeated measures, and effectively handles missing data. In the present analysis, LGM was applied to examine the mean outcome change in reading and math during a specific time period (2009–2010 to 2011–2012 school year) and SAM implementation predictability on reading and math scores. Using all available data, we imputed missing data through maximum likelihood estimation. The full information maximum likelihood (FIML) is an effective method to handle missing data, showing more accurate model rejection rates and higher efficiency (Enders & Bandalos, 2001).
Separate LGM analyses were conducted to examine whether growth of reading or math scores in implementation schools were significantly larger than the scores of control group schools (i.e., significant mean slope and significant positive effect of SAM implementation status on reading or math growth). Additional post hoc LGM analysis was planned to investigate the significance of reading and math score growth within implementation schools, regardless of outcomes from the comparison school study.
Full implementation with fidelity criteria
The differences in academic achievement between fully implementing SAM schools and other SAM schools were examined through post hoc descriptive analysis. Full implementation with fidelity is determined by established criteria: a minimum of 2 years of SAMAN assessment and average scores across all 15 features and each individual feature between 2.5 to 3.0. For the present analysis, SAMAN scores of 0 to 3 on each of the 15 features were averaged to produce a total scale score. Schools scoring below 1.5 on SAMAN total scale score fell in what was arbitrarily termed the initiation phase and generally reflected schools beginning to understand the SAM school reforms and how they align with its unique characteristics. SAMAN total scale scores between 1.5 and 2.5 reflected schools in the partial implementation phase of SAM, signifying the acceptance of new structural and instructional ideas and progress toward refining SAM processes through action planning. Schools scoring 2.5 to 3.0 reflected the full implementation of SAM and its guiding principles in the daily operations of the school with sufficient fidelity. Previous research with SAM implementation in a West Coast urban district indicated that a school could be expected to reach this stage with appropriate district support in 3 or 4 years with TA provided by consultants to the district (Sailor et al., 2009).
Results
Fidelity of SAM Implementation
Fidelity of implementation can be a significant factor in evaluation of an intervention’s strength (Hulleman & Cordray, 2009). As such, the indicator of adherence to SAM implementation procedures, that is, SAMAN data, enabled descriptive investigation of effects for those schools that implemented with fidelity. Examination of total mean SAMAN score at baseline and for every subsequent semester showed that all seven SAM schools made consistent progress. Figure 1 depicts each implementation school’s SAMAN total mean score improvement. The average total SAMAN score of implementation schools was 1.8 out of 3 (60%) in 2009–2010 and increased to 2.4 (79%) in 2011–2012. All implementation schools made progress from 2009 to 2010 and the average difference between 2009–2010 and 2011–2012 scores was 0.57 (19%). SAMAN scores increased in all SAM schools across all CFs.

SAMAN total mean score improvements between the baseline (i.e., fall 2009) and spring 2012 in seven SAM implementation schools.
These results, as will be fully discussed later, indicate that SAM implementation improved equity and quality education by
Increasing inclusion of students with special needs in the schools (CF1: M = 1.0, SD = 0.58 to M = 2.71, SD = 0.49)
Providing flexible, non-categorical supports to meet diverse needs of students (CF11: M = 0.86, SD = 0.38 to M = 2.29, SD = 0.76)
Engaging all school personnel in training; valuing their contributions to student academic and social outcomes (CF10: M = 1.57, SD = 0.53 to M = 2.71, SD = 1.14)
In addition to these largest increases were two features that increased by 1.0: full student participation in supported instruction (i.e., peer-mediated instruction, CF9: M = 1.43, SD = 0.53 to M = 2.43, SD = 0.53) and community partnership with service providers and business (CF14: M = 1.71, SD = 0.76 to M = 2.71, SD = 0.49).
Schools’ collaborative team process improvements signaled movement toward a team-driven learning organization with shared leadership and decentralized data-based decision-making processes. Data-driven, collaborative, decision-making, learning organization guided by team processes (CF8) and established site leadership team empowered by the school and the district (CF12) were two of three items on average that exceeded the full implementation status after just a year of implementation.
Table 2 shows rank-ordered average scores after the 3-year implementation. The highest ranked features were school’s acceptance of all students regardless of level of support need (CF1), team process (CF8), whole staff participation in teaching/learning (CF10), and partnership with community business and service providers (CF14). The strong site leadership team empowered by the school and district (CF12) and district supports (CF15) were second-ranked features.
Ranked Average CF Scores: SAM Implementation Schools, Spring 2012.
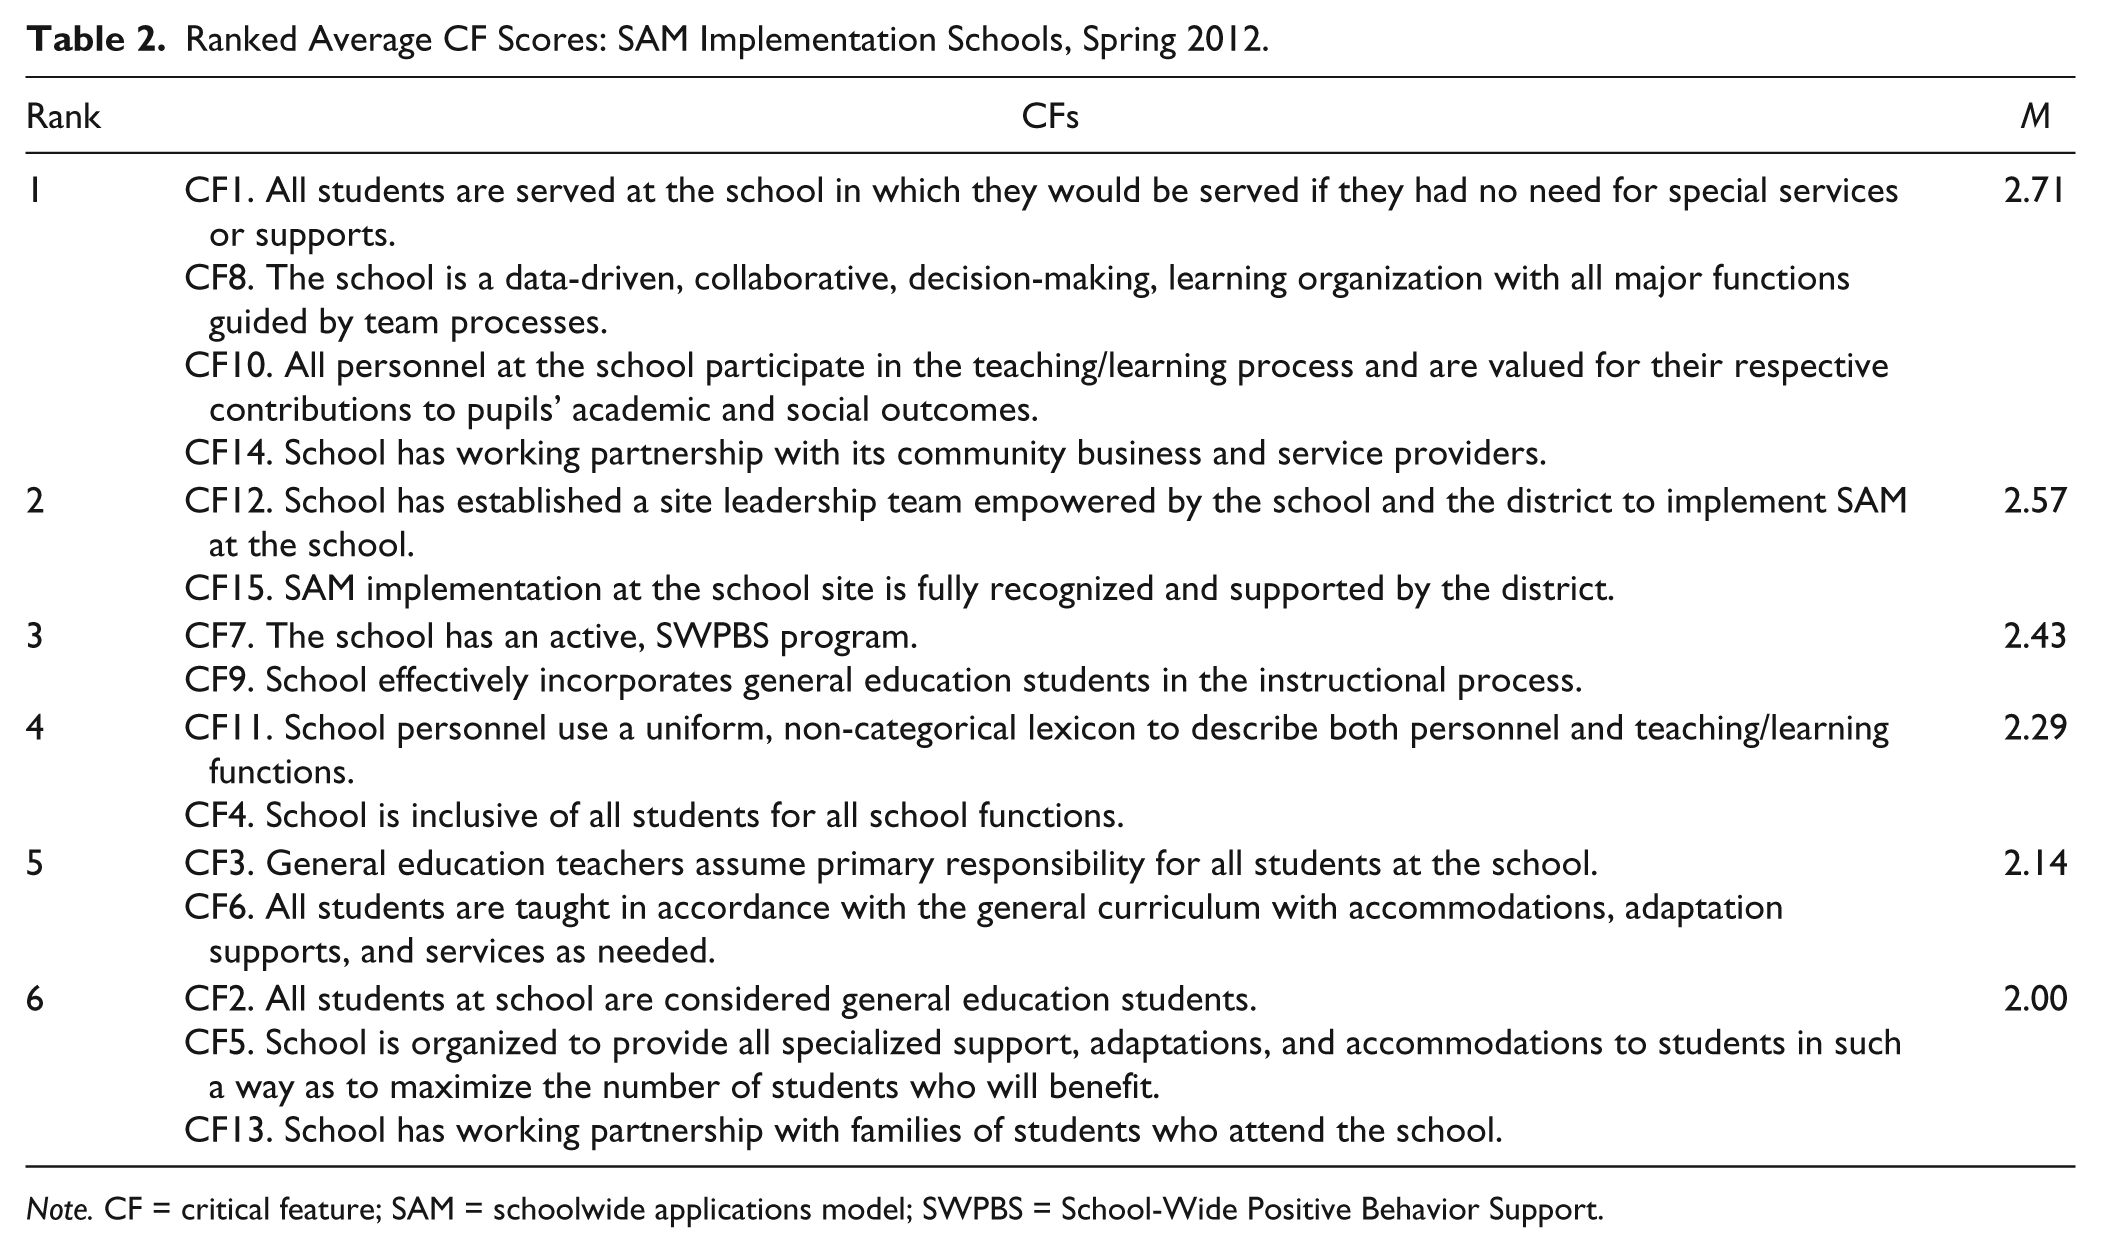
Note. CF = critical feature; SAM = schoolwide applications model; SWPBS = School-Wide Positive Behavior Support.
SAM Efficacy: Student Academic Achievement
To examine the relationship between the math or reading score growth and SAM implementation, we entered as a covariate an implementation condition (i.e., SAM or comparison school) that allowed for testing the effects of the intervention on intercept and slope factors. If SAM implementation can predict higher score changes or slope intercept on math scores, the covariate should significantly affect slope or intercept.
Math
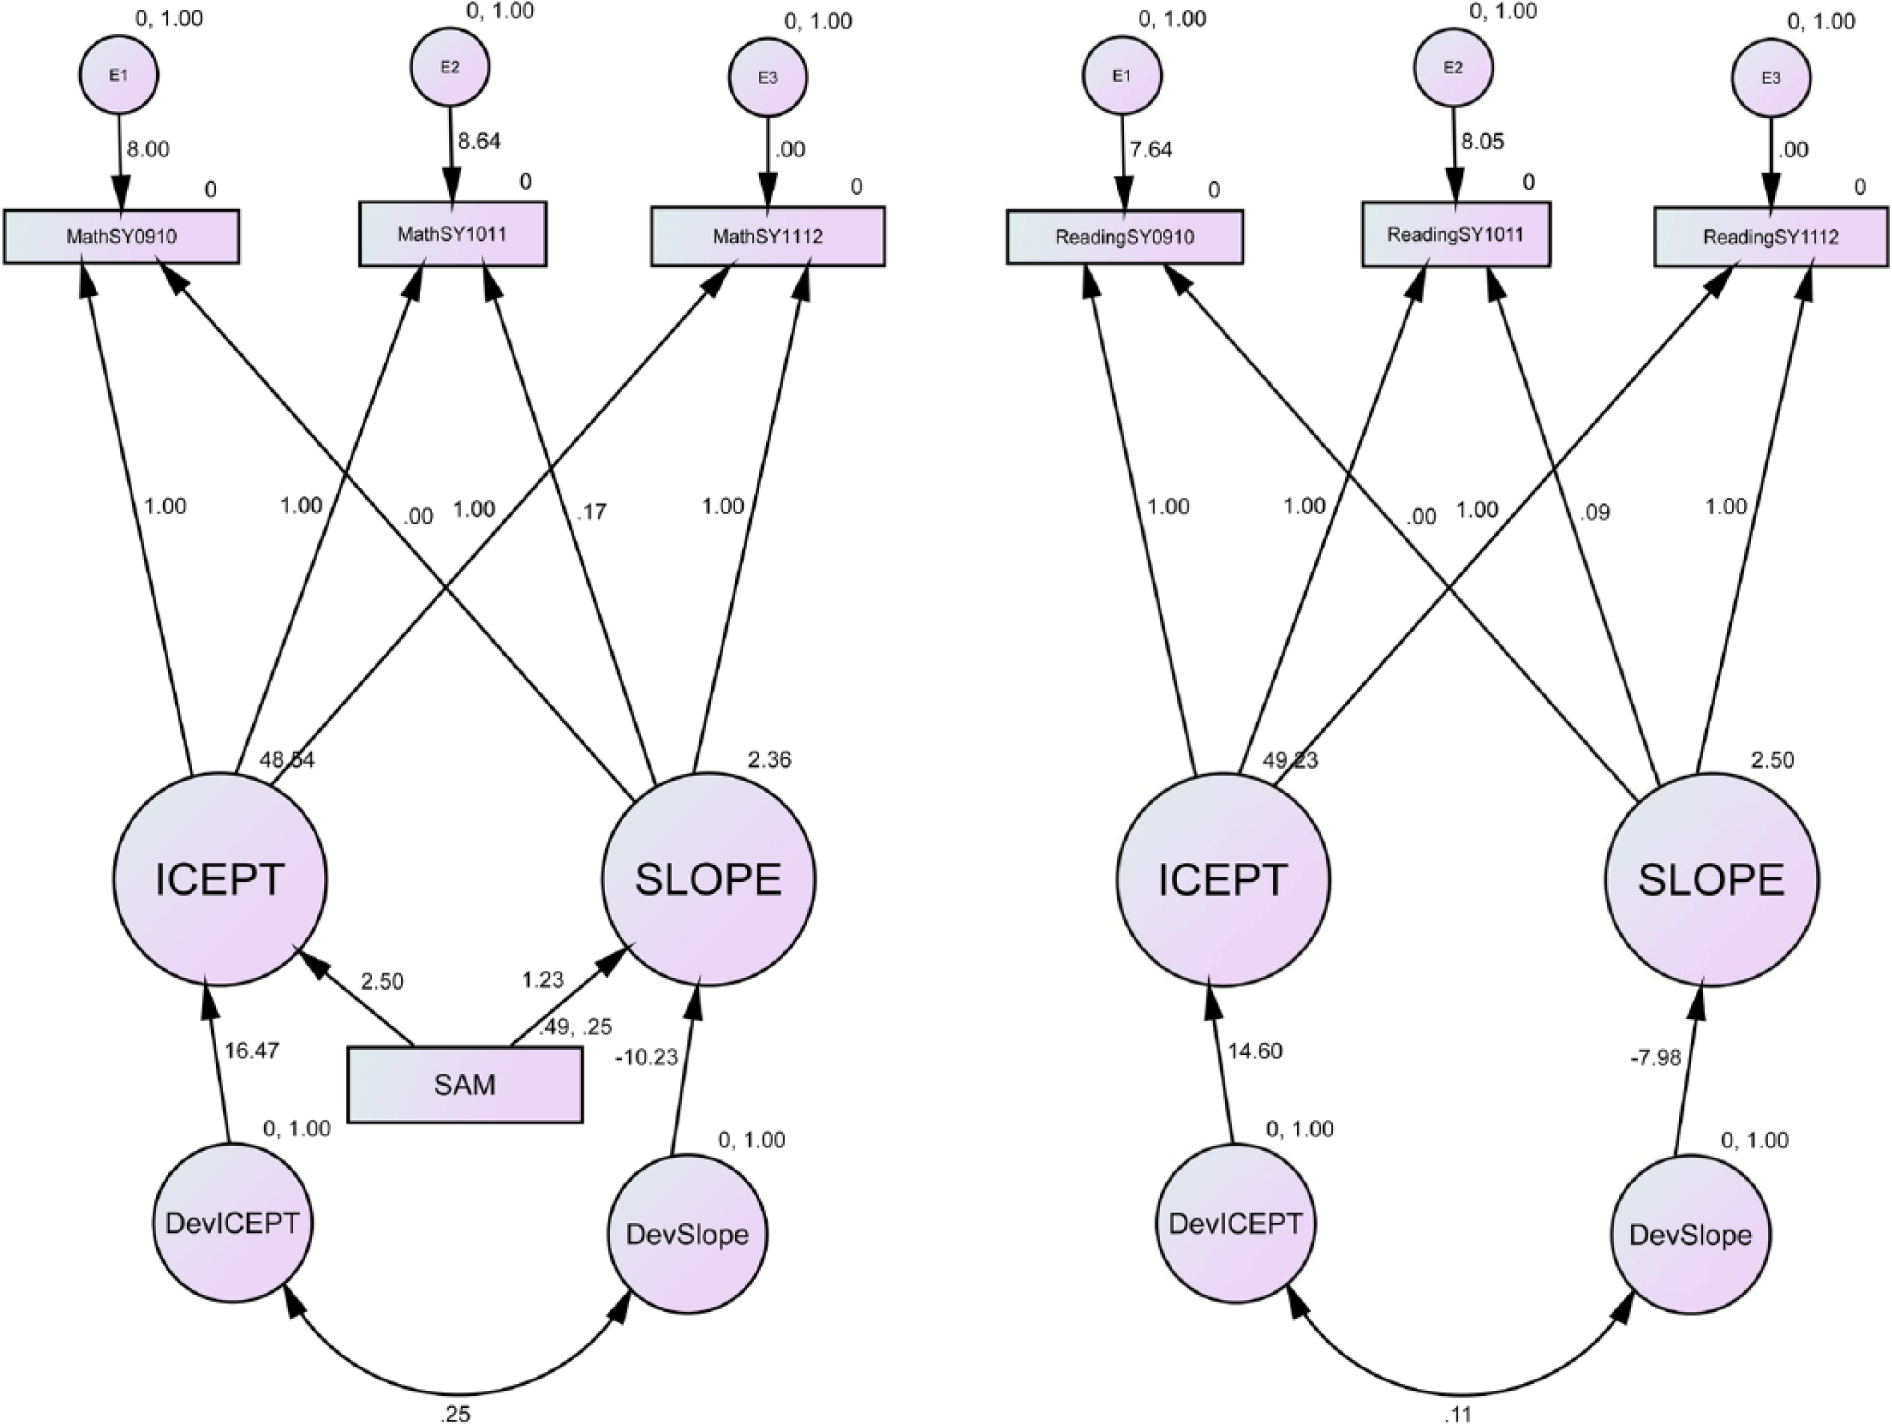
Figure 2 illustrates the LGM analysis results for math with 7,574 students in all 14 schools (i.e., seven SAM implementation schools and seven comparison schools). In the model, observed variables MathSY0910, MathSY1011, and MathSY1112 represent math scores in 2009–2010, 2010–2011, and 2011–2012, respectively. Latent variables ICEPT and SLOPE represent the intercept and slope of score change over 3 years. DevICEPT and DevSlope represent the standard deviation of intercept and slope.
Schematic of latent growth model analysis for the SAM implementation impact on math score (left) and reading score (right).
LGM analysis provided the following model fit indices, CFI (comparative fit index) = .996, RMSEA (root mean squared error of approximation) = .036, and the chi-square test statistic, χ2(1, N = 7,574) = 10.93, p < .01. These results indicate an adequate fit of the model to the data (Browne & Cudeck, 1993). The RMSEA fit index also reflects the power of the LGM analysis, which is the probability that the growth model will be rejected when it is not correct. MacCallum, Browne, and Sugawara (1996) reported a power calculation method with the RMSEA fit index and suggested that values of RMSEA could be involved in choosing null and alternative hypotheses, which would be, respectively, exact fit (ε0 = 0.0) and mediocre fit (ε0 = 0.08). Thus, in the current analysis, the RMSEA has enough power and adequate model fit.
The mean intercept value (Mi) of 48.5 indicated that the average starting score was 48.54 units, Mi = 48.5, t = 112.2, p < .01 (standardized coefficient = 0.43). The model revealed a significant mean slope, Ms = 2.4, t = 5.2, p < .01 (standardized coefficient = 0.45), suggesting a growth model with a steady increase in the math scores from 2009–2010 to 2011–2012. The Ms value of 2.36 can be interpreted as the increase in math per unit of time. The correlation between intercept and slope was .25 and significant, p < .01. This result suggests that higher scores on initial status in math had a greater increase on the slope factor. The intercept variance for math (DevICEPT), Di = 16.5, t = 57.6, p < .01, and the variance of the latent slope scores (DevSlope), Ds = −10.2, t = −4.3, p < .01, indicated substantial variation in individual differences regarding the initial status and trajectories of change in math over time.
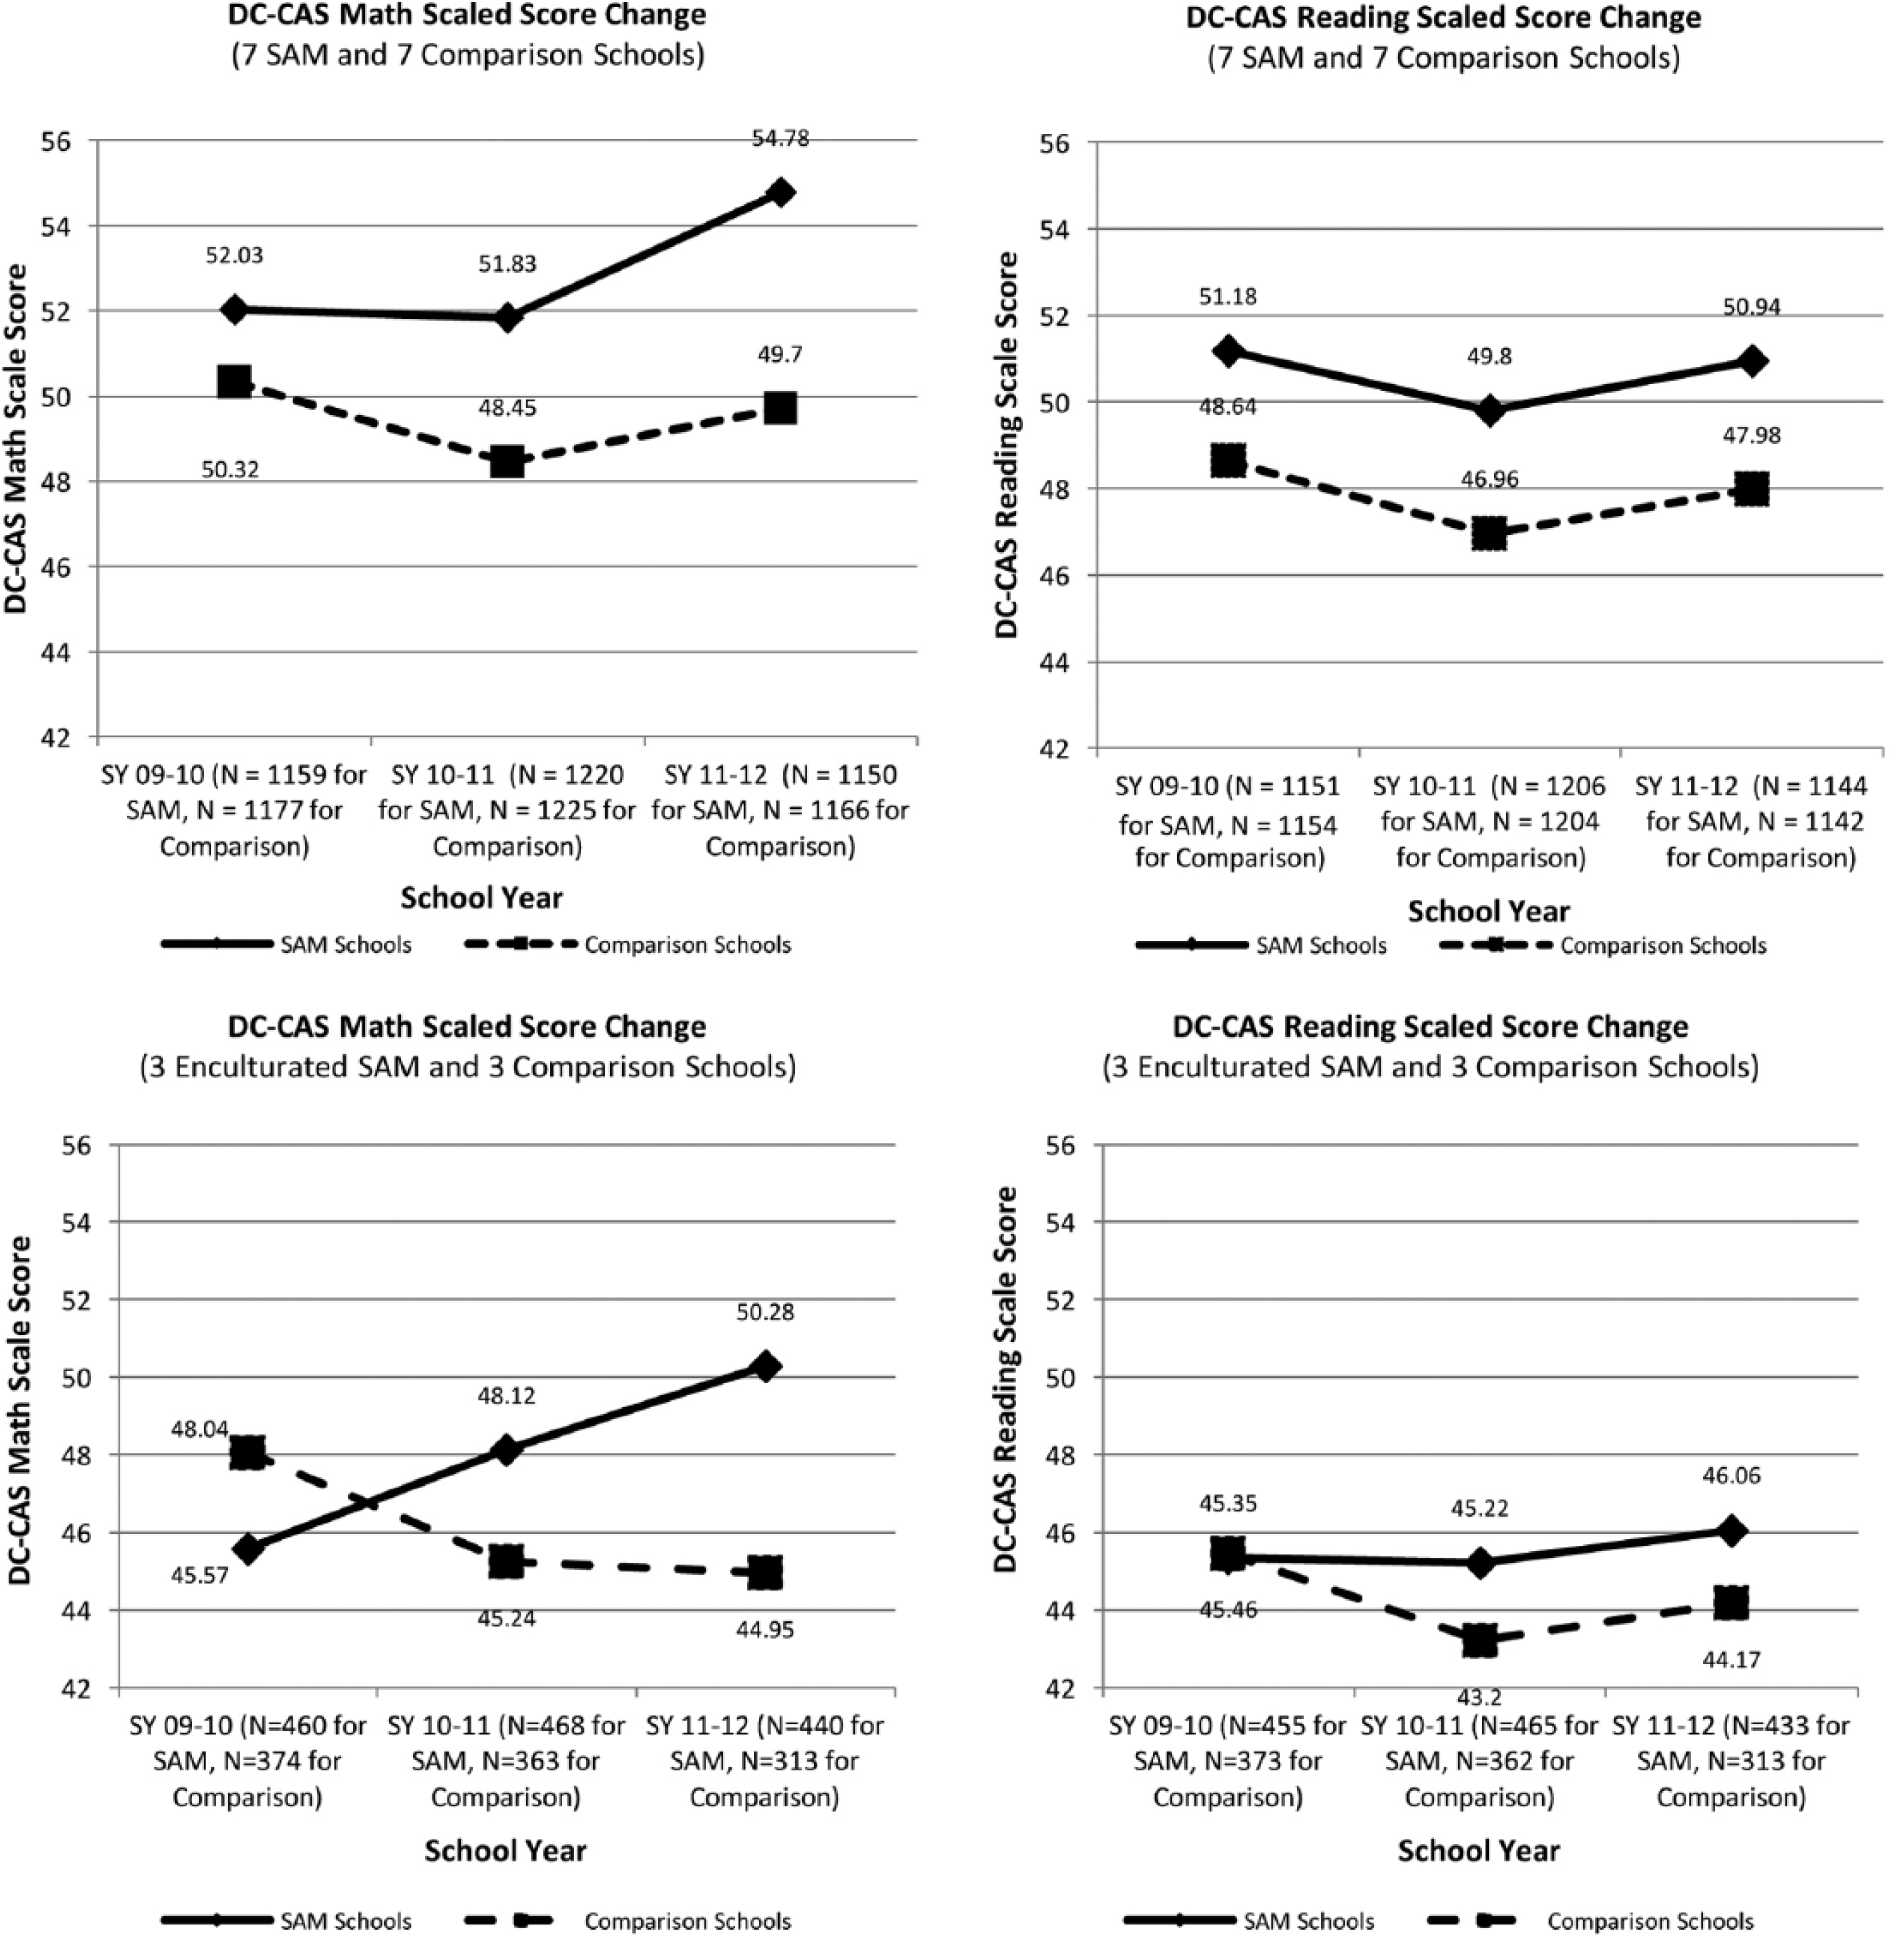
The implementation condition had a significant effect at intercept and slope of math scores. SAM implementation affected slope positively, β = 1.2, t = 1.96, p = .05 (standardized coefficient = 0.63), which means that students in SAM schools made higher math score growth over the 3 years compared with comparison group students. The impact of SAM implementation on intercept was also significant, β = 2.5, t = 4.2, p < .01 (standardized coefficient = 0.60), which may be interpreted to mean that implementation schools had higher initial math scores. Figure 3 shows implementation and comparison schools’ math score changes.
District of Columbia state assessment math and reading score changes for all SAM implementation and comparison schools (above) and three SAM schools with fidelity of implementation and corresponding comparison schools (below).
Reading
The same LGM analysis was repeated to examine SAM implementation effects on reading. The LGM, however, failed to produce a statistically significant SAM effect on the slope when analyzed with comparison schools. The model yielded a chi-square statistic of χ2(1, N = 7,574) = 9.1, p < .01 and fit indices of CFI = .997 and RMSEA = .03, which is an acceptable fit of the model to the data. In this model, although the covariate for SAM implementation positively affected slope, the results were not significant, Ms = 0.19, t = 0.45, p = .64 (standardized coefficient = 0.43). Another LGM analysis was conducted to examine growth of reading scores of only the seven implementation schools over 3 years. A total of 3,719 students’ data were analyzed; Figure 3 shows implementation and comparison schools’ reading score changes, and Figure 2 shows the LGM diagram and results.
Values for various model fit indices, CFI = .99, RMSEA = .24, and chi-square test, χ2 = 12.3, indicated an adequate fit of model to the data. In this model, the slope was statistically significant, Ms = 2.5, t = 5.8, p < .01 (standardized coefficient = 0.43), showing a steady increase of reading scores from 2009–2010 to 2011–2012. This result indicates that the seven implementation schools’ reading scores increased 2.5 per year from 49.2 (intercept value). The correlation between intercept and slope was −13.2, which was negative but not statistically significant. This statistic indicated that increases on reading scores were made regardless of initial status in reading. These LGM results provide clear evidence of reading score improvement for all seven implementation schools but not significantly different from the comparison schools.
Student achievement for full implementation schools and their comparison schools
Although the LGM analysis did not reveal a significant statistical difference in reading score changes between implementation and comparison schools, the visual trend of the reading score changes showed that the SAM schools indeed improved for the three schools that achieved full implementation status of all 15 SAMAN features.
Figure 3 shows math and reading score changes for both full implementation schools and matched comparison schools. Math scores of full implementation SAM schools increased consistently from 2009–2010 (M = 45.6,SD = 15.4) to 2011–2012 (M = 50.3, SD = 14.1), while scores of comparison schools continuously decreased from 48.0 (SD = 17.1) to 45.0 (SD = 17.7) during the 3-year period. This result exactly reflects the LGM analysis of math scores with all SAM schools and comparison schools.
Reading and math score trends for full implementation SAM schools and their comparison schools
Figure 3 also shows a positive change for reading of 4.7 from 2009–2010 (M = 45.4, SD = 15.7) to 2011–2012 (M = 46.1, SD = 15.2). In contrast, comparison schools’ scores decreased over the project period. Three comparison schools’ reading scores were almost the same as full implementation SAM schools in 2009–2010 (M = 45.5, SD = 16.1) but lower than SAM schools in 2011–2012 (M = 44.2, SD = 15.3). These results indicate that SAM full implementation with fidelity in these three schools had a positive relationship with reading scores on the state assessment as well as math scores, although the reading score difference was not statistically significant.
Discussion
We examined the effectiveness of SAM on students’ academic performance in reading and math. As a systematic approach to school reform that is grounded in equity-based inclusive education and MTSS/RTI, SAM implementation positively affected the growth of student academic performance. When we compared state assessment scores in SAM schools with those in comparison group schools in the same school district, SAM had a statistically significant effect on the math score growth for three implementation years. Although the relationship of SAM to reading score growth was not statistically significant, consistent reading score improvement was observed among the seven SAM schools. Reading score trends differed remarkably between the three SAM schools that achieved full implementation with fidelity, which were improving, and the matching comparison schools, which had decreasing scores.
The statistically significant student performance change was not fully expected within the 3-year implementation period because educational change and performance improvement usually take more time as educators struggle to understand new activities mandated by the reform and to develop new knowledge and skills (Fullan, 2001). School reform requires time to engage in professional development, collaborate with other educators, reach consensus about core school decisions, evaluate and monitor, reflect on what is working and what are the current needs, and so on. Our results suggest the same conclusion but with a different route to the school reform outcome.
We did not examine the relationship between progress in the implementation of SAM and academic performance through statistical analysis; however, some findings suggest that student performance can be predicted by SAM implementation status. Student performance of the three full implementation schools showed more growth than the other implementation schools, and the gap between SAM and matched comparison schools became larger when SAM schools achieved full implementation with fidelity.
Limitations
A number of limitations may pose challenges to our interpretation of the findings. First, the use of purposively rather than randomly selected schools within the same school district prevented us from drawing firm conclusions that SAM provides effective inclusive practices in urban pre-K to eighth-grade schools. Comparison group schools were a convenience sample selected to match the characteristics of implementation schools within the same school district. Because SAM implementation includes some capacity building efforts within a district, the possibility exists that systematic approaches and supports learned by administrators from SAM implementation schools affected other schools within the district.
Second, all the data for the current investigation came from the same school district. This limited diversity in the sample prohibits conclusions that the findings generalize to other school districts and states; however, the pattern of growth obtained in the DCPS SAM schools reflected a similar pattern of a West Coast urban district (Sailor et al., 2009). Consequently, for the first and second limitations, further research is needed to include schools in diverse contexts (i.e., urban/rural, large/small enrollments, charter/public) with randomized or quasi-randomized implementation and control groups. Future research may also need to consider a district as a unit of implementation and compare schools in implementation districts with ones in control group districts for a clearer understanding of the model’s effectiveness.
Another limitation of the current study is that the relationship between SAM implementation status and student achievement could not be examined because SAMAN’s psychometric properties have not yet been fully explored and peer reviewed. However, SAMAN’s preliminary evidence of technical adequacy was sufficient for our fidelity of implementation purposes. For example, we could not evaluate the relative contribution of each of the SAM’s CFs measured by the SAMAN tool to student outcomes. Nevertheless, the present study was intended to be a “sledgehammer look” at student-level outcomes associated with a multicomponent intervention implemented over time. Future research with schoolwide inclusive reform models may need to examine the relative contribution of different systemic intervention components and their benefits on behavior or academic outcomes with various student variables.
Furthermore, space limitations prevented a detailed analysis of achievement gap results applied to the special education subgroup, a population of particular interest to readers of this journal and will be the subject of a future paper. As a quick overview, the descriptive analysis results revealed that the average DC-CAS math scores of students with IEPs in the three enculturated SAM implementation schools continuously increased from 32.4 (SD = 13.9) in 2009–2010 to 38.6 (SD = 14.5) in 2011–2012, while the ones from matching comparison schools decreased from 34.5 (SD = 15.4) to 31.3 (SD = 18.0). Meanwhile, average proportion of time in general education settings for students with IEPs in the implementation schools increased from 32.6% in 2010–2011 to 65.0% in 2011–2012. Likewise, due to district policies supporting inclusion, students with IEPs in matching comparison schools increased from 35.4% in 2010–2011 to 64.6% in 2011–2012. The inclusive education environment in the three full implementation SAM schools showed an even great increase with average proportion of time rising from 20.0% in 2010–2011 to 80.7% in 2011–2012.
Finally, additional measurements and analyses are needed in future research to detect pedagogical changes that occur with schoolwide inclusive reform and their mediating relationship with student achievement. Although SAM included strong supports for instructional improvement required with the changes accruing to inclusive education, we did not measure actual teacher behavior changes. Pedagogical changes will provide more information to understand how integrated, inclusive school practices can change instruction and improve student performance.
Conclusion
SAM has been shown to potentially be an effective schoolwide inclusive reform model for increasing equity-based inclusive education practices and enhanced student achievement for all students in urban elementary and elementary/middle schools. Understanding how inclusive education improves a school is a critical question for schools because inclusive education is not only for students with disabilities but also for all students with diverse learning needs and cultural backgrounds. Bearing in mind the limitations described above, findings in this investigation indicate that this approach to inclusive education may benefit all students by improving student academic performance, which supports previous research investigating effects of inclusive education on all students (Cole et al., 2004; Sailor et al., 2009; Sailor et al., 2006). These results from urban elementary and elementary/middle schools provide potential insights into disability, socioeconomic status, race, and other culture-related achievement disparities in the future. Although the current study focused on overall improvement of academic performance, SAM was designed to create a positive, inclusive school culture supported by evidence-based practices for behavior and academic instruction, strong leadership, family and community engagement, and district supports.
Footnotes
Authors’ Note
Office of Special Education Programs (OSEP) project officers Grace Zamora Durán and Tina Diamond served as the project officers. The views expressed herein do not necessarily represent the positions or policies of the Department of Education. No official endorsement by the U.S. Department of Education of any product, commodity, service, or enterprise mentioned in this publication is intended or should be inferred.
Declaration of Conflicting Interests
The author(s) declared no potential conflicts of interest with respect to the research, authorship, and/or publication of this article
Funding
The author(s) disclosed receipt of the following financial support for the research, authorship, and/or publication of this article: This article was produced with the support of the U.S. Department of Education, Office of Special Education Programs Grant H326Y120005, Schoolwide Integrated Framework for Transformation (SWIFT) Center.