
Abstract
Exploratory and confirmatory factor analyses were applied to the responses of two respective independent samples of Native American college students on the Native American Acculturation Scale (NAAS). Three correlated dimensions were found to underlie NAAS items and these dimensions may also comprise a broader higher order dimension of Native American acculturation.
Many multicultural scholars agree that mental health providers lack the necessary sensitivity, knowledge, and skills to effectively address the needs of Native Americans (LaFromboise, Trimble, & Mohatt, 1998). As one of the most marginalized racial groups in the United States, Native Americans continue to face many challenges. Constant and persistent contact with White culture, through forced relocation, boarding schools, and displacement to urban areas, created daily pressure for Native Americans to give up their distinct cultural identities, beliefs, and practices and adapt to the dominant culture (Choney, Berryhill-Paapke, & Robbins, 1995; Duran, 2006). The long-term effects of such neglect, harm, and cultural devastation led to diminished trust in counseling services and government programs, profound intergenerational trauma, and ongoing identity conflicts (Duran, 2006). Understanding the process of acculturation, which diminished Native American cultural values and traditions (Horse, 2001), is essential for counselors to be culturally effective with Native American clients (Choney et al., 1995; Duran, 2006). Limited attention to the experiences of Native Americans within the training of counselors and psychologists has created a profession ill prepared to fully comprehend and address the unique identity and acculturation challenges facing Native Americans. Despite the importance of acculturation and its influence on Native Americans, there is limited research on acculturation with this group and few tools available for assessment.
A recent review of 22 years of acculturation research by Yoon, Langrehr, and Ong (2011) indicated the importance of acculturation research, particularly with respect to acculturation models and assessment. However, the majority of research conducted included Latino/a Americans and Asian Americans; therefore, most advancements in assessing and conceptualizing acculturation occurred for these groups, with little attention paid to the acculturation of Native Americans. Of the few studies conducted on Native American acculturation, none examined the dimensionality of Native American acculturation. The purpose of this study was to advance the understanding of Native American acculturation through examination and refinement of one of the few existing measures of Native American acculturation, the Native American Acculturation Scale (NAAS; Garrett & Pichette, 2000).
Models of Acculturation
According to Miller (2007), acculturation was typically conceptualized as either unilinear or bilinear. From the unilinear perspective, acculturation is a continuum, whereby individuals identify with either the host (i.e., dominant) culture or their (i.e., minority) culture of origin. Thus, the unilinear model runs from acculturation to enculturation, and biculturalism exists as the midpoint between the two cultures. From the bilinear perspective, acculturation and enculturation are viewed as discrete continua, whereby acculturation is viewed as the level of identification and/or integration with the dominant culture and enculturation is viewed as the level of identification and/or integration with the minority culture. Proponents of the bilinear perspective (e.g., LaFromboise, Coleman, & Gerton, 1993) maintained that individuals may be bicultural without losing their core cultural identity. Other scholars advocated for connecting the acculturation process to specific traditional beliefs across behavioral, cognitive, affective–spiritual, social–environmental domains (e.g., Choney et al., 1995), resulting in a multidimensional approach to acculturation that is rooted in the unilinear perspective. A criticism of viewing acculturation from the unilinear perspective was that associated assessments are unidimensional in structure (e.g., Matsudaira, 2006). However, some measures developed from the unilinear perspective were found to be multidimensional in structure (e.g., Suinn, Ahuna, & Khoo, 1992).
The Acculturation Rating Scale for Mexican Americans (ARSMA; Cuellar, Harris, & Jasso, 1980) and the Suinn–Lew Asian Self-Identity Acculturation Scale (SL-ASIA; Suinn, Rickard-Figueroa, Lew, & Vigil, 1987) are two early and frequently used acculturation measures. Both scales represent the unilinear perspective of acculturation yet their underlying structures are multidimensional, composed of distinct yet related domains. Later adaptation of the ARSMA resulted in the ARSMA-II (Cuellar, Arnold, & Maldonado, 1995), which used the bilinear perspective with separate scales assessing acculturation and enculturation. Thus, the initial work on the ARSMA led to expanding the approaches to conceptualizing and measuring acculturation among Mexican Americans.
Acculturation of Native Americans
Acculturation was defined, for Native Americans, as the “degree to which the individual accepts and adheres to both majority (White/Euro-American) and tribal cultural values” (Choney et al., 1995, p. 76). Accordingly, based on personal and tribal experiences, Native Americans may differ significantly in the ways they follow and commit to various tribal beliefs, customs, language, family structure, and cultural practices and traditions (Garrett & Pichette, 2000). The distinct experiences of Native Americans (Choney et al., 1995), including forced removal from native tribal lands, led to a process of assimilation unlike immigrant groups for whom the majority of acculturation models and assessments were created. Despite these differences, however, Native Americans experience persistent discrimination and racial microaggressions culminating in racism-related stress that may be similar to that experienced by African Americans, Latino/a Americans, and Asian Americans (Utsey, Chae, Brown, & Kelly, 2002). Facing such discrimination and dealing with the process of acculturation can often lead to alienation, isolation, acculturative stress, self-doubt, and identity struggles for Native Americans (Garrett & Pichette, 2000; LaFromboise, Albright, & Harris, 2010). However, despite obvious struggles that can accompany acculturation in general, far less is known about the acculturation of Native Americans relative to other groups. A major obstacle to advancing knowledge of Native American acculturation is the lack of research supporting assessments of acculturation for use with this population.
Assessment of Native American acculturation
Although previous reviews of acculturation measures (e.g., Kim & Abreu, 2001; Ryan-Arredondo & Sandoval, 2005; Zane & Mak, 2003) made no mention of any Native American acculturation scales, there were some attempts to assess the unique acculturation of Native Americans. However, few, if any, efforts were made to gather support for the validity of these assessments, and many have focused narrowly on a particular Native tribe or group or limited age group. Among the published studies we identified, the Rosebud Personal Opinion Survey (RPOS; Hoffman, Dana, & Bolton, 1985) and the Navajo Community Acculturation Scale (NCAS; Boyce & Boyce, 1983) are examples of the assessments designed to be community specific in their focus and therefore may not readily generalize across tribes and regions. The NCAS is a one-item measure, based on a unilinear model, which assesses community acculturation on a scale from most traditional or low acculturation to high acculturation. Likewise, the RPOS, with 32 items and five subscales, is also unilinear in orientation placing Native Americans on a continuum with low acculturation and high acculturation anchors. The Living in Two Worlds Survey (LTWS; LaFromboise, 1999) is bilinear in nature and assesses the degree to which Native Americans are adept in Native culture and White culture. Although the LTWS is less specific to particular tribes, it was designed for adolescents, thus potentially limiting its utility with adult populations. Last, the NAAS (Garrett & Pichette, 2000), also unilinear in its orientation, is not specific to particular tribes and was designed for younger to older adults; thus, it should be applicable to a range of tribes and ages.
The Present Research
The NAAS (Garrett & Pichette, 2000) was modeled after two influential acculturation scales—the ARSMA (Cuellar et al. 1980) and the SL-ASIA (Suinn et al., 1992). The research on these instruments advanced the understanding of acculturation for Mexican Americans and Asian Americans in particular and acculturation in general. The psychometric scrutiny of these instruments brought refinements to them but also informed the creation of new assessments of acculturation (e.g., Cuellar et al., 1995); both outcomes of the earlier work, therefore, contributed to the advancement of the assessment of acculturation. We sought to begin this same process with Native American acculturation. Given the unique history of Native Americans and the limited tools available to assess their acculturation, an examination of construct validity evidence of one of the few existing assessments of Native American acculturation, the NAAS, not only provides scrutiny of this measure but can also advance the understanding of Native American acculturation.
As a first step in establishing validity support for the NAAS, we examined the dimensions underlying it using exploratory and confirmatory approaches in two independent samples of Native American college students. Given that the exemplars for the NAAS were found to be multidimensional, we did not expect that a single dimension would underlie the NAAS items, but we also had no expectations for the actual number and contents of dimensions that would be present in the first sample. We used a second sample to cross-validate the model proposed in the first sample. We expected that the derived subscales would be internally consistent.
Method
Participants and Procedures
We used two existing samples of Native American college students from two national research studies on acculturation with this population (Ecklund, 2005; Reynolds, Ecklund, & Terrance, 2011).We used the same data collection procedures in both studies, which involved the use of personal contact to increase the investment and trust that Native American participants might have in the research process, as recommended by LaFromboise et al. (1990). Additional information on the data collection procedures and how the site coordinators were used is provided in Ecklund (2005) and Reynolds et al. (2011).
Sample 1 (N = 216)
This sample of Native American college students from 25 predominantly White and Tribal colleges or universities from across the country consisted of 64% women and 36% men (Mdnage = 20, response category range = 18–≥25). Forty percent of these Native American students identified as multiracial; in addition to Native American, European American, and Latino/a American being the most common other racial groups identified. Most students (97%) were full-time and their class standing was 31% first, 24.5% second, 22% third, and 22.5% fourth year (5.6% did not report their grade level). The mean self-reported grade point average for this sample was 2.98, range = 1.47 to 4.0. In addition, 77.6% of the students reported that their mother had a high school diploma or less, while 61% reported that their father had a high school diploma or less. There were a total of 115 different Native American tribes to which these participants indicated they were affiliated.
Sample 2 (N = 273)
This sample of Native American college students consisted of 63% women and 37% men (Mdnage = 22, range = 18–≥25). There were 23 higher education institutions representing campuses from the southwest, northeast, and western regions of the United States. Twenty-seven percent of these Native American students identified as multiracial, with European American and Latino/a American again being the most common other racial groups identified. Most students (92%) were full-time and their undergraduate class standing was 35.7% first, 27.1%, second, 16.0% third, 10.0% fourth, and 11.2% fifth year students (1.5% did not respond). The mean self-reported grade point average for this sample was 2.97, range = 1.53 to 4.0. In addition, 60.4% students reported that their mother had a high school diploma or less, while 52.2% reported that their father had a high school diploma or less. There were a total of 112 different Native American tribes to which these participants indicated they were affiliated.
Measure
The Native American Acculturation Scale
NAAS (Garrett & Pichette, 2000) was directly adapted from two unilinear measures, the ARSMA (Cuellar et al. 1980) and the SL-ASIA (Suinn et al., 1992), by rewording their items to focus on Native Americans. A diverse panel of experts from a variety of tribal backgrounds and professions/disciplines were consulted about the make-up of the NAAS. The NAAS contains 20 items with questions about six different areas: identity (2 items), language (5 items), friendship (3 items), behaviors (4 items), attitudes (1 item), and generational/geographic background (5 items). Examples items include “What language do you speak?” and “How do you identify yourself?” Items are scored on a 5-point Likert-type scale ranging from 1, representing low acculturation or high Native American identity to 5, indicating high acculturation or high mainstream White American identity. The closer the scale score is to either pole (e.g., 1 or 5), the clearer the overall preference for either the minority or majority culture, respectively. Garrett and Pichette (2000) reported a coefficient α of .91 for the full scale based on sample of high school students, while Ecklund (2005) reported .90 for a sample of college students. There are limited studies available that used the NAAS likely because there has been no additional psychometric work completed beyond their additional study.
Demographic form
The Demographic Form was composed of questions developed by the authors for both studies to gather information on the demographic characteristics of the participants, which included age, gender, parents’ educational level, family income, religious/spiritual traditions, year in school, grade point average, and type of college attended. In addition, information on level of interaction with other Native American students, staff, and faculty and involvement with Native American student services on campus was gathered.
Results
Sample 1: Exploratory Analyses
An exploratory factor analysis using principal axis factoring (PAF) was conducted on Sample 1 item-level data. We employed a combination of empirical and substantive criteria to determine the dimensions underlying the NAAS items. This included an examination of the scree plot and the percentage of variance accounted for (VAF) by the potential factors, along with an examination of the substantive make up of the factors. The scree plot and percentage of VAF suggested there were three to four factors present within these data. The first five eigenvalues of the nonrotated factors were (with percentage of VAF in parentheses): 7.46 (37.32), 1.86 (9.28), 1.63 (8.16), 1.23 (6.14), and 1.03 (5.14). The results of a parallel analysis (Horn, 1965) were also used in the decision of how many factors to extract. A parallel analysis is commonly regarded as one of the most accurate methods for selecting the number of factors to retain in a factor analysis (e.g., Velicer & Jackson, 1990). We generated 500 random permutations of the data in our study to compute average eigenvalues for the parallel analysis. The mean eigenvalues computed from the random data at the 95th percentile were then compared with the actual eigenvalues that were obtained. This procedure indicated that only the first three eigenvalues from the actual analysis were greater than the mean eigenvalues generated from the parallel analysis, thus supporting the presence of three factors. We therefore extracted a three-factor solution by PAF, and since we did not assume the factors would be independent, an oblique (i.e., Promax) rotation was applied. The resulting three eigenvalues were (with %VAF in parentheses) 6.99 (34.95), 1.32 (6.59), and 1.16 (5.81). The three factors correlated from .50 to .60.
Initial interpretations were made of the three factors based on inspection of the structure matrix. These factors were given initial labels: self-origin, language, and self-identity. We then focused attention on the pattern matrix for item analyses. Empirical and substantive criteria guided item analyses. We sought to retain items if their pattern coefficients were >.3 on only one factor and if they had communality estimates >.2. Table 1 shows the pattern coefficient matrix, descriptive statistics, and communality estimates of the 20 NAAS items. All items exceeded the .3 cutoff criterion for pattern coefficients on one of three factors except Item 19, which had a minor cross-loading (.34) on Factor 1 but was more clearly associated with Factor 3 (.58). The absolute difference between these coefficients was .24, which exceeded the absolute difference cutoff criterion of .15 suggested by Worthington and Whittaker (2006), so this item was retained on Factor 3. All communality estimates were above .2, and the average of the item–total correlations for Factors 1, 2, and 3 were .62, .67, and .50, respectively. In addition, each of the item–total correlations exceeded the minimum value of .30 proposed by Nunnally and Bernstein (1994).
Results of Principal Axis Factor Analysis With Promax Rotation and Descriptive Statistics of Native American Acculturation Scale Items in Sample 1
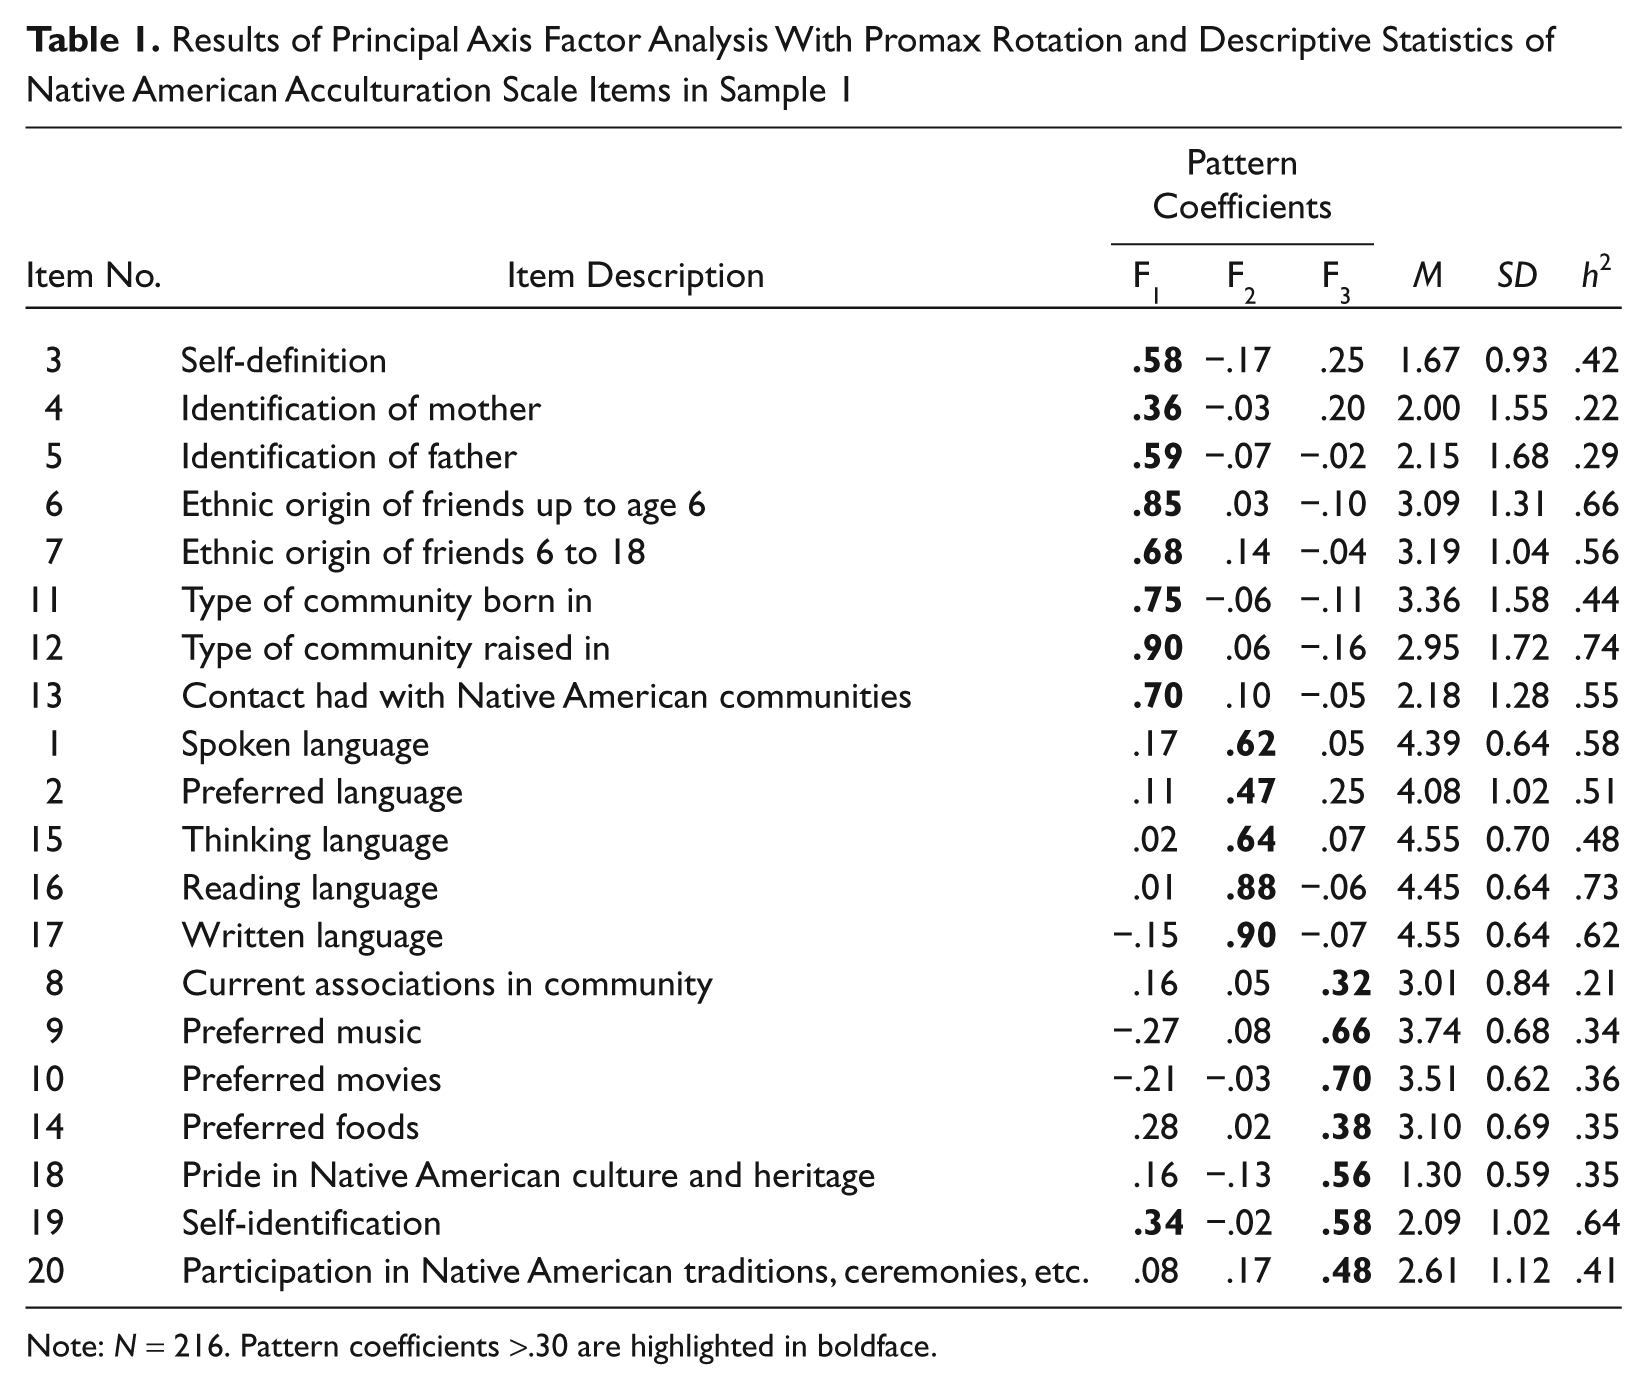
Note: N = 216. Pattern coefficients >.30 are highlighted in boldface.
The first, second, and third factors, respectively, contained items that assessed self and family biographical-type data, preference for primary language and means of self-expression (Native American vs. English), and current preferences for music, movies, food, and community involvement. As a check on our initial labels of self-origin, language, and self-identity, we consulted with two Native American scholar–practitioners regarding the substantive make up of these empirically derived subscales. Based on their feedback requesting more accessible and meaningful descriptions of the subscales, the final three respective subscale labels were revised to Core Self, Cultural Self-Expression, and Cultural and Community Engagement.
Table 2 presents the descriptive statistics for the proposed NAAS subscales and their intercorrelations in Sample 1. The new subscales had adequate Cronbach’s αs ranging from .77 to .85 and intercorrelations ranging from .55 to .57. Overall, the results of the exploratory factor analyses along with the parallel and item analyses supported three dimensions underlying the NAAS items in Sample 1. In addition, the new factor-based subscales also showed adequate internal consistency in this sample.
Descriptive Statistics and Scale Intercorrelations for NAAS Subscales in Samples 1 and 2
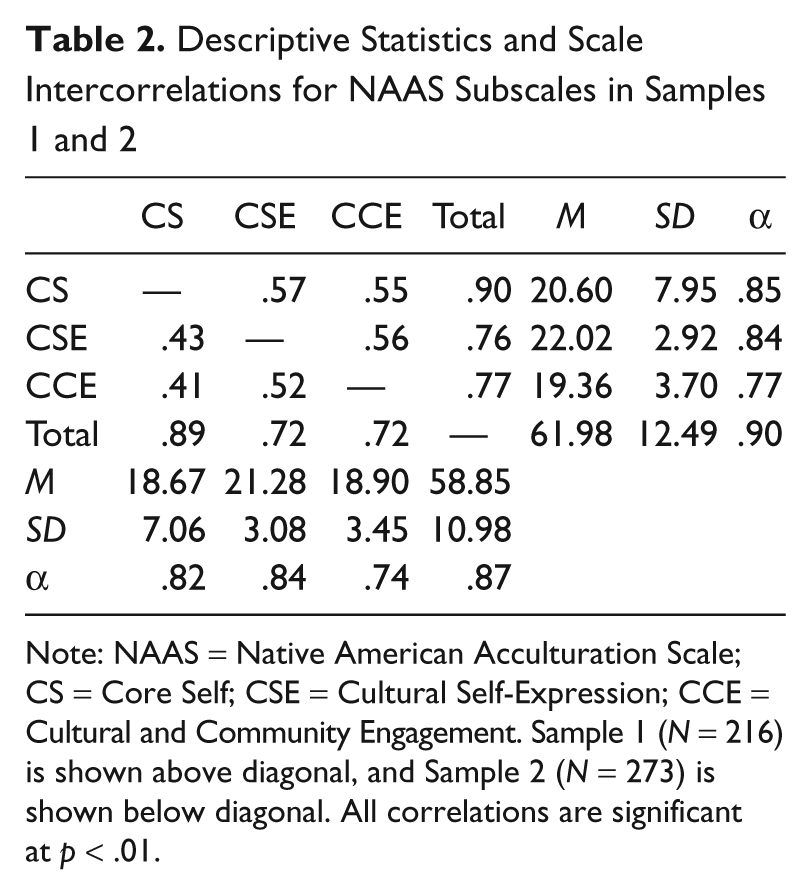
Note: NAAS = Native American Acculturation Scale; CS = Core Self; CSE = Cultural Self-Expression; CCE = Cultural and Community Engagement. Sample 1 (N = 216) is shown above diagonal, and Sample 2 (N = 273) is shown below diagonal. All correlations are significant at p < .01.
Sample 2: Confirmatory Analyses
We sought to cross-validate the three- dimensional structure of the NAAS derived in Sample 1 by confirmatory factor analysis (CFA) of Sample 2 data. The data were screened for multivariate normality prior to conducting the CFA. Mardia’s (1970) normalized estimate of multivariate normality (z = 11.15; p < .001) clearly indicated these data could not be characterized as multivariate normal. Examinations of the individual item distributions, however, showed moderate levels of skewness and kurtosis. Given this departure from normality and the relatively small sample size, the Satorra and Bentler (1994) robust method of parameter estimation (i.e., robust maximum likelihood) was used. The CFA was implemented with LISREL 8.8 (Jöreskog & Sörbom, 2006) using the covariance and asymptotic covariance matrices. Two models were tested initially: a one-factor model and a correlated three-factor model (see Figure 1, Models 1 and 2, respectively). The results of the CFA of the one-factor model indicated that the Satorra and Bentler scaled chi-square was significant, χ2(170) = 1156.22, p < .001. Several additional indicators were used to assess model fit. The comparative fit index (CFI; Bentler, 1990) is a measure of relative fit indicating how much better the hypothesized model fits compared with a “null” model. A robust CFI value of .73 was obtained, which is poor because it was well under .90, the value Bentler considers acceptable. The standardized root mean square residual (SRMR) was used to examine the difference between the predicted and observed covariance of the model. According to Hu and Bentler (1999), an SRMR value of less than .08 indicates good fit and less than .10 is acceptable; thus, the obtained value of .11 was a poor fit. The amount of model fit was assessed by the root mean square error of approximation (RMSEA; Steiger, 1990). Using standard cutoff criteria of <.05, .08, and .10 representing good, reasonable, and poor fitting models, respectively, the robust RMSEA = .15 (90% confidence interval [.14, .15]) also indicated a poor fit. As expected, these results indicate that the one-factor (i.e., unidimensional) model fit the data poorly.
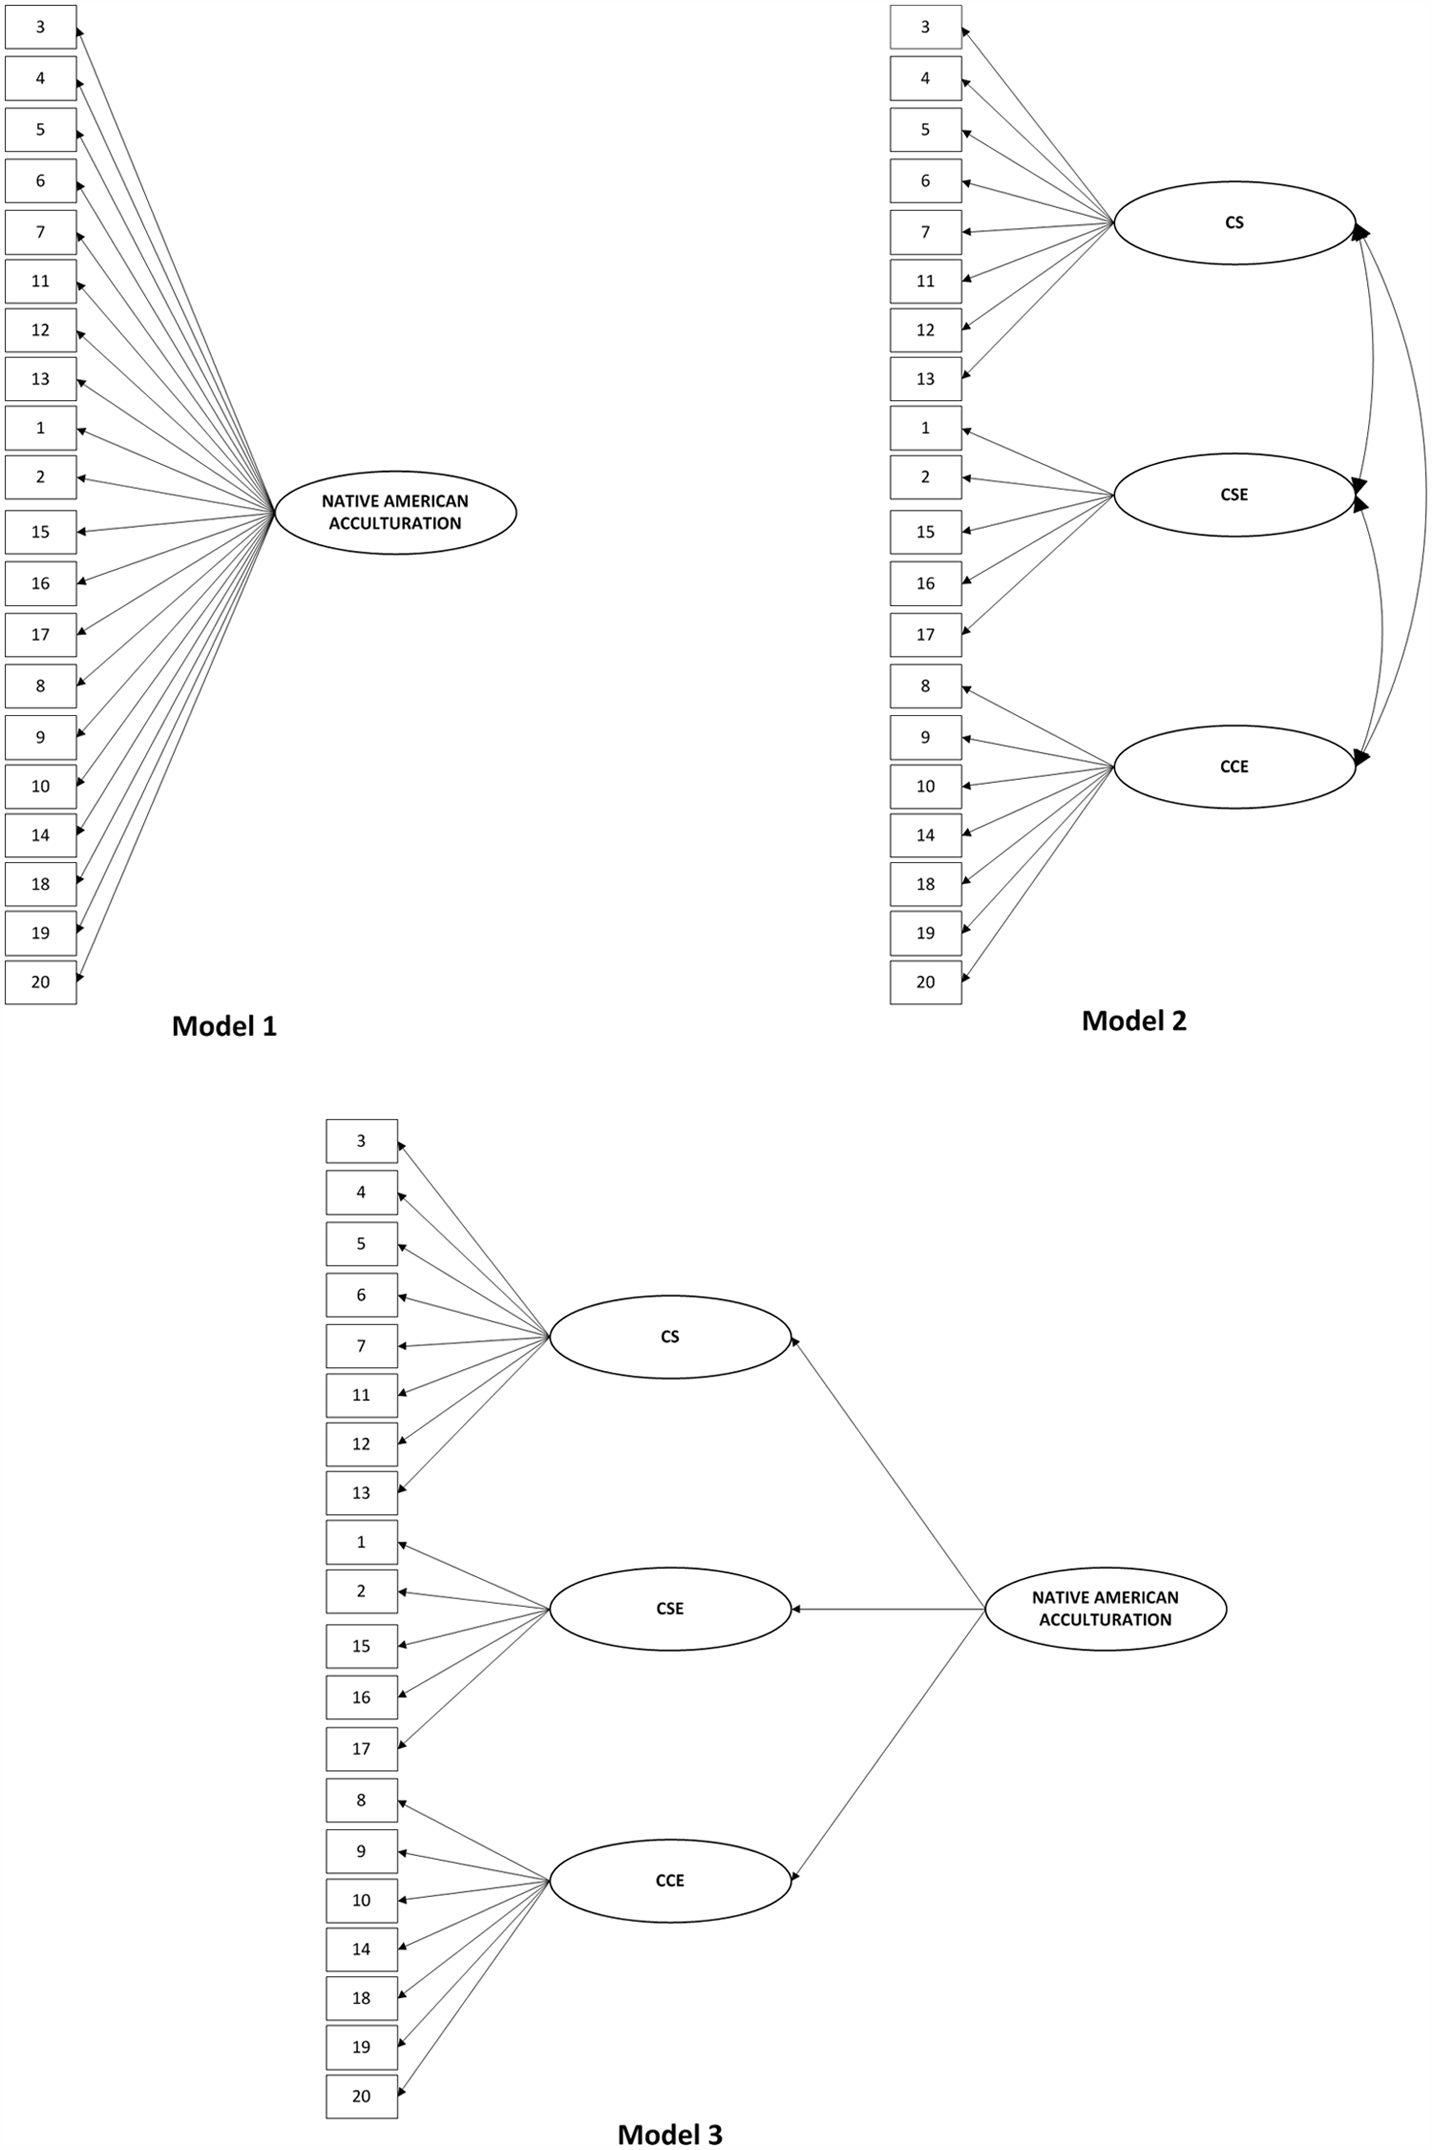
Three Potential Models of the Structure of the Native American Acculturation Scale
The results of the CFA of the correlated three-factor model were as follows: the Satorra and Bentler scaled chi-square was significant, χ2(167) = 503.77, p < .001; robust CFI = .91; SRMR = .08; and robust RMSEA = .086 (90% confidence interval [.78, .094]). All indicators of fit were within their respective acceptable ranges, thus showing a considerable improvement over the fit of the one-factor model. The difference between the scaled chi-squares is normally distributed, thus enabling a statistical comparison between these nested models (Satorra & Bentler, 1994). The difference in fit between the models was significant, Δχ2(3) = 652.45, p < .001, supporting the superiority of the three-factor model. In addition, the standardized parameter estimates (i.e., factor loadings) of the items from the CFA of the three-factor model were all significant (MF1 = .60, range = .39–.83; MF2 = .72, range = .65–.77; and MF3 = .54, range = .38–.70). The average of the item–total correlations across the factors ranged from .46 to .64, and no single item was below .30. Furthermore, the factor correlations were significant, ranging from .40 to .62.
Because moderate to strong correlations were observed between the three factors in both samples, a higher order factor model consisting of three correlated lower order factors and one higher order factor is also a possibility (see Figure 1, Model 3). However, since the fit of this model cannot be differentiated from that of the correlated three-factor model, only the standardized parameter estimates for the lower order factors on the higher order factor were reported. These estimates were .61, .82, and .78 for Factors 1, 2, and 3, respectively. As can be seen in Table 2, for Sample 2, the three subscales were generally similar in internal consistency, intercorrelations, and central tendency as compared with Sample 1. The results provide cross-validation support for the correlated three-factor model of the NAAS and also support the presence of a higher order factor in addition to the three specific dimensions.
Discussion
The dimensionality of an existing measure of Native American acculturation, the NAAS (Garrett & Pichette, 2000), was examined in two independent samples of Native American undergraduate college students representing a diversity of tribal heritages from universities across the United States. Exploratory analyses of Sample 1 data yielded three correlated dimensions of Native American acculturation composed of Core Self, Cultural Self-Expression, and Cultural and Community Engagement. Confirmatory analyses of Sample 2 data supported the structural validity of the correlated three-factor model of the NAAS, and also supported the presence of a higher order dimension. Therefore, the NAAS measures a broader domain of Native American acculturation in addition to the three specific yet related domains identified.
Our finding of three specific dimensions provides support for a multidimensional approach to measuring Native American acculturation from the unilinear perspective using the NAAS. Identifying the specific domains of Core Self, Cultural Self-Expression, and Cultural and Community Engagement provides finer distinctions in assessing individual differences in Native American acculturation that would not be possible in the aggregate (i.e., a one-dimensional approach). Despite higher numbers of factors often being reported across studies employing the SL-ASIA (Suinn et al., 1992), it is more likely that three dimensions underlie the original measure (Ponterotto, Baluch, & Carielli, 1998). In addition, Kim and Abreu (2001) suggested that cognitive, affective, and behavioral are three core dimensions that characterize acculturation. Although three dimensions were found currently for the NAAS, they do not appear to fall cleanly into these three domains. Indeed, the unique experiences of Native Americans, relative to immigrant groups, may explain these findings; however, it is also possible that other factors such as specific item makeup may also contribute to an alternative outcome.
The support found for the higher order and correlated three-factor models along with the lack of support for a one-factor model indicates that assessing only the broader domain of Native American acculturation would yield an incomplete understanding. Using the three specific dimensions can provide an improvement, while use of both the broader and specific levels of acculturation can yield a better (i.e., more complete) understanding of Native American acculturation when using the NAAS. Below, we consider the meaning of each of the three factors and how their use can further comprehension of Native American acculturation for counseling professionals.
Those individuals who score high on the first factor, Core Self, are less likely to have Native culture be a central part of who they are possibly because they grew up in predominantly White communities, had less contact with other Native Americans, and their parents may not strongly identify with Native culture. Those who score low on Core Self are less acculturated and more strongly connected to their native self. In terms of the second factor, Cultural Self-Expression, a higher score indicates that individuals are more likely to express themselves and even reflect on their experiences using English, while those with lower scores may think, speak, write, and feel using their native language thus creating unique opportunities to experience their culture. Finally, for the third factor, Cultural and Community Engagement, a high score suggests that individuals may be less likely to participate in and take pride in their Native American culture and may be more aligned with the White culture, while those with low scores are likely to be more involved with their native culture and more identified as being Native American. These distinctions can be important to counselors and psychologists as they consider what role Native American culture may play in a client’s ability to communicate, relate to, and participate in Native culture and what impact that has on their identity and overall level of acculturation.
This report is just one step in ongoing efforts to expand understanding of acculturation with Native Americans and develop the NAAS as a measure of their acculturation. Although the structural validity of the NAAS was identified and supported here, this was only one important step in establishing the construct validity of this measure. These results need to be weighed against the limitations of this study and future research needs to address any limits. The limits of this exploration of the NAAS center on the samples used as well as analytical issues. In terms of sample, using a more diverse noncollege student-based sample in future studies will help investigate the viability of the NAAS for the broadest Native American population possible. Additionally, using preexisting data limited the selection of additional measures and variables for this study. Future studies could be designed that intentionally chose variables and measures that would enhance understanding of Native American acculturation as a concept and as a measure. One limitation related to the analysis is the level of fit obtained for the three correlated factor model. Although the fit of this model was deemed to be adequate, it was within the marginal range overall. Despite this, however, all parameter estimates were significant, and post hoc model analyses did not suggest any substantive revisions to the model. Future work will also need to examine other aspects of construct validity such as convergent and criterion evidence. Finally, examining temporal consistency (i.e., test retest reliability) is necessary to provide additional support for the reliability of the subscales supported by this research.
This examination helped advance the assessment of Native American acculturation by identifying multiple dimensions that underlie the broader construct of Native American acculturation through refining an existing measure of acculturation—the NAAS (Garrett & Pichette, 2000). The findings from this study can be used to inform the development of future assessments of Native American acculturation and enculturation. Although the NAAS is focused on acculturation only (i.e., the unilinear perspective), our results suggest that assessing the content domains of self-identity, self-expression, and cultural and community engagement would also be important to assessing enculturation (i.e., from the bilinear perspective). Prior to the examination of the NAAS and exploration of its dimensions within this study, the availability of empirically supported Native American acculturation instruments for either research or practice was limited; therefore, it is hoped that this first step taken with the NAAS will stimulate additional research. Through continued development and application, the NAAS can further understanding of the acculturation of Native Americans, which will have implications for provision of counseling services as well as a deeper appreciation of the impact of acculturation on important developmental and psychological issues facing the Native American community.
In conclusion, the insight gathered from this research can assist counselors in their efforts to more fully consider the cultural realities and unique experiences of Native Americans as a whole, while increasing sensitivity to individual differences within this population. Given that Native Americans continue to be an understudied and poorly served population, both on and off college campuses, advancing assessment of their acculturation may contribute to improving and/or tailoring interventions and informing future research with the Native population.
Footnotes
Acknowledgements
Special appreciation is expressed to members of NINLHE for their insight and commentary on this study and to Roger Worthington for providing helpful feedback on an earlier draft of the article.
The author(s) declared no potential conflicts of interest with respect to the research, authorship, and/or publication of this article.
The author(s) received no financial support for the research, authorship, and/or publication of this article.