



Abstract
The psychometric properties of the Life Perspectives Inventory (LPI-English language version), a new instrument designed to assess characteristics associated with nonreligious spirituality in high school–age adolescents, were examined in two phases. Phase 1 demonstrated the survey’s factorial validity and internal consistency and the test–retest reliability of four derived dimensions (Optimistic Outlook, Purpose and Meaning in Life, Connection with the Divine, and Active Spirituality) with a large sample (N = 531) of Washington state high school students. In Phase 2, the LPI’s dimensionality was cross-validated using confirmatory factor analysis with more than 400 Michigan high school students. Alpha and stability coefficients computed with the Michigan sample provided further evidence for the LPI-E’s reliability. Implications for school counseling practice are included.
Although spirituality is a central dimension to the adolescent experience (Benson, Scales, Syvertsen, & Roehlkepartain, 2012; Shek, 2012), in comparison to others (e.g., empathy, metacognition, self-regulation) it has received considerably less attention by developmental theorists and researchers (Petersen, 2008). In their literature review on the spiritual development of children, adolescents, and young adults, Benson, Roehlkepartain, and Rude (2003) observed that spirituality and faith-related issues were addressed in less than 1% of research articles. DeHaan, Yonker, and Affholter (2011) found this neglect to be somewhat puzzling given the numerous documented positive outcomes linking qualities of healthy spirituality with physical, emotional, and mental health (e.g., Kang & Romo, 2011; Koenig, 2010; Smith & Denton, 2005; Yonker, Schnabelrauch, & DeHaan, 2012). Given this dearth of literature, Petersen (2008) strongly advised developmental psychologists to include in their research agendas the empirical study of adolescent spiritual life. Similarly, exploration of student spirituality remains in its infancy and much work has yet to be conducted in K–12 school settings (Sink & Hyun, 2012). Sound measures of nonreligious adolescent spirituality also need to be constructed for use with secondary-age students in school counseling programs and other counseling-related settings.
To address in part this research gap, the aim of the investigation was to extend the psychometric work conducted on the Life Perspectives Inventory (LPI; Seo & Sink, 2010; Sink, 2009). In particular, the dimensionality of the English language LPI (LPI-E) was first explored with a sample of high school students. Second, to cross-validate the LPI-E’s dimensionality, a confirmatory factor analysis was conducted with a different adolescent group. These questions guided our research:
Theoretical Approaches to Spiritual Development
To conceptually anchor their investigations, Estep (2002) asserted that many researchers in childhood and adolescent spirituality appeal to any or all of these notable developmental theorists: Erikson and Erikson (1997), Piaget (Piaget & Inhelder, 2000), Kohlberg and Hersh (1977), and Fowler (see Parker, 2011). Structuralists or stage theorists postulate that human attributes related to spirituality (e.g., self- and other-awareness, mindfulness, meaning-making) evolve from infancy to late adulthood much like physical, emotional, intellectual, and social developmental characteristics. Movement from one developmental stage to the next is largely a function of internal mechanisms that are influenced by environmental factors. Critics, however, suggest that conventional stage theories do not adequately define spirituality nor do they provide a comprehensive depiction of the processes involved in spiritual formation (Estep, 2002).
To address the limitations of well-established developmental theories when they are applied to spirituality, some counseling scholars have adopted a more broad-based perspective. For example, Mickel and Liddie (1998), working from a family therapy orientation, and Sink and Devlin (2011), operating from a school-based counseling perspective, proposed that student spirituality is facilitated principally through the social and communal contexts in which the individual functions. Sink and his colleagues (Sink & Cleveland, 2012; Sink & Devlin, 2011; Sink & Hyun, 2012; Seo, Sink, & Cho, 2011) adapted principles from psychological constructivism (Raskin, 2002) as a working conceptual framework for their childhood and adolescent spirituality research as well as for the development of the LPI discussed later. By combining Vygotsky’s (1994) sociocultural and Lerner’s (Lerner & Overton, 2008) contextual perspectives with well-established developmental theories (Erikson & Erikson, 1997; Kohlberg & Hersh, 1977; Piaget & Inhelder, 2000), spiritual development in children and youth can be viewed as one pathway situated among a complex network of intersecting developmental pathways (e.g., cognition, psychosocial, neurological; see Lerner, Alberts, Anderson, & Dowling, 2006, and Mancini & Roberto, 2009, for details). Furthermore, as Watts (2011) pointed out, the contextual-constructivist perspective views human spirituality as emerging within a milieu of significant personal relationships (e.g., family and peers) and related larger systems (e.g., culture, community, language, religion).
Vygotsky’s zone of proximal development (ZPD; Daniels, Cole, & Wertsch, 2007) is a useful framework for studying the motivational factors related to spiritual growth. Fundamentally, his “mentoring” model suggests that various intrinsic processes (e.g., cognition, emotional well-being, neurobiology) combined with meaningful human interactions will foster movement from one’s actual level of spiritual development toward one’s potential level of spiritual development (Court, 2010; Estep, 2002). In other words, adding the ZPD to the understanding of student spirituality underscores the importance of significant others (e.g., friends, parents, teachers, and counselors in schools) to mediate learning (Chaiklin, 2003) as well as spiritual/religious development (Court, 2010; Estep, 2002). Manifestations of spirituality are regarded as scaffolding schemas that arise from one’s continuing involvement with the sociocultural world (Court, 2010; Estep, 2002; Seo et al., 2011). Consequently, students facing school and life challenges are supported by their spiritual schema and by members of what Bronfenbrenner (2005) labeled the microsystem.
Adolescent Spirituality and Positive Psychology
In addition to a psychological constructivist orientation toward spiritual development, the theoretical and research underpinnings of the current study included two related strands of positive psychology: strengths-based school counseling (Galassi & Akos, 2007) and developmental asset theory (Terjesen, Jacofsky, Froh, & DiGiuseppe, 2004). Sink and colleagues’ LPI research (Sink, 2009; Seo & Sink, 2010) address the social–psychological features linked with human thriving (Fredrickson, 2007), namely, existential well-being, present-centeredness (mindfulness), life purpose and satisfaction, meaning-making, and spiritual connectedness. Positive psychologists consider these qualities to be developmental assets that may also serve as protective factors for adolescents, mitigating the negative effect of less-than-healthy home and community environments (Galassi & Akos, 2007; Terjesen et al., 2004; Yeager & Bundick, 2009). Studies conducted in the United States and internationally with diverse adolescent samples reinforce these conclusions (Brassai, Piko, & Steger, 2011; Kiang & Fuligni, 2010; Proctor, Linley, & Maltby, 2010; Shek, 2012).
Despite progress made in understanding the key markers of thriving, the need remains for psychometrically sound instrumentation to document these trends with youth. With such an appraisal tool, the resulting information could assist school counselors to better determine which activities should be used in comprehensive school counseling programs (e.g., American School Counselor Association’s [ASCA], 2012, National Model) to facilitate development (e.g., spiritual modeling; Lerner, 2008).
Definitional Considerations
Distinguishing spirituality from religiosity in the literature can be problematical for counseling researchers and practitioners. As noted in various reviews, “religiosity,” “religiousness,” and “spirituality” are often used interchangeably, relying more on specific religious expressions rather than the conceptually different features of human spirituality (Hall, Dixon, & Mauzey, 2004; Sink & Hyun, 2012). In their consideration of empathy, religiosity, and spirituality as related constructs, Markstrom, Huey, Stiles, and Krause (2010) differentiated religiosity from spirituality. Generally, the former term is defined in light of one’s level of commitment to a religious institution(s), adherence to established doctrines and devotion to the higher power(s), and participation in the rituals and practices related to the particular religious system. In contrast, these authors cast spirituality as a broader construct that includes a search for meaning and purpose in life. Regardless of how one conceptualizes and operationalizes these terms, spirituality or religious feelings are generally considered to be intrinsic to all persons (Roehlkepartain, 2012; Sink & Hyun, 2012).
In their recent review of the pertinent counseling, psychological, and related literature, Sink and Hyun (2012) created a definitional taxonomy. First, the “conventional” view suggests that spirituality is inextricably tied to religious notions; one cannot be “truly” spiritual without religion. A lesser held stance envisions spirituality as a “purely” naturalistic, nonreligious, and non-supernatural phenomenon inherent to all human life. A third perspective conceptualizes spirituality as a social–psychological construct that may or may not involve religious elements. Moreover, spirituality in this light encompasses those human experiences and activities allied to rich meaning-making (e.g., connecting to nature, developing close relationships with others, participating in creating or enjoying arts) and making sense of one’s world. The current study used this third alternative by conceptualizing spirituality as an overlapping yet distinct construct from religion (Boynton, 2011; Markstrom et al., 2010; Roehlkepartain, 2012; Sink & Devlin, 2011; Watts, 2011).
To summarize, although there is an the inherent inconsistency between definitions which purport to be about the here and now and yet include other worldliness or higher beings, the operational definition of spirituality used throughout this article involves students’ beliefs, feelings, and actions related to their world and their place in it. Spirituality, as such, involves formal (i.e., religious practices) and informal ways in which students make meaning; seek purpose in life; experience personal transcendence; connect with themselves, their surroundings, others, and a higher power(s); and so on. This articulation of spirituality is readily adaptable to and flexible in varying educational contexts.
Adolescent Spirituality and Assessment Issues
The value of addressing spirituality as a supportive factor in school-related counseling settings is well documented (Dobmeier, 2011; Park & Peterson, 2008; Sink & Devlin, 2011; Sink & Hyun, 2012). Similar to other developmental domains (cognition, emotional, social), spirituality, as defined above, is an inherent human quality and tends to be important to most North American students (Smith & Denton, 2005), including those from minority cultures (e.g., African American, Asian American, Hispanic, Latino/a; Yeh, Borrero, & Shea, 2011). As such, issues related to student spirituality should be actively considered by school counselors (Dobmeier, 2011; Lambie, Davis, & Miller, 2008; Sink & Devlin, 2011). However, Dobmeier (2011) reported that many school counselors remain hesitant to acknowledge or use student spirituality.
More specifically, the major task of adolescence is to forge an identity that merges one’s beliefs, values, and goals into an understanding that can be used to inform various life decisions, including those that are spiritual (Yeager & Bundick, 2009). Although this undertaking is generally achieved in a positive manner, for many adolescents the identity development process presents significant challenges (Eccles et al., 1993; Yonker et al., 2012). The literature clearly documents that students are able to more effectively navigate these issues if they receive meaningful assistance from their school counselors. In particular, Seo et al. (2011) catalogued the numerous advantages of providing students with ethically and culturally sensitive support for spiritual development through individual and group counseling and other related activities and services.
Empirical research demonstrates that characteristics of a healthy spirituality offer numerous benefits to schoolchildren as well as a resource for families who face life-threatening illnesses, abuse, or other traumatic events (Mahoney, 2010). Higher levels of spiritual/religious involvement and resiliency, for instance, are positively associated with overall well-being, prosocial behavior, coping skills, and self-regulatory skills (Raftopoulos & Bates, 2011). A healthy spirituality is also considered to be a developmental strength or asset for adolescents and young adults (Balsano, Phelps, Theokas, Lerner, & Lerner, 2009; Dobmeier, 2011; Sink & Hyun, 2012), including culturally diverse students and their families (Yeh et al., 2011). However, certain manifestations of spirituality/religiosity can lead to less than optimal adolescent development and potentially negative long-term outcomes (Butler-Barnes, Williams, & Chavous, 2012; Carlozzi et al., 2010). In spite of these findings, there continues to be a relative lack of attention to the developmental constructs associated with adolescent spirituality in the school-based counseling literature. DeHaan et al. (2011) concluded that when adolescent spirituality is addressed in the psychological and educational literature, discussions are limited by a lack of clarity in conceptualizing spirituality as well as limitations in research methodology and construct operationalization.
Furthermore, psychometrically sound measurement tools should be developed to more clearly apprehend the variety of students’ developmental assets, including qualities associated with a healthy spirituality (Briggs, Akos, Czyszczon, & Eldridge, 2011; Richards, Bartz, & O’Grady, 2009). Recently, Sink and Hyun (2012) summarized the various qualitative and quantitative options available to counselors. For example, they mentioned the preliminary validation work conducted on the LPI (Sink, 2009; Seo & Sink, 2010) with high school students. The LPI is a user-friendly self-report inventory explicitly designed to quantitatively appraise various core dimensions of human flourishing and spiritual well-being. In Korea, Seo et al. (2011) conducted a major cross-cultural validation study of the LPI, analyzing its psychometric properties with nearly 1,200 high school students. The exploratory factor analysis resulted in the identification of three reliable latent dimensions or scales: (a) Present-Centeredness (or mindfulness), (b) Connection with a Higher Power, and (c) Meaning-Making. The authors concluded that if school-based counseling professionals possessed a valid and reliable tool such as the LPI for measuring core dimensions of spirituality, they would be better equipped to ethically consider this developmental domain with high school students. The investigators recommended that additional exploratory analyses and cross-validation research were needed to further establish the LPI’s utility with American and Korean youth. The current psychometric study was developed to address this suggestion.
Method
Participants and Sampling
Total Sample
Self-report adolescent LPI (English version) data (N = 1,003) were purposely collected from two comprehensive high schools (Grades 9–12) in the Puget Sound region of Washington state (exploratory sample) and two comprehensive high schools in Western Michigan (cross-validation sample). Only valid participant data (N = 948) from each region (Washington, n = 543; Michigan, n = 405) were used in the statistical analyses. About 9.6% of the information was considered unusable for a variety of reasons, including incomplete surveys, atypical response patterns, and unreadable responses.
Whereas within-state participant demographic data were relatively similar, between-state data generally were disparate on the socioeconomic status (estimated by the percentage of students receiving a free or reduced fee meal) and ethnicity variables. By state, the percentage of participating students who received a free or reduced lunch varied significantly (Washington = 52.51%, SD = 2.93%; Michigan = 19.49%, SD = 3.50%). The percentages of female respondents (Washington = 50.3%; Michigan = 54.5%) were comparable across states. In contrast, the proportion of minority students varied substantially (Washington state ≅ 58% non-White; Michigan ≅ 18% non-White). The mean ages for total Washington (15.82, SD = 1.27) and Michigan (15.82, SD = 1.03) samples were identical. The demographic data are further disaggregated by state and school and summarized below.
Washington
At the time of the study (2010), the first participating high school—a Western Washington suburban high school—had a census of 1,553 students (66% European American/White; 49.2% received a free or reduced lunch). From this population, 238 students (25.1% of the total sample) volunteered to participate. Of the sample, approximately 52.5% were female and these respondents’ ages (M = 15.80, SD = 1.25) ranged from 14 (15.1%) to 20 (1.0%) years. The following ethnicities were represented: 48.7% European American/White; 16.4% Multiethnic; 8.4% Asian American; 5.9% Hispanic; 2.9% African American; and, approximately 17.7% other or did not specify. With 9.3% missing data, the grade-level distribution was comparable: Grade 9 = 24.8%; Grade 10 = 23.9%; Grade 11 = 21.8%; and Grade 12 = 20.2%.
The second participating high school is located in an urban area of Western Washington. Of the 1,510 students attending this school (55.1% received free or reduced lunch), 305 (32.2% of the total sample) participated. Forty-seven percent were female and respondents’ ages (M = 15.84, SD = 1.29) ranged from 14 (15.5%) to 19 (0.4%). The following ethnicities were represented: 33.8% European American/White; 21.6% Hispanic; 13.8% Multiethnic; 13.4% Asian American; 7.2% African American; 6.2% Pacific Islander; 2.3% Native American, and 1.7% other or did not specify. Grade-level distribution for this school’s respondents was largely equivalent: Grade 9 = 28.5%; Grade 10 = 26.2%; Grade 11= 21.3%; and Grade 12 = 17.7% (6.3% missing data).
Michigan
Of the two participating high schools from Western Michigan, 202 respondents (21.3% of the total study body [N = 593; 91% European American/White; 23% received free or reduced lunch]) were enrolled in a rural high school. Nearly 61% of the sample was female and 85.1% self-identified as European American/White, with 5.9% Multiethnic; 3.0% Hispanic; 1.0% African American; and approximately 5.0% other or not specified. The mean participant age was 16.01 years (SD = 1.10; range = 14 to 18 years). In this rural school, 27.7%, 22.8%, 28.2%, and 13.4% of the respondents were in Grades 9, 10, 11, and 12, respectively (7.9% missing data).
The second participating Western Michigan high school is located in a middle to upper-middle suburban community. Of the 1,145 students enrolled at the time of the study (92% European American/White; 16% received free or reduced lunch), 203 students (21.4% of the total sample) participated. Of these respondents, 48.6% were female and approximately three fourths (76.4%) were White/European American, with 9.9% Multi-ethnic; 5.5% Hispanic; 4.4% African American; and approximately 3.8% other or not specified. The mean participant age was 15.62 (SD = .92; range = 14 to 18 years). The grade-level distribution for these respondents was skewed toward the freshman year: Grade 9 = 47.8%; Grade 10 = 28.1%; Grade 11 = 20.2%; and Grade 12 = .5% (3.4% missing data).
Instrumentation
Participants were assessed on the English version of the LPI (see Sink, 2009; Seo et al., 2011, for details). As summarized here, the LPI-E was rigorously developed using established psychometric processes and procedures to construct a reliable and valid instrument (Dimitrov, 2012; Nunnally & Bernstein, 1994). The self-report LPI-E is a substantially modified version of Ingersoll’s (1998) Spiritual Wellness Inventory (SWI), an established survey designed for adult respondents. Starting with the SWI’s items and scales, the initial LPI (English and Korean versions) comprised 55 statements representing 10 underlying dimensions (five items per scale). These versions of the LPI also originally included the SWI’s 5-item Social Desirability or “lie” scale. The 10 underlying dimensions included the following concepts: (a) Conception of Divinity (the extent of the individual’s image or experience of divinity), (b) Meaning (the degree to which the individual senses that life has purpose and is worth living), (c) Connectedness (the level to which there is a sense of spiritual belonging with other people, the Divine, or elements in the environment), (d) Present-Centeredness (the level of a capacity to remain in the moment without worrying about the past or the future), (e) Mystery (the level of a capacity for awe and wonder as one deals with ambiguity, the unexplained, and the uncertainty of life), (f) Ritual (the degree of the experience of a proactive practice that promotes present-centeredness, connection with others or the Divine, and the forging of meaning in the face of life’s circumstances), (g) Hope (the extent of a sense of optimism that allows one to cope with setbacks or misfortune), (h) Forgiveness (the level of the individual’s willingness to give and accept forgiveness), (i) Knowledge/Learning (the extent to which there is an interest in building the knowledge of one’s self and of things perceived as external to the self, which may or may not include academic pursuits), and (j) Spiritual Freedom (the level of a capacity for play, immersing oneself in life, and losing oneself in the moment).
With permission from its author, the SWI was modified by Sink (2009) for use with adolescents in public high schools. Given that various items and scales were viewed as potentially inappropriate for adolescent respondents attending secular schools, about half of the SWI items were slightly reworded in an attempt to be more relevant to adolescents of different spiritual traditions. To further guide potential changes and improve face and content validity, the SWI items were piloted to a mixed group of 20 students attending the urban Washington state high school and three school counselors. The pilot sample reviewed the applicability of the SWI’s 55 items for use with public high school students. Survey directions, item content, and scaling issues (wording, readability, etc.) were scrutinized.
Based on consistent feedback, potentially sensitive words like “God” were changed to “Higher Power” and the response descriptors never and always were also removed. To simplify item scaling and scoring, the SWI’s original 8-point Likert-type scale was modified to a forced-choice 4-point scale ranging from 1 (strongly disagree) to 4 (strongly agree). Ingersoll’s (1998) directions for scoring the SWI were extended to the LPI, where the negatively worded items were reversed-coded or scored. Finally, to avoid counselors’ stated hesitation to administer a survey with the words “spiritual wellness” in the title, the revised SWI was renamed “Life Perspectives Inventory.”
Procedures
Washington
Because of their relatively similar student demographics, two high schools from the Puget Sound region of Washington State were purposefully selected to participate in the research project. The lead school counselor in each participating high school (a) obtained parental consent from a stratified random and largely representative sample of 9th through 12th graders who served as the target sample and (b) coordinated the confidential distribution and collection of the surveys. Subsequently, the teachers group administered the 55-item LPI to students during an advisory period within a 1-month time period between December 2009 and January 2010. Four parents removed their child from the study sample. The response rate in both Washington schools was estimated to be more than 85%.
Michigan
Using convenience sampling, to obtain an adequate sample size, the researchers conducted two rounds of data collection at the rural high school. All surveys were group-administered during the advisory period by the teachers. During the first round of data collection, 12 advisory groups (three at each of the four grade levels) were randomly selected by the lead school counselor. All but three students received parental consent yielding a response rate of 63.9% (140 of 219).
During the second round, six different advisory groups from the first round (two from each of the three grades present in the school at the time of the administration) were randomly selected by the school counselor. Because of testing date (late spring of 2010), seniors were unavailable. The student response rate was 54.9% (62 of 113). The total response rate for both rounds was 202 of 332 (60.8%).
The suburban high school had 15 advisory groups at 9th grade, 13 at 10th grade, 13 at 11th grade, and 14 at 12th grade. Thirteen student advisory sections were randomly selected by a school counselor. After parental consent was obtained for all but 14 students, data were collected by the advisory teachers with a student response rate of 81.5% (203 of 249). The overall response rate for both Michigan schools was 69.7% (405 of 581).
Statistical Analyses
Given that exploratory factor analysis (EFA) is a valuable heuristic strategy to model specification before cross-validating the derived factor structure with confirmatory factor analysis (CFA; Gerbing & Hamilton, 2009), an EFA was first conducted on the Washington high school student data to address Research Questions 1 and 2 (Phase 1). Following expert recommendations on best statistical practice, the principal axis factoring (PAF) method was used as the data condensation procedure (Fabrigar &Wegener, 2012; Nunnally & Bernstein, 1994; Tabachnick & Fidell, 2013). PAF is especially well-suited for determining potential latent constructs in the data set and provides a more accurate estimate of the item correlations. Based on parallel analysis, the magnitude of factor eigenvalues, percentage of variance explained by each factor, and scree plot results, the appropriate number of factors was rotated to achieve simple structure. Because self-reported attitudinal survey data commonly generate intercorrelated factors, the direct oblimin (oblique) rotation method was deployed starting with the delta set at 0.0. Factors were named based on the conceptual similarity of the items marking them (threshold ≥ .35).
To answer Research Question 3 (Phase 2), and following guidelines discussed in pertinent articles related to structural equation modeling and assessing measurement models (Hair, Black, Babin, & Anderson, 2010; Pett, Lackey, & Sullivan, 2003; Schreiber, Nora, Stage, Barlow, & King, 2006; Weston & Gore, 2006), a first-order CFA was conducted using IBM SPSS AMOS (version 19; see Byrne, 2010, for details) examining factorial validity of LPI-E. CFA tests whether indicators load on specific latent variables as hypothesized in the a priori or prespecified model. In other words, using model goodness of fit indices (Marsh, Hau, & Grayson, 2005), CFA examines how well the proposed factor model explains the observed pattern of sample correlations or covariances in a different sample.
Results
The findings are presented according to the two phases of the investigation and related research questions.
Phase 1
Exploratory Factor Analysis
To determine the LPI-E dimensionality (Research Question 1), a PAF was conducted using Washington state high school student data (N = 543). Prior to this analysis, trends related to missing data and outliers were examined. On average, approximately 2.5% of the respondents did not complete one item or more. Following the suggestions from authorities in factor analysis research (Byrne, 2010; Fabrigar & Wegener, 2012; Tabachnick & Fidell, 2013), those cases where more than five scores were absent, the entire case was removed from the data set, thus reducing the total sample from 543 to 531 (97.7% of data retained). Seven cases from this reduced data set had seemingly one random missing score on a particular item and were replaced by the item’s grand mean. Outlier analysis was also conducted, finding only minor issues with a few items. The 55-item LPI item means varied approximately from 2.0 to 3.4 (grand M = 2.31). Skewness and kurtosis estimates were largely within an acceptable range (within ±1.0).
The suitability of the intercorrelation matrix for factor analysis was demonstrated by low-to-moderately high interitem correlations (.24 to.67), a strong KMO (.88), and a significant Bartlett’s test of sphericity (χ2[351] = 3612.30, p < .001). An initial PAF was computed, extracting 16 factors with eigenvalues greater than 1.0, accounting for 42.05% of the variance in the intercorrelation matrix. Unrotated eigenvalues were as follows: λ1 = 5.96 (22.06%), λ2 = 2.59 (9.59%), λ3 = 17.8 (6.66%), and λ4 = 1.24 (4.60%). Congruent with the Korean version of the LPI (Seo et al., 2011), the 55-item LPI-E based on the 10-scale SWI generated substantially fewer latent dimensions than first hypothesized by Ingersoll (1998).
After reviewing the scree plot, initial loading plots, percentage of variance accounted for by each extracted factor, and parallel analysis results (55 variables, N = 531, data sets = 100, 95%), a 4-factor model seemed most parsimonious. Assuming that these potential dimensions were at least modestly intercorrelated, four factors were obliquely rotated. Postrotation eigenvalues for these four factors were as follows: λ1 = 8.12 (14.91%), λ2 = 3.17 (5.77%), λ3 = 3.11 (5.65%), and λ4 = 2.04 (3.72%). The resulting four factors had eigenvalues greater than 2.0. Simple structure was achieved with 27 items comprising four latent dimensions (see Table 1). Factors 1 to 4 were labeled Optimist Orientation (OO), Connection with Divine (CD), Purpose-in-Life/Meaning-Making (PM), and Active Spirituality (AS), respectively. OO’s 14 items (scores range from 14 to 56) reflect an adolescent’s optimism outlook or focus. The four items (scores range from 4 to 16) comprising the CD factor estimate a sense of connection with a Higher Power. The five items comprising the PM factor (scores range from 5 to 20) can be loosely seen as one’s search for life’s meaning and purpose. The four items (scores range from 4 to 16) loading on AS generally measure a level of interest in spiritual practices. The intercorrelations among factors were negligible, ranging from −.06 to .36 (Mr = |.20|, mean shared variance 4%). Specific scoring and scale interpretation are available from the principal author.
27-Item PAF Structure Matrix (Oblimin Rotation) for Washington State Data.

Note. N = 531; R = reversed coded item; Factor 1 Optimistic Outlook (OO), Factor 2 Connection with Divine (CD), Factor 3 Purpose and Meaning (PM), Factor 4 Active Spirituality (AS); Determinant = .001; KMO Measure of Sampling Adequacy = .88; Bartlett’s Test of Sphericity = χ2(351) = 3612.30, p = .000.
Follow-Up Item and Reliability Analyses
To respond to Research Question 2, reliability estimates for the derived factors were examined. Similar to the original, nonfactor analyzed 55-question LPI, the 27 item means and standard deviations were largely similar and item kurtosis and skewness indices were within an acceptable range (less than ±1.0; see Table 2). Factor scores as well as reliability estimates for the four derived factors were calculated. The Cronbach alpha coefficients for the four factors were as follows: OOα = .83 (14 items, interitem Mr = .26, range = .12 to .51; item-scale total Mr = .46); CDα = .75 (4 items, interitem Mr = .43, range = .33 to .55; item-scale total Mr = .54); PMα = .64 (5 items, interitem Mr = .29, range = .13 to .41; item-scale total Mr = .39); and ASα = .70 (4 items, interitem Mr = .43, range = .25 to .54; item-scale total Mr = .49). The magnitudes of the alpha coefficients were largely satisfactory considering the LPI is a subjective attitudinal survey administered to changeable adolescents (Nunnally & Bernstein, 1994).
Final Four-Factor 27-Item LPI Descriptive Statistics for Western Washington (N = 531) and Michigan (N = 405) Samples.
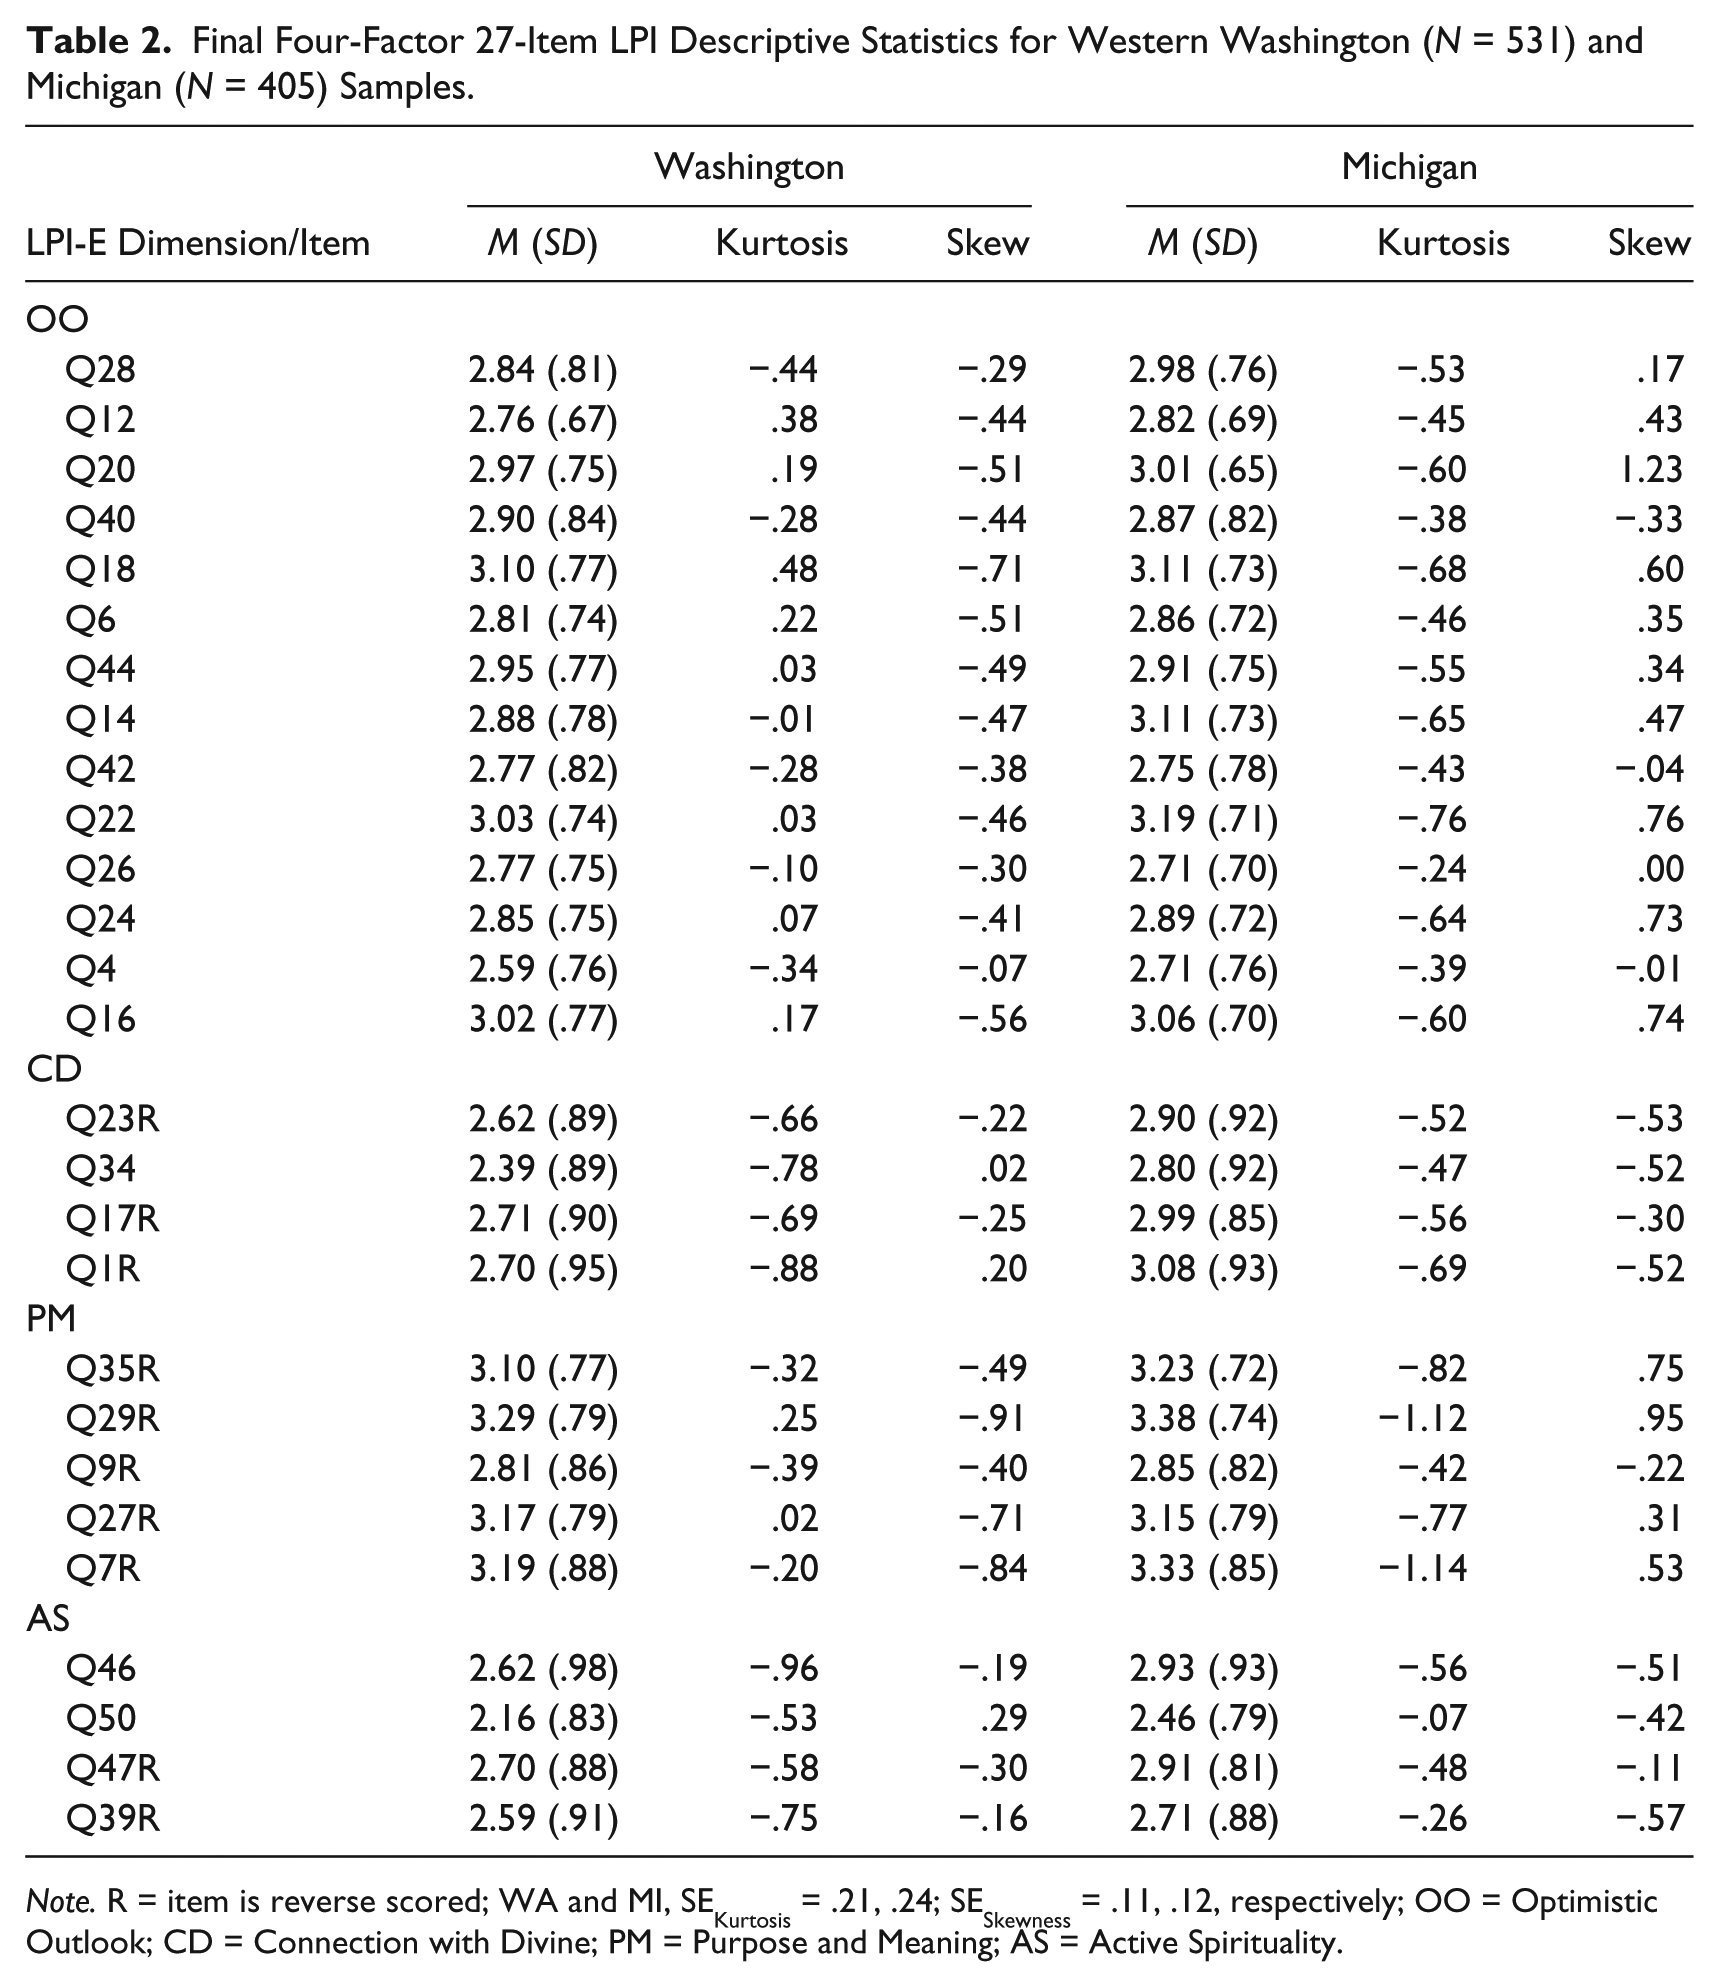
Note. R = item is reverse scored; WA and MI, SEKurtosis = .21, .24; SESkewness = .11, .12, respectively; OO = Optimistic Outlook; CD = Connection with Divine; PM = Purpose and Meaning; AS = Active Spirituality.
Stability coefficients (approximately 2-week test–retest interval; Mr = .77) were calculated for each factor on a small subset of the Washington high school students (n = 26). The coefficients for PM (.65) and OO (.71) were lower than those for AS (.84) and CD (.90), suggesting that adolescent mood may affect the first two scale scores more than the latter two. Overall, three of four coefficients exceeded the threshold of .70 for good stability (Litwin, 1995). Subsequently, to cross-validate the derived factor structure with another adolescent sample, a CFA was computed with a group of Michigan high school students.
Phase 2
Confirmatory Factor Analysis
In an attempt to cross-validate (Research Question 3) the 4-factor hypothesized or baseline model (27-item LPI) revealed in Phase 1, a CFA using the maximum likelihood (ML) estimation method was computed on the Michigan data set. ML was selected over other options, because it is robust to moderate violations of the normality assumption (Weston & Gore, 2006). As reported above, the Michigan student data set was biased toward middle income, European American respondents. Descriptive statistics for the final 4-factor 27-item LPI-E are presented in Table 2.
The data assumptions related to the CFA were examined using accepted procedures and standards (Weston & Gore, 2006). First, the sample size was satisfactory according to general guidelines. Second, multicollinearity was not an issue; bivariate item correlations were generally in the low-moderate to high-moderate range, with no correlation exceeding .67. Third, after examining the pattern of Mahalanobis d2 indices, outliers appeared to be nonproblematic and the data set showed no signs of extreme kurtosis or skewness. Substantial missing data can be problematic when conducting CFA; as such, as a way to double check the impact of this issue on the results, a CFA was first computed on the data set, where the few missing item scores were recoded using item means. The assumption made in this case was that the pattern of missing survey data was largely random, so item means could be substituted. Based on Enders’s (2010) assertion that ML estimation procedure used in structural equation modeling software can readily handle missing data, a second CFA iteration was computed on the data set without data substitution. CFA results generated from the two methods of handling missing data were virtually identical.
According to conventional guidelines for assessing model specification, the CFA results produced an adequate but less than optimal fit (Byrne, 2010; Schreiber et al., 2006). Figure 1 depicts the specified measurement model with pertinent standardized path coefficients and covariances between exogenous and endogenous variables. The following recommended goodness-of-fit indices were generated: χ2 = 594.94, df = 345, p < .001; log likelihood ratio χ2(CMIN/DF) = 1.83, p < .001; comparative fix index (CFI) = .92; root mean square error of approximation (RMSEA) = .045 (90% CI = .04–.05). The derived Hoelter’s N statistic was 263 (p < .01). Standardized covariance residuals were checked with Q-plots (Dimitrov, 2012). These two analyses provided further evidence that the model was adequately specified. To potentially enhance the initial model, AMOS’s modification indices were considered. Improvements in the goodness-of-fit indices were marginal; as a result, the original CFA model was retained.

Confirmatory factor analysis path model using Michigan data set (e = error).
Follow-Up Item and Reliability Analyses
As with the Washington sample, item and reliability analyses were conducted on the Michigan data set. After computing factor scores for each of the LPI-E’s four dimensions, 27 item means and standard deviations were largely similar, and item kurtosis and skewness indices were mostly well within an acceptable range (within ±1.0; see Table 2). Cronbach alphas for the four factors were as follows: OOα = .83 (14 items, interitem rs range = .04 to .45; item-scale total Mr = .46), CDα = .81 (4 items, interitem rs range = .47 to .63; item-scale total Mr = .61), PMα = .64 (5 items, interitem rs range = .14 to .43; item-scale total Mr = .40), and ASα = .68 (4 items, interitem rs range = .19 to .57; item-scale total Mr = .47). In general, these alpha coefficients were similar to those found with the Washington sample, again suggesting that OO and CD are more internally consistent dimensions than PM and AS.
Two-week test–retest stability coefficients (Mr = .73) were calculated for each dimension with 26 of the Michigan high school students (suburban location; 50% female; Mage = 16.7, SDage = .86; 48.8% White, 30.2% Hispanic, multi-ethnic = 11.6%, Black 9.3%; Grade 11 = 44.19%, Grade 12 = 46.5%). Perhaps due in part to a restriction in range involving age and grade level, two coefficients were smaller than the .70 (Litwin, 1995) and .80 (Kline, 1993) thresholds for adequate test–retest reliability: PM (.65), OO (.52), AS (.84), and CD (.90).
In summary, during Phase 1 of the current investigation, item analyses, principal axis factoring, and reliability analyses were conducted on the Washington state data set. The findings suggest that the 4-dimension, 27-item LPI-E has largely adequate factorial validity and internal consistency (Nunnally & Bernstein, 1994) and stability (Litwin, 1995) for a youth self-report attitudinal survey. Phase 2 included a CFA of the 4-factor measurement or baseline model using the data gathered from Michigan high school students. Results indicate that the specified measurement model was adequately confirmed. Follow-up reliability analyses conducted on the 4-factor LPI with Michigan students generally showed passable internal consistency and stability reliability coefficients.
Discussion
As alluded to previously, schools are a vital social context to promote the healthy personal, social, spiritual, and moral development of youth (Battistich, 2010; De Souza, 2006). Accentuating what leading school counselor educators have maintained (Briggs et al., 2011; Dobmeier, 2011; Lambie et al., 2008; Yeh et al., 2011), Strike (2010) posited that for schools to be more inclusive and responsive communities, making room for students and their families from diverse cultures and ethnicities, administrators must reject the notion that schooling should be neutral on issues of personal–social values. Effective secondary schools tend to be distinguished by their shared moral commitments that support a “spiritual” ethos—one that emphasizes the dignity of all students, demonstrates a caring ethic (Eccles & Roeser, 2010), and nurtures the inner lives of children and teachers (Lantieri, 2002). This study was designed to validate a measure that could be used to appraise student characteristics associated with these educational ends.
Supporting initial psychometric work on the English (Seo & Sink, 2010; Sink, 2009) and, in part, the Korean (Seo et al., 2011) language versions of the Life Perspectives Inventory (LPI-K), the current study provided sufficient evidence for the LPI-E’s factorial validity as well as its internal consistency and stability with a large, diverse sample of Washington state high school students. Four dimensions were found to produce simple structure, each reflecting what psychologists associate with important aspects of a flourishing life and spirituality in youth (Eaude, 2009; Huebner, Suldo, Smith, & McKnight, 2004). Coupled with these findings, results from Phase 2 generated further psychometric support for the LPI’s factorial validity and scale reliability, and thus for the questionnaire’s overall construct validity. It should be noted, however, that the derived factor structure used as the CFA measurement model generated only adequate comparative fit indices with the Michigan data set. This imprecise replication of the factor structure was not entirely unexpected given the substantial diversity in the Washington sample as compared with the more homogeneous nature of the Michigan student group. In summary, assuming appropriate testing safeguards are in place, the results indicate that the LPI-E can be administered to diverse and homogeneous student groups attending public high schools.
Implications for Practice
Recent evidence suggests that secondary school counselors resonate with characteristics associated with spirituality and religion, particularly as they help provide personal meaning and direction for their own lives and careers (Sumerlin & Littrell, 2011). As such, it is not too much of a stretch to assume that counselors also understand the value of spirituality in their students’ lives. As a method to better tap into salient features of student spirituality, the LPI is a useful tool to include within high school counseling practice.
The LPI was devised for high school counselors as they effectively and holistically address their students’ sense of well-being and spirituality (e.g., optimism, meaning-making, seeking meaning and purpose in life, nonreligious manifestation of spirituality; e.g., Briggs et al., 2011; Dobmeier, 2011). Operating from a comprehensive school counseling framework (e.g., ASCA [2012] National Model), LPI results, for instance, could inform the planning and implementation of counseling-related activities aimed at social–emotional and career development (Kosine, Steger, & Duncan, 2008; Lantieri, 2002). There are multiple resources to consult on how to create nonjudgmental classroom guidance as well as individual and group counseling experiences for adolescents to explore meaning and satisfaction in life-related issues (see, e.g., Kosine et al., 2008; Sink & Devlin, 2011).
To enhance positive identity development, adolescents benefit from self-reflection and contemplation of meaningful topics (Luyckx et al., 2008). Again by using the LPI results as a conversation starter, students and their high school counselors have interesting information to explore. As Noddings (Halford, 1999) has suggested that all educators do in their schools, counselors can gently encourage self-reflection/introspection activities within their individual and group work, and facilitate thought-provoking large group discussions around pertinent LPI dimensions, including students’ views on personal well-being, future hopefulness, meaning-making, and so on. By taking a strengths-based perspective (Galassi & Akos, 2007), school counselors are better equipped to inspire student deliberation and awareness of spirituality as a potential developmental asset and protective factor that also enhances youth resiliency and long-term thriving (Brassai et al., 2011; Terjesen et al., 2004; Yeh et al., 2011).
Finally, caution is warranted when interpreting and using adolescent LPI-E scores for school counseling practice. The measure was explicitly devised as a self-report attitudinal indicator. No specific scale criteria were established to indicate when students may possess a spiritual asset (strength or resource) or deficiency, nor is there a total score. Although higher scores on LPI-E dimensions are preferable, suggesting spiritual health, very low self-ratings on the Optimistic Outlook (OO) and Purpose-in-Life and Meaning-Making (PM) dimensions might be a source for deeper student–counselor dialogue and helpful for guiding activities that target these areas. In short, LPI-E student information carefully and ethically interpreted can inform school counseling-related practices.
Limitations and Suggestions for Further Research
As with all studies conducted in dynamic and complex school environments, self-report survey research with children and youth is inherently problematic (Nunnally & Bernstein, 1994). For example, in this study, although the data collection procedures were prescribed and monitored, they still varied substantially from school to school, allowing for error variance to increase across the two samples. Although the issues of sampling and sample size continue to be contested in the SEM/CFA literature (e.g., MacCallum & Austin, 2000), it recommended that a subsequent study include more than 500 high school students. There are multiple factors that seriously influence the magnitude of stability coefficients (same-form retest) of attitudinal measures. On the more conservative side, Kline (1993) recommended that the short-term equivalence for all scales should be at least .80 for a sample of at least 100 adult respondents; however, Litwin (1995) suggested .70 is the threshold for good stability. The test–retest coefficients derived for the Washington sample (Mr = .77) approached the more stringent criterion; the Michigan coefficients (Mr = .73) did not. Restriction in range due to sampling error of the latter participant group probably contributed to this finding.
Subsequent investigations need to attend to, among others, these sampling-related issues (e.g., increase sample representativeness and size). In addition, as Marsh (2009) suggested when establishing the psychometric properties of an instrument, factor invariance tests should be conducted on a new and large sample of adolescents examining how this measure operates in a similar fashion across known groups (i.e., gender and schools/regions). To further establish the LPI’s construct validity, a multitrait–multimethod matrix approach is the logical next step for LPI researchers. The questionnaire’s applicability for students attending faith-based high schools and the receptivity of public school parents to nonreligious spirituality are open questions. Finally, the overall effect of fewer 12th-grade Michigan respondents on the CFA results is not clear. Follow-up psychometric studies should include greater numbers of late adolescents.
Conclusion
During the past few decades, research on the personal and contextual attributes that influence healthy adolescent development has been burgeoning. However, there remains a paucity of large-scale empirical studies that investigate variables related to existential and spiritual well-being in public high school adolescents from diverse ethnicities and backgrounds. Self-report instrumentation used in past research has limited psychometric data supporting its deployment with high school students. The current investigation adds to the professional school counseling knowledge base by documenting the reliability and validity of the LPI-E, a user-friendly, nonthreatening, self-report screening measure designed to assess important qualities of adolescent spirituality.
Footnotes
Declaration of Conflicting Interests
The author(s) declared no potential conflicts of interest with respect to the research, authorship, and/or publication of this article.
Funding
The author(s) received no financial support for the research, authorship, and/or publication of this article.