
Abstract
Researchers analyzed data from elementary teachers (N = 233) to further establish the psychometric soundness of the Teacher My Class Inventory–Short Form. Supporting previous psychometric research, confirmatory factor analyses findings supported the factorial validity of the hypothesized five-factor solution. Internal reliability estimates were satisfactory for an attitudinal measure. Implications for practice are briefly discussed.
This article reviews the findings from a multilevel confirmatory factor analysis (MCFA) assessing the structural validity of the Teacher My Class Inventory–Short Form (TMCI-SF, Sink & Spencer, 2007). A previous study reported on the psychometric properties of the TMCI-SF, producing a moderately reliable and valid five-dimension model (i.e., Satisfaction, Peer Relations, Competitiveness, Difficulty, and School Counselor Impact), which corresponds to the constructs of the instrument’s six scales (Sink & Spencer, 2007). Extending these results, researchers sought to further establish the psychometric soundness of this measure with a new sample of teachers located in the north and southeast regions of Florida.
The TMCI-SF is designed to estimate elementary teachers’ perceptions of their classroom climate. Classroom climate refers to the nature of the learning environment, defined by the physical and emotional safety of the space, as well as the quality of the relationships among teachers and students (Adelman & Taylor, 2002). Positive classroom climates have been linked to student academic, behavioral, and career outcomes (Adelman & Taylor, 2002; Barth, Dunlap, Dane, Lochman, & Wells, 2004; Fraser & Walberg, 2006; Jennings & Greenberg, 2009; Reyes, Brackett, Rivers, White, & Salovey, 2012; Wilson, Pianta, & Stuhlman, 2007). Jennings and Greenberg (2009) described the optimal classroom climate as one that involves respectful communication and expression of emotions, appropriate time on task and smooth transitions, differentiated instruction to meet student needs, and fewer incidents of disruptive behaviors.
Need for Sound Elementary-Level Psychometric Classroom Climate Measures
Bronfenbrenner’s work in the 1970s was instrumental in the setting the stage for the study of classroom climates, suggesting the power various sociocultural systems (family, teachers, school, neighborhood) can have on a person’s developmental process (Bronfenbrenner, 1979). Extensive research conducted by Rudolf Moos (1979), in particular his development of the Classroom Environment Scale, also sought to assess the classroom environment. Moos based his measurement on three dimensions: the relationship dimension, personal development dimension, and system maintenance and change dimension. The majority of climate research since that time has investigated constructs related to the physical setting, psychological environment, teacher characteristics and behaviors, and interactions among students themselves (Fraser, 1998, 2002; La Paro & Pianta, 2003). Surveys, observations, interviews, and critical data elements (i.e., grades, attendance, discipline referrals, standardized test scores) have all been used to assess positive and negative student outcomes related to classroom climate. That being said, there remains a need for more rigorous, psychometrically sound instrumentation to effectively measure the quality of classroom learning environments (La Paro, Pianta, & Stuhlman, 2004). Regrettably, informal methods of measuring classroom climate tend to be highly subjective and use less than rigorous data collection procedures. Therefore, using sound psychometric climate surveys contributes to the fairness, accuracy, and defensibility of performance evaluation systems (National School Climate Council, 2007). Moreover, instruments need to be theoretically strong, vigorously field-tested, measure target populations accurately, be easy to administer and score, and meet the needs of each particular school community (Faster & Lopez, 2013).
Patrick, Kaplan, and Ryan (2011) noted numerous classroom climate measures exist for assessing a variety of classroom dimensions perceived by students in preK–12 settings; however, very few are specifically designed for elementary level classrooms and even fewer take into account the teacher’s perception of the learning environment. One measure, TMCI-SF (Sink & Spencer, 2007) was developed to assess teachers’ perceptions of their classroom climate. Sink and Spencer (2007) conducted a study to assess the initial psychometric quality (i.e., underlying factor structure and determine reliability and validity estimates) of the TMCI-SF using data from K–6 teachers (N = 303) employed at 22 urban elementary schools across western Washington. The sample included 257 (84.8%) females, 36 (11.9%) males, and 10 (3.3%) teachers who did not report their gender. The sample also reported varying levels of teaching experience, ranging from first year (n = 30, 10%), 1.5 to 5 years (n = 98, 44%), 5.5 to 10 years (n = 42, 14%), 10 to 20 years (n = 78, 26%), to more than 20 years (n = 41, 13.5%), and 14 (4.5%) individuals who did not provide their years of experience. The majority of the teachers were Caucasian (n = 230, 75.9%), 27 (8.9%) identified as minority, and 46 (15.2%) did not report their ethnicity.
The underlying dimensionality and factorial validity of the original, 30-item TMCI-SF were initially examined through principal component analysis, using the maximum likelihood factor analysis procedure, and by a confirmatory factor analysis (CFA). The researchers reported the means, standard deviations, and interitem correlations for each TMCI-SF scale as follows: Satisfaction (M = 19.64, SD = 2.59, rs = .39–.73), Friction (M = 15.73, SD = 3.45, rs = .18–.52), Competition (M = 15.64, SD = 2.76, rs = .06–.43), Difficulty (M = 10.86, SD = 2.94, rs = .27–.53), Cohesion (M = 16.32, SD = 3.16, rs = .14–.57), and School Counselor Impact (M = 17.07, SD = 3.82, rs = .49–.73). Low to moderate internal consistency reflected by coefficient alphas for the six scales ranged from .57 to .88.
The initial CFA resulted in an unsatisfactory fit for the six-factor model. In addition, item analyses resulted in low item-to-scale correlations (rs = .25); consequently, the instrument items were reduced from 30 to 24. Specifically, problematic item loadings were discovered for three of the scales (Friction, Cohesion, and Competitiveness). Therefore, the Friction and Cohesion scales were collapsed into one Peer Relations scale. The exploratory factor analysis then resulted in a better fit for a five-factor model, accounting for 59.84% of the intercorrelation matrix variance. Recomputed coefficient alphas ranged from .66 to .87 and reflected a low-moderate to moderate reliability for each scale: Satisfaction (rs = .28–.60, α = .84), Competitiveness (rs = .32–.47, α = .66), Difficulty (rs = .27–.49, α = .75), Peer Relations (rs = .30–.63, α = .80), and School Counselor Impact (rs = .46–.73, α = .87). The researchers concluded that the revised TMCI-SF resulted in an improved fit for the model and provided some psychometric information about the utility of the TMCI-SF. However, the researchers suggested the instrument be tested using various teacher populations to increase the generalizability of the findings. Though this foundational study provided some psychometric information about the utility of the TMCI-SF, further research is needed to confirm its psychometric soundness.
Purpose of the Study
Previous research on the psychometric properties of the TMCI-SF has generated promising results. Sink and Spencer (2007), as mentioned to above, in their initial research study recommended additional psychometric work be conducted to confirm the measure’s dimensionality. Thus, the primary intent of this study was to reexamine the factorial validity of the TMCI-SF through the use of an MCFA with a new sample of teachers located in the north and southeast regions of Florida.
Method
Participants
Teacher
A total of 235, general education, fifth-grade teachers in two large school districts participated in the current study; however, demographic information was collected from 234 teachers. The school districts were located in the north (District A) and southeast (District B) regions of Florida. There were 197 (84.2%) females and 37 (15.8%) males. The teachers reported belonging to the following ethnic groups: 3 (1.3%) Asian, 39 (16.7%) Black, 12 (5.1%) Hispanic, 1 (.4%) Native American, 176 (75.2%) White, and 3 (1.3%) no response. The teacher sample averaged 12.1 years (SD = 8.7) of teaching experience.
Students
The following is the demographic profile of the students taught by the teachers in this study (N = 4,305): (a) Gender: 2,132 (49.52%) female and 2,173 (50.48%) male; (b) Ethnicity: 148 (3.44%) Asian, 1,487 (34.54%) Black, 856 (19.88%) Hispanic, 19 (.44%) Native American, 123 (2.86%) Multiracial, and 1,672 (38.84%) White; (c) Socioeconomic status: 1,958 (45.48%) noneconomically disadvantaged and 2,347 (54.52%) economically disadvantaged; (d) Disability: 3,814 (88.59%) nondisabled and 491 (11.41%) disabled; and (e) English Language Learners (ELL): 3,473 (80.67%) Non-ELL and 832 (19.33%) ELL students.
Instrumentation
The TMCI-SF (Sink & Spencer, 2007) was developed largely for use by elementary teachers and modified from the My Class Inventory–Short Form Revised (Sink & Spencer, 2005). Based on the seminal work of Fraser and Fisher (1986), the 30-item scale asks respondents to select how closely their classroom environment reflects the statement using a 5-point Likert-type scale ranging from 1 (strongly disagree), 2 (disagree), 3 (neutral), 4 (agree), to 5 (strongly agree). The TMCI-SF takes no more than 8 minutes to complete and is easy to administer and score. The instrument includes six scales (five items each) to assess teacher’s perceptions of the following dimensions experienced in the classroom: Satisfaction (how well students like being in the class), Friction (level of tension and conflict in the class), Competitiveness (level of rivalry among students in class), Difficulty (level of educational challenge), Cohesiveness (sense of student collaboration and amiability), and School Counselor Impact (school counselor’s impact on students’ satisfaction, friction, competitiveness, difficulty, and cohesion levels). No total score is generated. To obtain a score for a particular scale, the respondent’s nonweighted raw scores are summed. Therefore, scores for each scale can potentially range from 5 to 25. Items 8, 14, and 20 of the Friction scale are reverse-scored. In the current study, Item 16 was not included due to an administrative oversight, leaving only 4 items in the Difficulty scale and a total of 29 items. Initial psychometric properties of the scales were summarized earlier. In the present study, coefficient alphas for the six scales followed the same pattern as those of Sink and Spencer (2007): Satisfaction (α = .82), Cohesiveness (α = .75), Friction (α = .81), Competitiveness (α = .48), Difficulty (α = .72), and School Counselor Impact (α = .93).
Procedures
The data collected on the TMCI-SF survey occurred within the context of a multiyear, large-scale, randomized control trial funded through the U.S. Department of Education, Institute of Education Sciences (Webb, Brigman, Carey, & Villares, (2011). To guard against researcher bias, data collectors were hired to oversee the completion of the TMCI-SF (Sink & Spencer, 2007) and followed standardized data collection procedures. After obtaining university institutional review board and school district approvals, parents/caregivers of fifth-grade students were notified of the study via district call home systems and a letter sent home explaining the study, risks, benefits, and voluntary nature of the study and directions on how to decline participation. After parental consent was secured, all schools were randomly assigned to the treatment (n = 30) or control (n = 30) condition. Teachers in the treatment group gave their consent at a 1-day, curriculum-training workshop. A video detailing how to complete the study instruments was made available to the teachers in the treatment and control schools to support the completion of the study-related materials. Prior to implementing the study, the district project coordinators gathered teacher demographic information from their respective district databases. All participating teachers were then assigned a generic code (District No. 1-2, School No. 1-30, Classroom No. 1-6) and provided with a set of precoded labels, which were later affixed to top of each study instrument at the time of completion to ensure confidentiality.
Data Preparation
The data were inspected for any problematic issues (e.g., miscoding, irregular response patterns, missing data) and the parametric nature of item distributions. Initially, there were 235 classroom teachers participating in the study; however, the researchers excluded data from two classroom teachers due to missing data (i.e., one survey was left blank and the other did not answer the last 13 items). Of the remaining 233 teachers surveyed, 11 did not respond to one item and another missed three items. Of these 12, there was no discernible pattern, so the missing data were treated as missing at random and imputed by matching response patterns following the technique of Jöreskog (2005). In this technique, the teacher with a missing value for item i is matched to another teacher with the most similar response pattern on the other items. Specifically, for each teacher with missing data, an item-by-item comparison was made with every other teacher with complete responses. For example, if a teacher was only missing one response, i, out of the 29 possible responses, we first looked for any other teachers that had the exact same responses on the other 28 items. Response i from the matched teacher is then used as the missing value. If there was more than one teacher with an identical set of responses, then the responses to item i from the matched teachers were averaged and used as the missing value. Once the missing data were replaced by assigned values, this new data set of 233 teachers was used for the remainder of the analyses. Finally, prior to conducting the preliminary data analysis the negatively worded items (2, 8, and 14) were reverse-coded.
Results
Preliminary Analyses
The descriptive statistics for survey items grouped by scales are provided in Table 1. As expected, item means and standard deviations were similar within each scale. Next, the researchers compared the results of the six scales (i.e., Satisfaction, Friction, Competitiveness, Difficulty, Cohesiveness, and School Counselor Impact) by group using a multivariate analysis of variance. There were no significant differences in responses when considering the teachers’ gender or whether the teacher was in the treatment group. However, even after controlling for the percentage of low-income and White students in each classroom and in the multivariate analysis of variance, significant differences were found between the two school districts on the Cohesion and School Counselor Impact scales. For instance, District B’s scale scores were larger for both Cohesion and School Counselor Impact by 1.5 and 2.1 points, respectively (with 95% multivariate confidence intervals [0.002, 3.03] and [0.20, 3.9]). Subsequently, CFAs were conducted on the data set to determine the measure’s factorial validity.
Descriptive Statistics of the Survey Items.
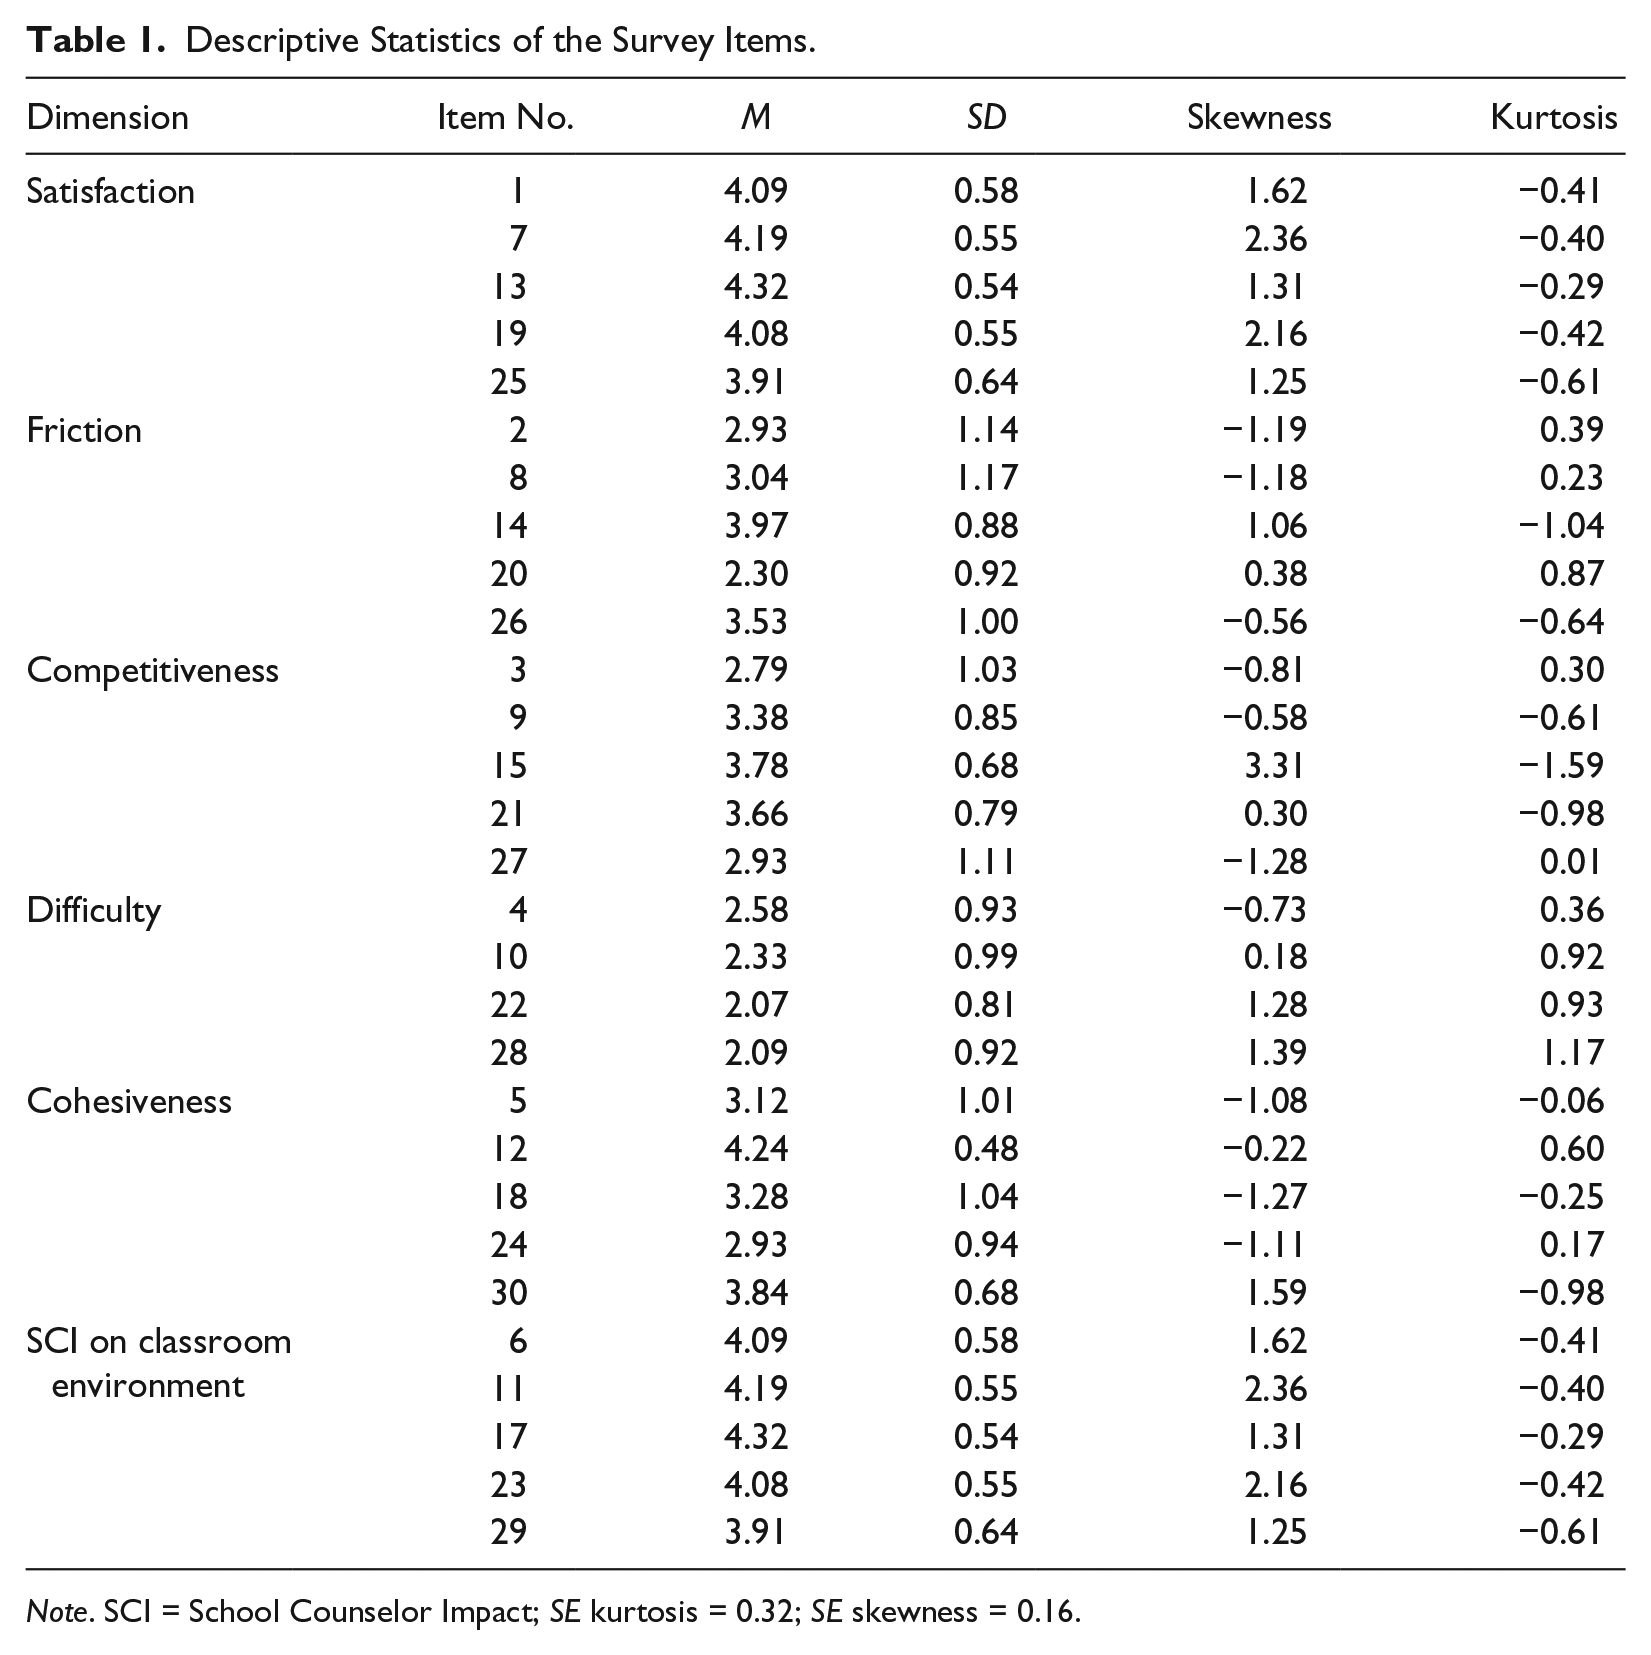
Note. SCI = School Counselor Impact; SE kurtosis = 0.32; SE skewness = 0.16.
Confirmatory Factor Analyses
Multilevel Confirmatory Factor Analysis
An MCFA was conducted to assess the structure of the TMCI-SF. Because the teachers in this study were nested within schools, there was a hierarchical nature to the data. Therefore, an MCFA was conducted to assess the five-factor structure of the TMCI-SF based on Sink and Spencer’s (2007) initial psychometric analysis. The MCFA was conducted using maximum likelihood estimation (du Toit & du Toit, 2008) via LISREL Version 8.80 (Jöreskog & Sörbom, 2006). Again, to be consistent with the work of Sink and Spencer (2007), the Cohesion and Friction scales were combined into one factor, Peer Relations (α =.87, for 10 items). The resulting path diagrams and standardized solutions for the between and within schools results are shown in Figures 1 and 2, respectively. As expected, the chi-square test was significant, χ2(734) = 1909.11, p < .001; thus, the null hypothesis of the model exactly fitting the data was rejected. The root mean square error of approximation (RMSEA) of the five-factor multilevel model was .083 with a 90% confidence interval [0.079, 0.088], where a value of .05 can be thought of as a good fit and values from .05 to .08 indicate a moderate fit (Browne & Cudeck, 1993).
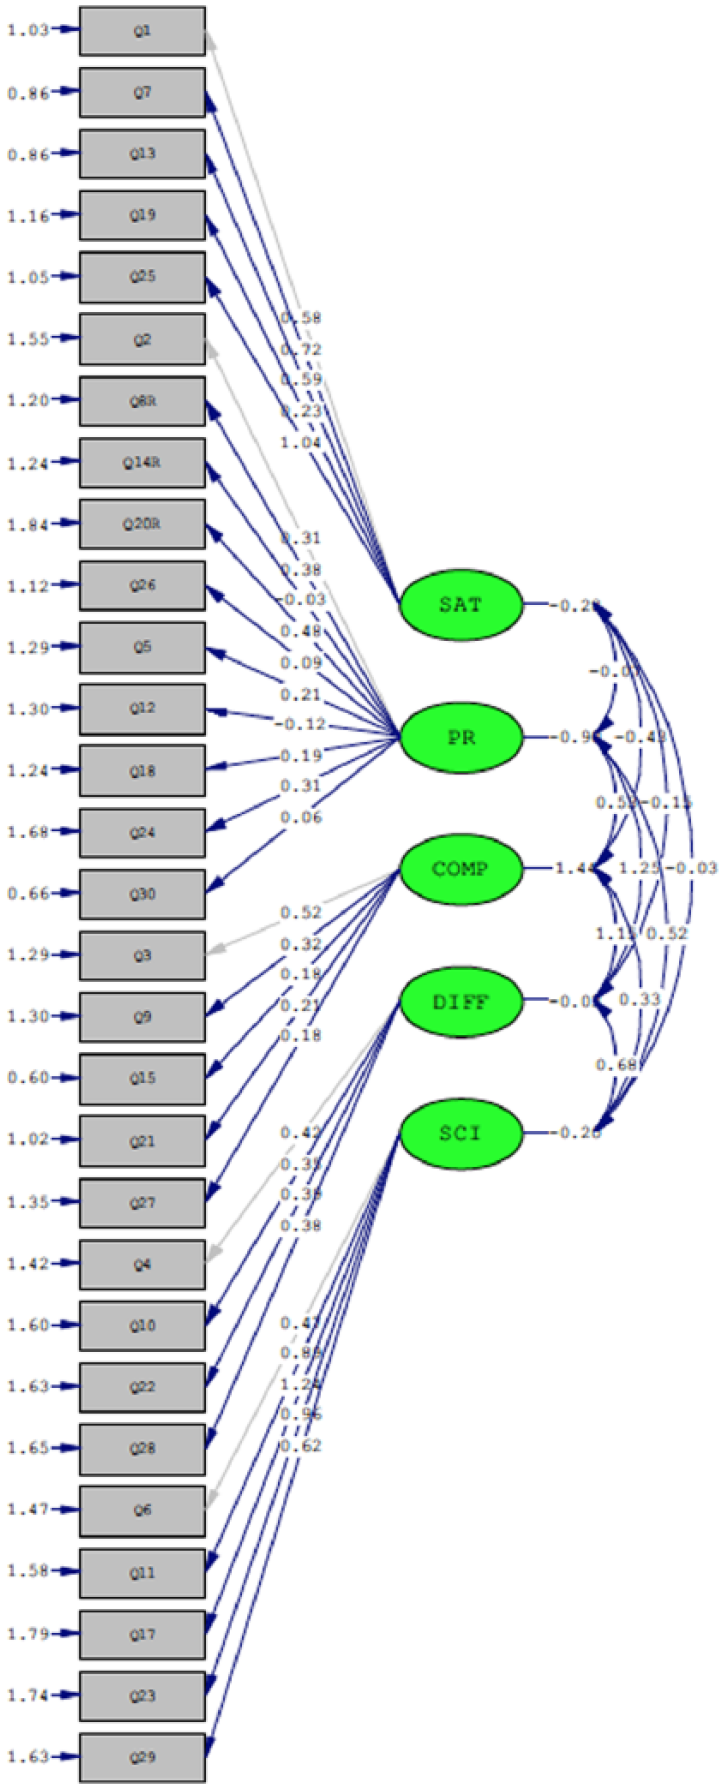
Multilevel confirmatory factor analysis path diagram of the five-factor model between schools.
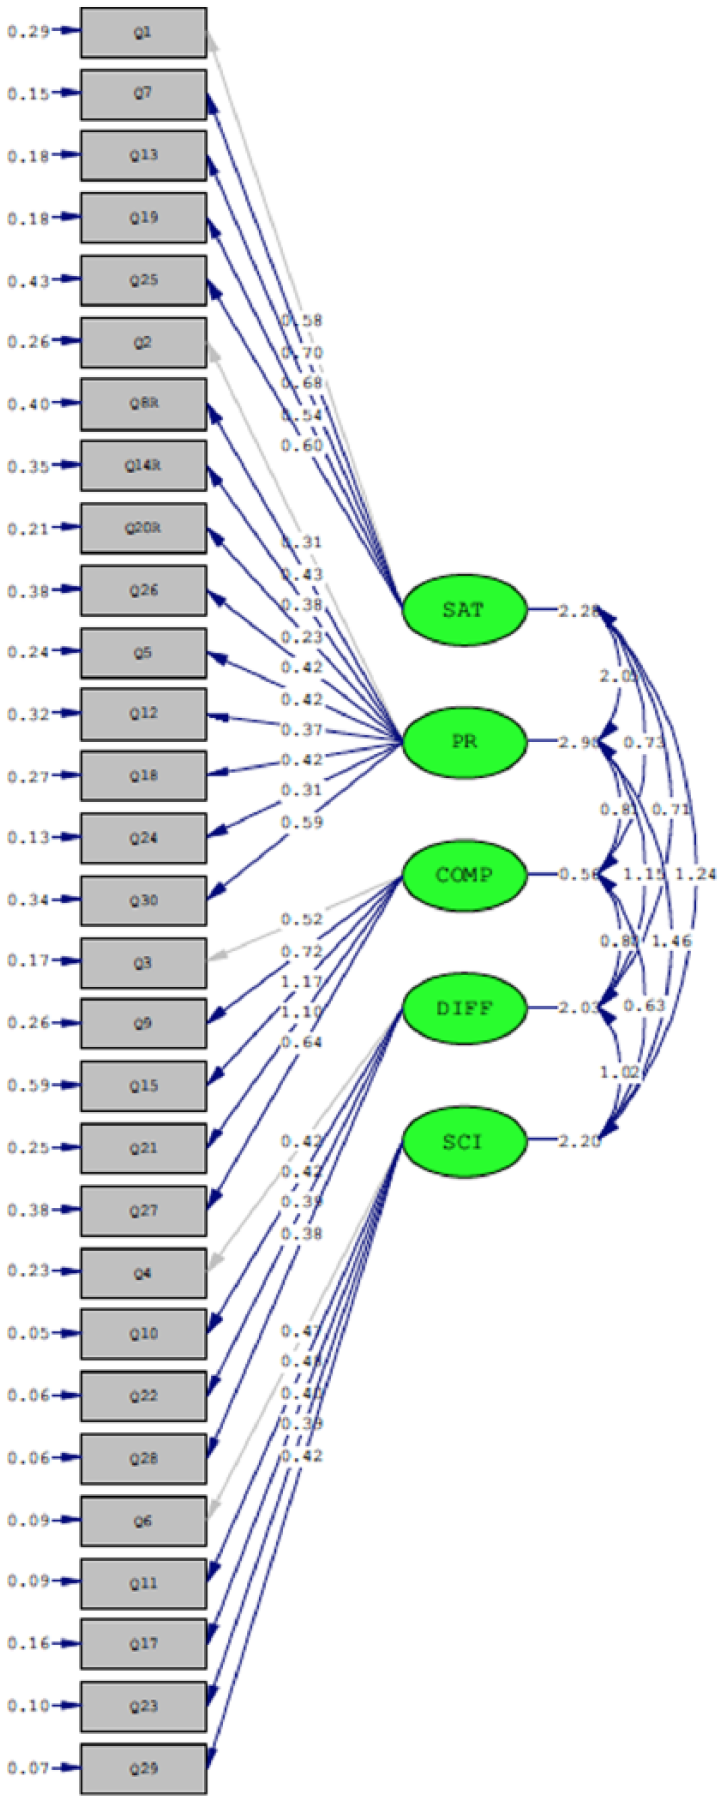
Multilevel confirmatory factor analysis path diagram of the five-factor model within schools.
Single-Level Confirmatory Factor Analysis
Since the average number of teachers nested within each school was so small (3.9 teachers per school), fitting the MCFA was not ideal. The small cluster size did not afford adequate variability to properly estimate the multilevel model, so a follow-up single-level CFA was conducted to further assess the five-factor structure. Figure 3 presents the resulting path diagram of the five-factor model. The single-level model was examined using the robust diagonally weighted least squares technique (Jöreskog, 1990). The fit indices suggested a moderate to good fit with the hypothesized model. As expected, the chi-square test was significant, χ2(367) = 613.12, p < .001; thus, the null hypothesis of the model exactly fitting the data was not accepted. However, large sample sizes will inflate the chi-square statistic, so other fit indices were evaluated: Goodness-of-fit index (GFI = .97), comparative fit index (CFI = .97), normed fit index (NFI = .93), and RMSEA = .054, 90% confidence interval: [.046, .061]. While fit indices greater than .90 and a RMSEA less than .10 indicate an acceptable fit, values greater than .95 indicate a good fit (Browne & Cudeck, 1993; Hu & Bentler, 1999). Considering the range of the indices and the RMSEA, the five-factor model yielded an appropriate fit for an attitudinal survey.
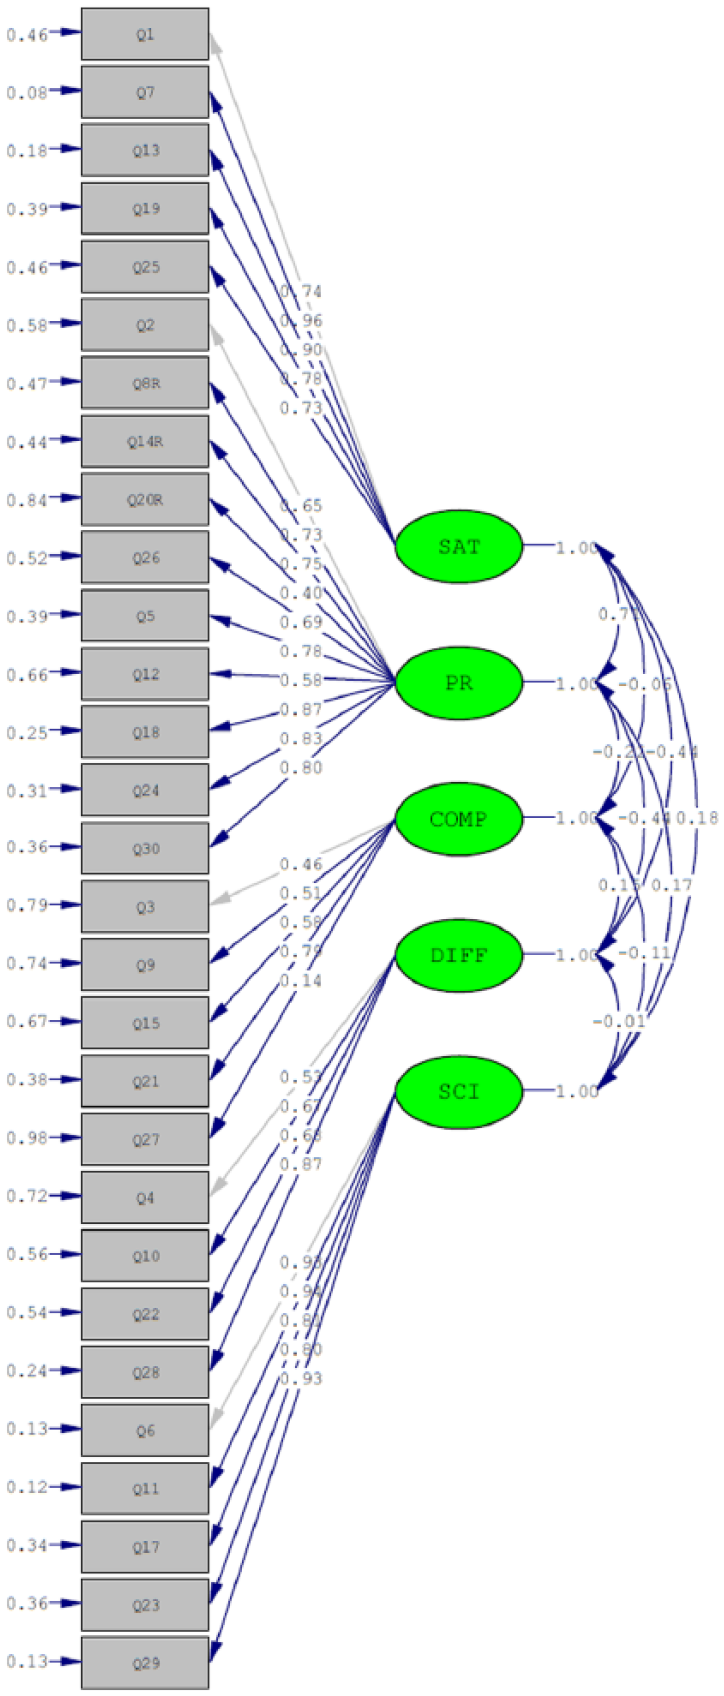
Confirmatory factor analysis path diagram of the five-factor model.
Discussion
The principal aim of this psychometric investigation was to cross-validate the TMCI-SF, a classroom climate inventory, with a sample of elementary school teachers located in the north and southeast regions of Florida. The multilevel and single-level CFA results were mixed. The CFA and MCFA involved five scales: Satisfaction (5 items), Peer Relations (a combination of 10 items from Cohesion and Friction), Difficulty (4 items), Competitiveness (4 items), and School Counseling Impact (5 items). In an attempt to account for the nested data, a five-factor multilevel CFA was conducted. The chi-square test and RMSEA suggested that the fit was less than optimal. It appears that the model fit was adversely affected by the limited sample size coupled with too few teachers nested within each school. Specifically, the 233 teachers nested within 60 schools did not allow for much variability per school, thus creating difficulties in convergence of the multilevel models. This difficulty did not allow for additional fit indices to be computed or a competing six-factor multilevel model to be fitted. In the Figure 1 and Figure 2 path diagrams, the values representing the relationship between a scale, or latent variable, and an item, or observed variable, should be interpreted as regression coefficients. As seen in Figure 1, the regression coefficients between four items—12, 14, 26, and 30—and the Peer Relations factor are small, indicating that these relationships are not consistent across the different schools. However, once the between-schools differences are accounted for, the within-schools results in Figure 2 demonstrate that the items within a given scale are similarly related and behaving relatively consistently within a school. The only exception is the Competitiveness scale, where two of the items loaded much more strongly on the factor than the other three items. This finding is consistent with the smaller coefficient alpha for the Competitiveness scale (α = .48).
The single-level CFA five-factor model was confirmed. According to the CFA, as shown in Figure 3, Peer Relations generated a positive correlation with Satisfaction (.71). In contrast, Peer Relations was negatively correlated with Difficulty (−.44) and Competitiveness (−.22). Difficulty was also negatively correlated (−.44) with Satisfaction. There were also weak, positive correlations between School Counselor Impact and Peer Relations (.17) and Satisfaction (.18). These findings are consistent with Sink and Spencer (2007).
The “positive climate” scale items largely generated higher mean ratings (Satisfaction, Cohesion, and School Counselor Impact) than for those items situated on the “negative climate” dimensions (Friction, Difficulty, and Competitiveness). Because educators tend to view their classrooms in less nuanced ways (i.e., polarized as either good or bad), skewness and kurtosis indices for some items were less than ideal (>1.00). Alpha reliabilities for four (Satisfaction, Peer Relations, Difficulty, and School Counselor Impact) out of the five scales were adequate for a perceptual survey. Similar to what Sink and Spencer (2007) reported, the Competitiveness scale coefficient in this study was weak (α = .48 current study, α = .66 original study). Unlike the current study, Sink and Spencer reported that the Peer Relations scale comprised five items derived from two factors, with several of the items dropping out of the final model. This minor discrepancy is anticipated when comparing factor structures derived from participant samples obtained from two geographic regions of the United States. In short, whereas the multilevel CFA was less than satisfactory, the single-factor CFA results reported above largely replicated the TMCI-SF’s factor structure and reliabilities presented in Sink and Spencer (2007).
Coupled with the results from Sink and Spencer (2007), the findings here provide further evidence that the TMCI-SF is potentially applicable to a variety of elementary school settings, particularly as a tool to estimate teachers’ perceptions of the classroom climate. Unique to this measure, the School Counselor Impact scale can be used to estimate school counselor contributions to improving various learning environments with high reliability (School Counselor Impact, α = .93). With the data summarized from the other TMCI-SF scales, the information generated provides a relatively comprehensive view of the classroom environment, including peer relations, difficulty of the classroom work, how competitive students appear to be, as well as their satisfaction level.
The demand for school counseling data-driven decision making, use of evidence-based curriculums, and school counselor accountability is well documented (Carey & Dimmitt, 2006; Dimmitt, Carey, & Hatch, 2007; Dimmitt, Carey, McGannon, & Henningson, 2005; Honig & Coburn, 2005; Slavin, 2008; Squier, Nailor, & Carey, 2014; Wiseman, 2010). School counselors do not work in isolation, and they play an integral role in transforming the school culture by providing responsive services to students struggling with mental, emotional, and behavioral issues and by encouraging an environment of acceptance and sensitivity (Grothaus, 2013). Furthermore, Carrell and Hoekstra (2011) found that the school counselor’s role was critical to enhancing teacher quality, by assisting them with managing problem behaviors, helping address pressing student concerns, and freeing them up so that they could focus their efforts on teaching. Despite these claims, there remains a significant dearth in the school counseling literature of sound psychometric instruments available to measure the classroom climate from a teacher perspective as well as the ability to evaluate the impact of school counselors’ efforts toward establishing and sustaining positive learning environments (Sink & Spencer, 2007). The TMCI-SF can yield meaningful quantitative data as school counselors attempt to be more data-driven (Dimmitt et al., 2007) and accountable (Loesch & Ritchie, 2005) for their support of classroom teachers. Counselors can give the survey to classroom teachers prior to and after implementing school counseling interventions as a means of documenting changes in the classroom environment. The instrument can also be used to evaluate the effectiveness of the school counseling programs and can lend support for expanding school counseling services to students and classrooms. In addition, the TMCI-SF instrument is free to educators, is easy to administer and score, and requires no more than 8 minutes to complete.
Limitations and Suggestions for Future Research
Several research limitations need to be acknowledged. First, self-report attitudinal surveys like the TMCI-SF can be problematic, for examinee factors like response bias and social desirability tend to be present (Furnham, 1986). Second, since data collected came from a nonrandomized sample of teachers in the north and southeast regions of Florida, the generalizability of the findings to teachers in other regions of the United States may be compromised. Third, the Difficulty scale was missing an item due to administrative error. Fourth, to obtain more robust MCFA findings, the study would have benefitted from a larger sample size.
Future studies looking at TMCI-SF’s utility should consider testing for invariance across a variety of participant demographic variables. Regrettably in this investigation, the sample size was insufficient to conduct the analysis. The Competitiveness scale needs to be revised before it can be meaningfully deployed in accountability or efficacy research. Last, qualitative research should be conducted to assess whether actual student behavior and classroom practices and processes reflect the quantitative survey data.
Conclusion
In an age of accountability, professional school counselors, teachers, and administrators need sound psychometric instruments to determine if their programs, interventions, and efforts are making a measurable difference with helping students master academic learning, behavior, and career outcomes (Brown & Trusty, 2005; Sink & Spencer, 2007; Villares et al., 2014; Whiston, Tai, Rahardja, & Eder, 2011). Teacher perceptions are valuable as they provide information about overall tone, mood, and interactions among members of a school environment. School leaders interested in making necessary and proper programming, curriculum, and staffing decisions are advised to collect teacher perceptions of climate. Using instruments such as the TMCI-SF that take into account the teachers’ perspectives is vital for assessing key areas of classroom climate research (e.g., the quality of student–teacher and peer relationships, level of satisfaction and difficulty, warm and respectful nature of interactions, and differentiated instruction). Ongoing evaluation of the classroom climate provides professional school counselors with the opportunity to collaborate with school staff to identify their strengths and weaknesses and plan for future program implementation.
Footnotes
Declaration of Conflicting Interests
The author(s) declared no potential conflicts of interest with respect to the research, authorship, and/or publication of this article.
Funding
The author(s) received no financial support for the research, authorship, and/or publication of this article.