
Abstract
The development of Rasch-based “comparative engagement scenarios” based on Guttman’s facet theory and sentence mapping procedures is described. The scenario scales measuring engagement in work, caregiving, informal helping, and volunteering illuminate the lived experiences of role involvement among older adults and offer multiple advantages over typical Likert-based scales.
Engagement is a construct that refers to the experience of connecting on a deep and meaningful level with a role (Kahn, 1990). While there is a well-developed body of knowledge on engagement within the role of paid work (Christian, Garza, & Slaughter, 2011), little is known about what engagement looks and feels like in other important later life roles such as caregiving, informal helping, and volunteering. For example, does engagement have the same meaning for these different roles? If so, then a role-independent measure of engagement is important given that several theories of aging suggest that occupying productive roles, that is, paid or unpaid activities that produce goods or services (Herzog, Kahn, Morgan, Jackson, & Antonucci, 1989) can help maintain health and vitality in later life (e.g., Morrow-Howell, Hinterlong, & Sherraden, 2001). The present article addresses the role-independent measurement challenge in an innovative way by introducing a portfolio of Rasch-based (Rasch, 1960/1980) scenario measures for engagement in paid and unpaid activities in later life.
Kahn (1990), one of the originators of the idea of engagement, defined work engagement as “the harnessing of organization members’ selves to their work roles; when people are engaged, they employ and express themselves physically, cognitively, and emotionally” (p. 694). While Kahn did not construct scales to measure his three components of work engagement (physical, cognitive, and affective), several other researchers have done so. For example, May, Gilson, and Harter (2004) followed a traditional classical test theory approach by developing 24 five-point strongly agree to strongly disagree Likert-type items. Since these authors’ principal component analyses did not yield evidence of three separate components, they subsequently reduced the items to 13 to form an overall scale that “demonstrated good reliability and had some balance across the three forms of engagement” (p. 21). The scale development and revision process essentially consisted of selecting the items with the highest interitem correlations in order to ensure the maximum reliability of the total score.
Similarly, the Utrecht Work Engagement Scale (UWES) is based on a definition of work engagement as a “positive, fulfilling, work-related state of mind that is characterized by vigor, dedication, and absorption” (Schaufeli & Bakker, 2003, p. 4). Schaufeli, Salanova, Gonzalez-Roma, and Bakker (2002) started with 24 seven-point Likert-like frequency response items and reduced them to 17. The short-form process consisted of selecting items within the three components that were most highly intercorrelated. Schaufeli, Bakker, and Salanova (2006) then reduced the 17 items to 9 to form the UWES-9. They employed all the standard tools of classical test theory: exploratory and confirmatory factor analyses, various reliability analyses, and multiple forms of validity checks. The factor structure of the UWES has been studied with differing results, for example, Schaufeli et al. (2006) employed a one-factor solution for computing scores rather than the three-factor solution that better fit their data, whereas others did not find a clear factor structure (Muilenburg-Trevino, 2009; Sonnentag, 2003).
In addition to these scales, multiple others have devised work engagement scales (e.g., Demerouti, Mostert, & Bakker, 2010; Rich, LePine, & Crawford, 2010; Rothbard, 2001; Saks, 2006). Across these studies, evidence is inconsistent as to whether the construct should be conceptualized as three-, two-, or one-dimensional. Furthermore, as standard classical test theory was employed in all studies, there was no discussion of how the construct would theoretically define a continuum spanning relatively lower-to-higher levels of engagement. Finally, engagement, additionally, will occur in many settings, not just work; if engagement may be defined as positive affective and cognitive states while performing an activity, then the psychological state of engagement should theoretically be the same regardless of the activity or setting. Taken together, these points suggest a need for innovations in both the development of the measure and the types of activities assessed.
The importance of clearly defining and capturing this construct for an older adult population and within the productive roles of work, caregiving, informal helping, and volunteering specifically, is evident in research that has demonstrated a relationship between involvement in productive activities and measures of health and well-being, such as positive self-concept and reduced rates of depression and mortality (Bambrick & Bonder, 2005; Lum & Lightfoot, 2005; Rozario, Morrow-Howell, & Hinterlong, 2004). The mechanisms through which these activities exert their positive health and well-being effects are unclear, but insights from the work engagement literature suggest that engagement may play a key role in this process (see Bakker & Leiter, 2010; Torp, Grimsmo, Hagen, Duran, & Gudbergsson, 2012).
The purpose of the present study is to introduce the development and implementation of a Rasch (1960/1980) “comparative engagement scenario” measurement instrument based on Louis Guttman’s facet theory and sentence mapping procedures (Guttman, 1959). In the following sections, we first present our definition of engagement as applied to adult productive life roles. We follow with an explanation of the principles of Rasch measurement underlying our work, then an explanation of our Guttman facet theory and sentence mapping procedures. The sampling procedures are described and results are then presented.
Method
Construct Definition
The overarching goal of the Productive Engagement Portfolio (PEP) project was to develop a definition and measure of engagement in paid and unpaid productive activities for use among older adults (Matz-Costa, James, Ludlow, Brown, Besen, & Johnson, in press). Such a measure would contribute to our understanding of the mechanisms through which productive activity is linked to positive health and well-being outcomes in later life. We started with the work engagement literature cited earlier but wanted a definition that was not work-dependent and a measurement process that would yield a score that could be directly linked to a meaningful, qualitative description of the nature of engagement to be expected of a person at a given score level.
We started the conceptual process by asking ourselves what “full” engagement and “less than full” engagement look like. That is, what does a person who is fully or highly engaged do, think, act like, and feel? Likewise, what does a person who is at a lower level of engagement do, think, act like, and feel? Is there a continuum of engagement that stretches by degrees between these two extremes of people? What would constitute a progression that a person could undertake to move from “lower” to “higher” levels of engagement? Does this framework seem to cut across different productive adult roles—not just paid work?
We concluded that engagement is a positive, enthusiastic, and affective connection with a role that both motivates individuals to invest their valuable resources and simultaneously energizes them (Matz-Costa et al., in press). Our subsequent work developing the measurement portfolio was shaped by our theorizing that engagement is a unidimensional but complex construct where a higher level of engagement is characterized by high interest, focus, energy, and perseverance. Lower levels of engagement are then characterized by lower levels of interest, focus, energy, and perseverance. These four facets of engagement are assumed to function simultaneously in defining a hierarchy of intensity that progresses along a continuum. Furthermore, we make no claim that the four facets of engagement may, or should, be disentangled from each other. This operational definition of engagement is conceptualized as independent of the four later life roles of work, caregiving, informal helping, and volunteering. The measurement challenge was to create a portfolio of scales which met the conditions of this broad definition.
Rasch Measurement Model
As stated earlier, our goal was to go beyond the traditional classical test theory standards of high reliability, simple factor structure, and various correlation-based construct validity indicators. We sought a measurement process that would yield a person’s score which could be literally interpreted as a location along a continuum of engagement intensity. Item response theory models, and the Rasch model in particular, are ideally suited for this situation.
Although the ideas of Georg Rasch (1960/1980) have been restated, embellished, expanded, and criticized in many ways through thousands of published articles and conference presentations over the past 50 years, his measurement principles are still deceptively simple: (a) the items should be of the “same sort” or possess “uniformity of content” (pp. xiv, 125), (b) they should vary from “very easy to very difficult” (pp. xiv, 123, 125), (c) “the difficult and the easy parts are spread evenly” (p. 37), (d) their easy-to-difficult spread should follow a progression like “quite easy one-syllable words . . . ends with some rather difficult words of 3 or more syllables” (p. 53), (e) the items should be of equal discrimination (pp. 117, 125), (f) the items should be independent in the sense that an answer to one is not dependent on the answer to another (pp. xvii, 75, 168), and (g) “weeding” should be conducted so that “they on the whole fit well” (p. 125). In current terminology these requirements for a “set of well chosen test problems” (p. 78) may be stated as unidimensionality, variation, and uniform spread of items along a continuum, hierarchical in the nature of their progression along the continuum, equally discriminating, independent, and well fitting as a match between theory and data.
These principles define how an instrument should be constructed, not simply whether a set of items may be described in these terms post hoc. In addition, the purpose for this discussion was to underscore the point that our measurement goal was not to find the best fitting item response theory model for our scales but to attempt to construct scales (i.e., items and response options) that met the principles outlined above.
Instrument Development
In addition to relying on the foregoing measurement principles, we believed, based on years of previous instrument development work, that a scenario-style item format would produce a comprehensive description of a person’s feelings and behaviors that was richer and more useful than the narrowly focused description typically seen for Likert-based item formats. Furthermore, Likert-based psychological constructs tend to exhibit a positive bias in responses that produces ceiling effects and skewed distributions that are not useful for differentiating between people (Friborg, Martinussen, & Rosenvinge, 2006). These patterns may be due to various personal tendencies, such as a person’s need to express “socially desirable” or “correct” responses that have little to do with the measurement task at hand. The challenge with scenario-style items, however, is to minimize, if not remove fully, the tendency of multifaceted items to be double-barreled and confusing.
Scenario-style items are a largely unexplored area in instrument development. A search of research databases using keywords such as “scenario items,” “vignette items,” and “multi-sentence items” produced few results, except in applications where the respondent predicted personal behavior in an ethically challenging situation or judged a characteristic of a hypothetical “other,” rather than the level of a measured construct in himself or herself (Basow & Thompson, 2012; Behnke, Ames, & Hancock, 2012; Walker-Descartes, Sealy, Laraque, & Rojas, 2011).
Three studies, however, provide relevant applications. Rossi and Anderson (1982) proposed a “factorial survey approach” in which vignettes are short descriptions defining an object to be judged by a person. The descriptions are composed by initially defining a set of important dimensions and then the dimensions are characterized by different levels. Logistic regression was then used to “express the extent to which judgments are affected by the presence of a particular level in a factorial object that is being rated” (p. 44). Van der Pas, van Tilburg, and Knipscheer (2005) used a “vignette technique” to measure expectations of filial responsibility through responses to hypothetical scenarios. The authors cite the strength of these items, in that, “the details of the vignette, specifying various features of its context, enhance the respondent’s capacity to make normative statements about a comprehensive set of social circumstances” (p. 1030). Randall and Engelhard (2010) used Guttman’s “mapping sentences” as a framework for developing items to measure teachers’ leniency and severity in grading students. They used four facets of grading philosophies (student achievement, ability, behavior, and effort) to construct items that addressed all levels of each facet. There were a total of 54 items and they state, “Each item/scenario represents one student with specified characteristics” (p. 127). They specifically wanted to determine the extent to which the four facets influenced the assignment of final grades.
Facet Theory and Sentence Mapping
Similar to Randall and Engelhard (2010), we drew on Guttman’s facet theory (FT) to frame the important components, that is, facets, of productive role engagement and then his sentence mapping procedure to construct the scenario-type items comprising our four scales—one for each role (Guttman, 1959; Shye, 1978). Although FT consists of design and data analysis components (Borg & Shye, 1995), our interest lies in FT design. As a design methodology FT promotes a useful level of formality for defining the structure of a construct of interest (engagement), hence FT serves as a basis for systematic item development and subsequent data collection (Borg & Shye, 1995). A facet is a variable that defines the properties that comprise a construct. More specifically, it is typically an ordered categorical variable—in an experimental design these would be called independent variables or factors (Borg & Shye, 1995)—and “the initial choice of facets depends on the creativity and perceptiveness of the theorist” (Wiggins, 1980, p. 477).
A category, or element, of a facet is called a struct—ideally these cover the spectrum of the facet. The various combinations of facet structs are called structuples. Structuples then specify the nature of the content to be included in the development of an item, or scenario in our case. Well-designed facets should be clear, subject to good coder reliability, and mirror the data they characterize (Borg & Shye, 1995). The identification of useful facets and their structs typically requires a program of iterative replications and revisions (Borg & Shye, 1995).
A mapping sentence is then used as a lexical tool to illustrate the structural relationships among the facets. It includes the formal structs of the facets and the informal components of natural language “to give the facets a context in which their roles become clearer” (Borg & Shye, 1995, p. 50). By composing a mapping sentence, a sample of items or scenarios is then created that operationally define the construct (engagement). The process of formalizing mapping sentences, however, can be complex and unwieldy with potentially thousands of elements that “quickly [turn] into monstrous jumbo sentences” (Borg & Shye, 1995, p. 56). Useful mapping sentences depend on the quality of the facets but will also have a somewhat abstract content that, perhaps most important for our purposes, “lend themselves to extensions and generalizations” (Borg & Shye, 1995, p. 55). These basic principles and objectives of FT informed the development of our four scales.
The productive role engagement construct, independent of the specific role, was originally conceptualized with four dimensions (facets) in mind: interest, effort, focus, and perseverance (Matz-Costa et al., in press). A “categorical sentence mapping” process describes how the facet elements were defined and linked (Borg & Shye, 1995, p. 44). In this process, the structs of the facets represent ranges—essentially high, moderate, and low. Each scenario then reflects an explicit combination of elements with the final set of scenarios reflecting an overall wide range in level of engagement.
Rather than using high, medium, and low as the “common range” terms for the facet elements, however, we sought “unobtrusive facetizations,” which would reduce redundant wording and transparent content to respondents regarding directionality and intention of a scenario. To accomplish this we constructed an “exemplar” term for each level of each facet and once that specific term was employed in a structuple combination, we used a substitute term (as close to a synonym as possible) when that facet level was next required in a new structuple arrangement. The categorical sentence map including the exemplar terms for the productive role engagement construct is presented in Table 1.
Role Engagement Sentence Map.

Since there are four facets, each with three levels, there are 34 = 81 combinations or structuples. Eighty-one scenario combinations, however, are impractical to administer. We could have selected a subset of fewer than 81 scenarios yet aimed for facet orthogonality by employing a random selection process (Rossi & Anderson, 1982) or a fractional factorial experimental design (Winer, 1970), but we wanted clear evidence that the FT design process successfully produced scenario scales that followed the Rasch principles and were independent of role type—thereby meeting the FT “principle of empirical nontriviality” (Winer, 1970, p. 86). Furthermore, since we constructed the scenarios from scratch we wanted to “avoid cases of ambiguity” (Borg & Shye, 1995, p. 40) that were outright illogical in their construction, for example, I3, F3, E1, P1. Hence, we employed an “extreme groups contrast” procedure whereby we constructed three extreme scenarios from the higher facet level (e.g., I3, F3, E3, P3), three scenarios from the moderate level (e.g., I2, F2, E2, P2), and three extreme scenarios from the lower level (e.g., I1, F1, E1, P1). Our reasoning was that if we could not construct scenarios that captured the boundaries in engagement levels, then it would be fruitless to try to capture subtleties between them.
Table 2 presents the keywords/phrases we used to represent the three levels for the four facets across the four roles. For example, for the three extreme scenarios developed to capture Level 3 (high) for Interest (I) we used “fascinated” as the exemplar along with “identifies strongly” and “enthusiastic” as synonyms. There may be nuances differentiating these three descriptors for “high interest” but those differences were assumed to be less than the differences that occur when dropping down to Level 2 (moderate) in the Interest facet. This strategy, with continuous discussion and revision, was applied to each separate level of the four facets. The scenarios were then constructed as two sentences, each sentence capturing two of the four facets. Table 3 contains the final set of scenarios for each of the four roles. The wording of each scenario is nearly identical and differs only when grammar forced a change.
Sentence Mapping Levels.
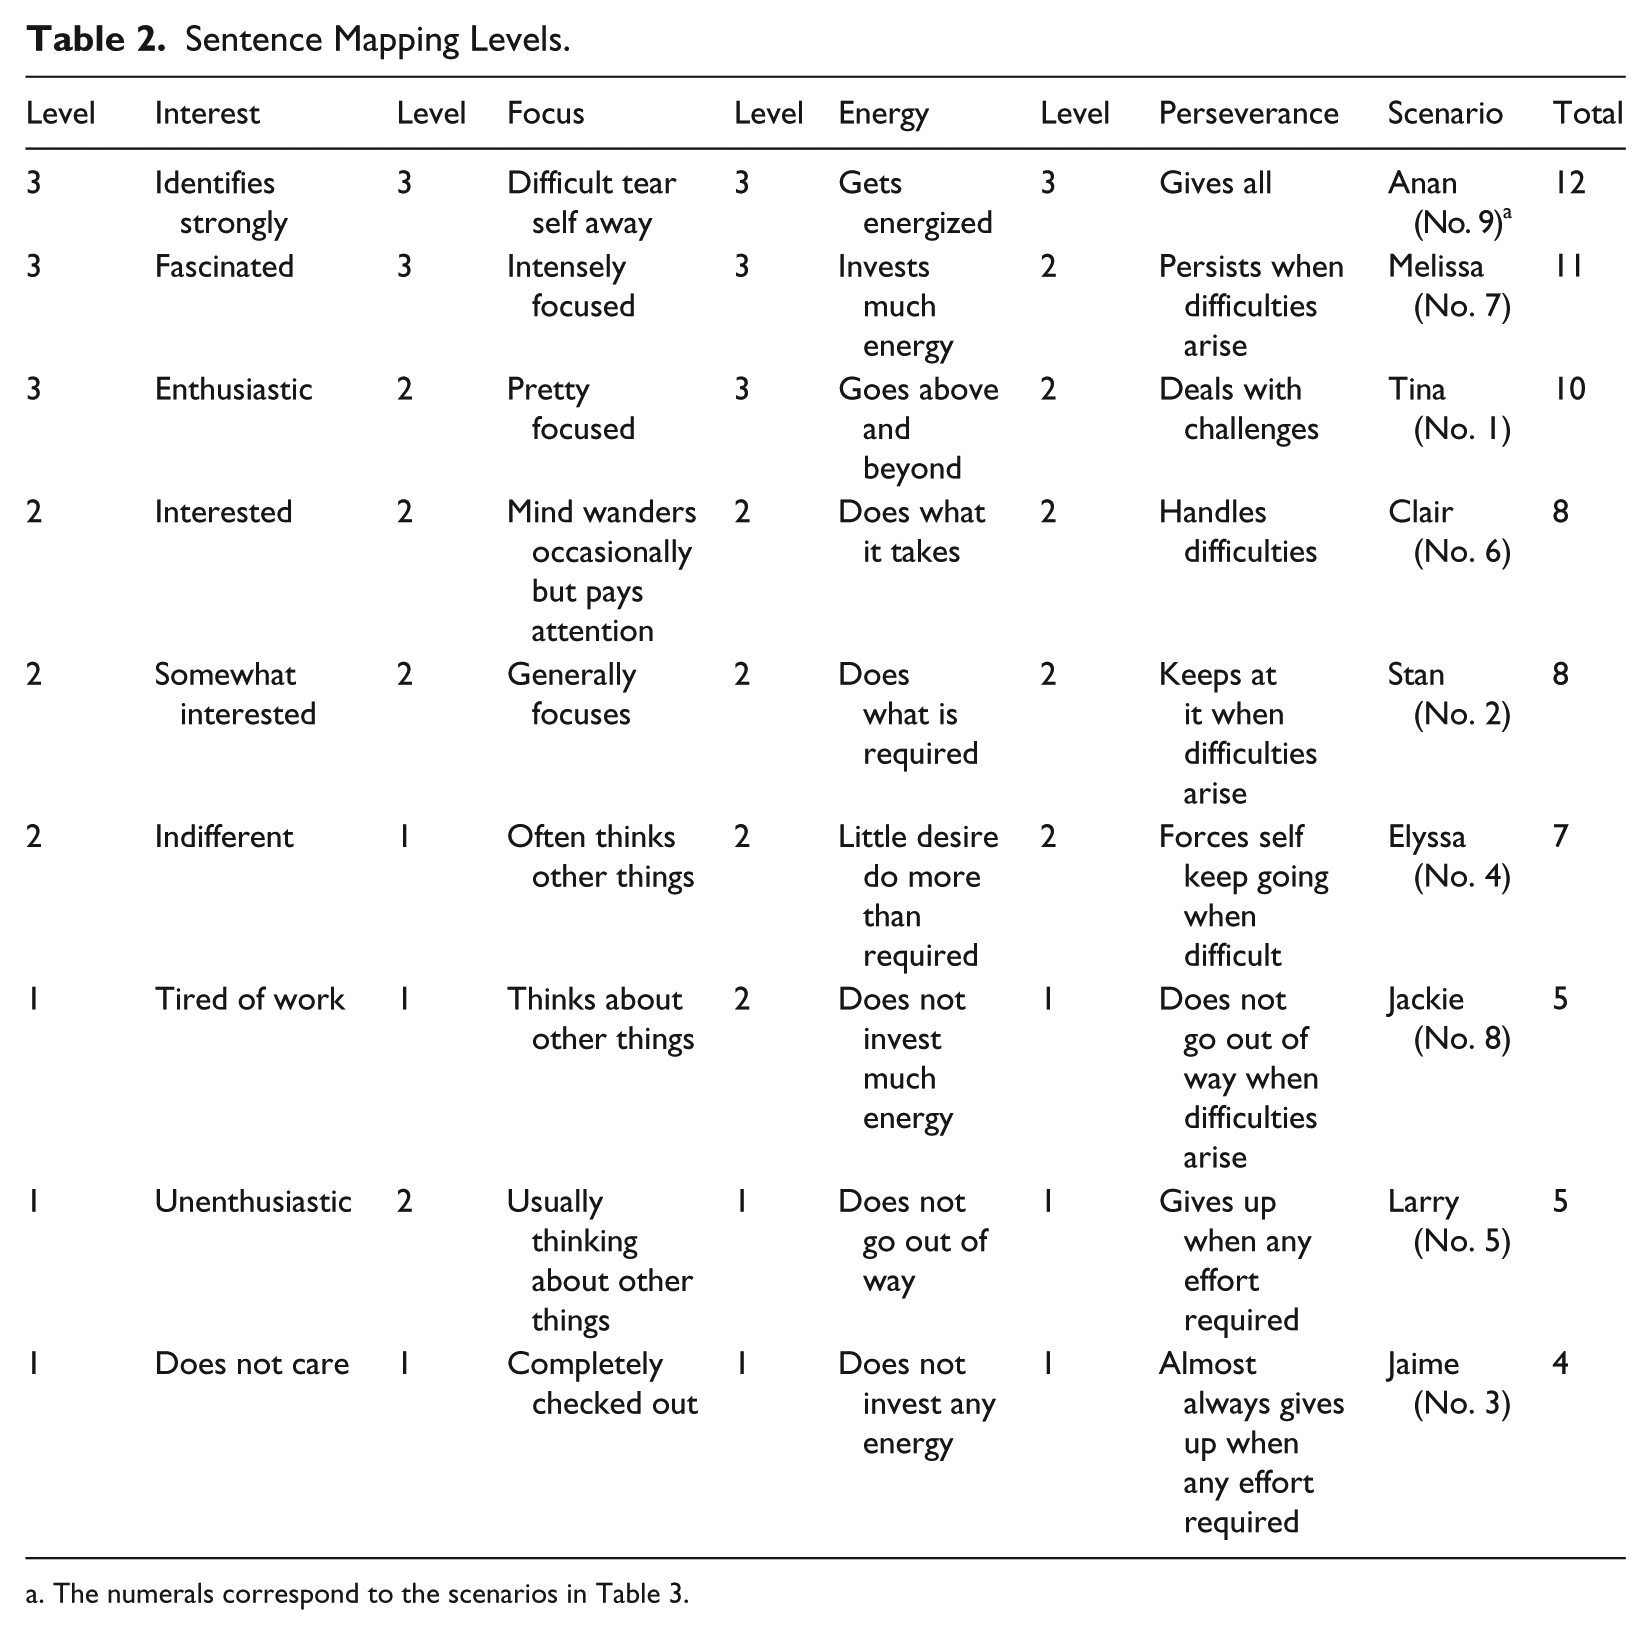
The numerals correspond to the scenarios in Table 3.
Adult Role Engagement Scenarios.

The ordinal codes for the three levels across the four facets provide a simple way of indicating the overall engagement level of each scenario. The right-hand column in Table 2 contains the sum of the coded levels. For example, Scenario #9 has a “score” of 12—the sum of the four facet levels for that scenario. This scenario should be the hardest scenario to elicit “much more engaged than ‘X’” responses (this response option style is explained in greater detail below). The easiest scenario to elicit “much more engaged than ‘X’” responses should be #3. The rank order from Scenario #9 to #3 became our hypothesized scale structure defining productive engagement across the four roles. The subsequent Rasch model analyses served as a confirmatory test of the extent to which our theory of the structure of productive role engagement was supported by empirical data.
Response Options
Originally, items were phrased in the first person, and respondents indicated the extent to which they agreed or disagreed that the scenarios described themselves. Results from the first small-scale pilot, however, showed significant confusion and unexpected responses to the moderately phrased scenarios. That is, some respondents with otherwise high levels of engagement gave unexpectedly low responses to the moderate scenarios—they “disagreed” with the moderate scenarios since they were beyond the type of moderate level of engagement that the scenarios presented. This was problematic since respondents with lower levels of engagement gave appropriate “disagree” responses to these higher level, but moderate, scenarios. The scenarios seemed to adequately define an appropriate progression of engagement but identical responses came from people with qualitatively different levels of engagement. At this point it would have been possible to change our measurement purposes and employ an item response theory unfolding model (Coombs, 1950; Roberts, Donoghue, & Laughlin, 2000; Scherbaum, Finlinson, Barden, & Tamanini, 2006), but we followed the more parsimonious strategy of revising the response options.
The scenarios were augmented with a unique response format, resulting in what we call “comparative scenarios.” In this version, respondents are asked about their level of engagement in the following manner: Each question will provide a scenario describing how a person feels and behaves when he or she is “performing the specific role.” You will be asked: On a typical day, are you (a) Much more engaged than “X,” (b) More engaged than “X,” (c) About as engaged as “X,” (d) Less engaged than “X,” or (e) Much less engaged than “X.”
With this format the moderately phrased scenarios can be rated appropriately higher (i.e., more or much more engaged) by highly engaged people. The directional structure of the responses also avoids any need for reverse scoring as a “5” always indicates the highest level of engagement. Scores on all four scales range from 9 (lower) to 45 (higher).
Sample
Scale development proceeded through three pilot samples and one full scale administration. Pilot 1, mentioned earlier, was conducted with friends, family, and coworkers. Its purpose was to gain feedback on the extent to which the scenario wording and response options were clear or confusing. The second pilot was conducted with residential community volunteers. Here we sought feedback on the degree to which the various scenarios across the four roles appropriately captured levels of engagement they had experienced. Pilot 3 was conducted with graduate students in research methods and psychometrics courses. In this version, we asked for feedback about potential double-barreled scenario structures, preferences for different response options, ambiguity in terms, and obvious transparency in “correct” responses. Each pilot was analyzed and revisions made before the next was administered—words were eliminated or replaced when they were confusing, scenarios were dropped when redundant, and the response options were changed (as explained earlier).
The full-scale formal administration of the PEP (Matz-Costa et al., in press) was stratified for activity involvement: 120 paid workers, 120 caregivers, 120 informal helpers, and 120 volunteers. Respondents’ involvement in each of the roles was assessed using questions derived from the Americans’ Changing Lives Study (House, 2003). Paid employment was assessed by asking respondents whether they currently work for pay; volunteering by asking if they did volunteer work in the past 4 weeks for any national or local organization (e.g., a church or other religious organization, a school or educational organization, etc.); caregiving by asking if they currently were involved in helping a friend or relative age 18 or older who has trouble taking care of themselves because of a physical or mental illness, disability, or for some other reason (includes caring for them directly or arranging for their care by others); and informal helping by asking if they provided unpaid help in the past 4 weeks to someone who does not reside with them (excluding ill/disabled), including providing transportation, shopping, running errands, helping with housework or car maintenance, or providing child care.
Each person completed the scenario scale appropriate for just one of their current activities. The 480 individuals ranged in age from 50 to 89 years, with a mean of 63.18 (SD = 8.32). They were 60.6% female; 38.8% with a bachelor’s degree or higher; 90.9% Caucasian; 57.9% married/cohabitating; and 92.1% living independently.
Data Analysis
The Rasch rating scale model (Andrich, 1978; Rasch, 1960/1980; Wright & Masters, 1982) was employed for the analysis of the four sets of scenarios. This model, in contrast to the Rasch partial credit model (Masters, 1982; Wright & Masters, 1982), is appropriate when the response categories are intended to have the same meaning for all items and the same monotonic order of increasing difficulty across all items. In addition, since the pilot studies led to the removal or modification of scenarios with poor item-total correlations and poor Rasch-based fit statistics (explained more fully below), these steps minimized the need to incorporate an item discrimination parameter in the model (Hambleton, Swaminathan, & Rogers, 1991). Furthermore, unlike Randall and Engelhard (2010) and Rossi and Anderson (1982), we were not interested in testing the relative weight of the individual facets when a participant provided their response and we did not employ a design strategy that would have provided that information. Hence, employing the Rasch multifacets model was not the appropriate model for these particular data (Linacre, 1994).
The one-parameter Rasch rating scale model takes the following form:
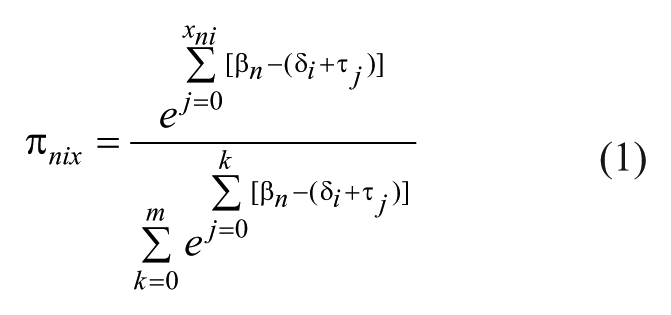
where π nix is the probability of person n responding in category x to scenario i where δ i is the location (scenario “difficulty”) of scenario i on the engagement variable; τ j is the location (“threshold” parameter) of the kth transition from one response category to the next for the m + 1 rating categories; and β n is the parameter for an individual’s “level of engagement.” These location estimates are reported in a logit metric (Ludlow, 1995; Wright & Masters, 1982). Higher scoring people (highly engaged) will have positive logit engagement estimates, and lower scoring people (minimally engaged) will have negative estimates. Harder, or higher level, engagement scenarios will have positive logit difficulty estimates while easier, or lower level, engagement scenarios will have negative estimates. As shown below, these person and scenario estimates simultaneously portray the structure of the Engagement variable and the location of each person along the variable. The WINSTEPS software package was used for the analyses (Linacre, 2012, V3.75.1).
Figure 1 contains the “variable map” for the Work Engagement Scenario Scale (PEP-WS). The scenarios (on the right of the vertical line) are ordered from easiest to be “much more engaged than X” (bottom of the map) to hardest to be “much more engaged than X” (top of the map). The participants are ordered from lowest scoring (bottom of the map) to highest scoring (top of the map). The “A” to the left of the vertical line represents the average level of engagement for the people (the average score was 34 or a logit of 1.6). The “M” to the right represents the mean scenario difficulty—which is set for statistical reasons at zero. By relying on WINSTEPS Table 20.1 we find how any one person’s raw score on the PEP-WS translates into an engagement level location on this map. For example, if a person had a raw score of 31, their “measure” would be .91 and they would be represented as one of the “X” marks adjacent to the “1” along the left side of the variable map in Figure 1.
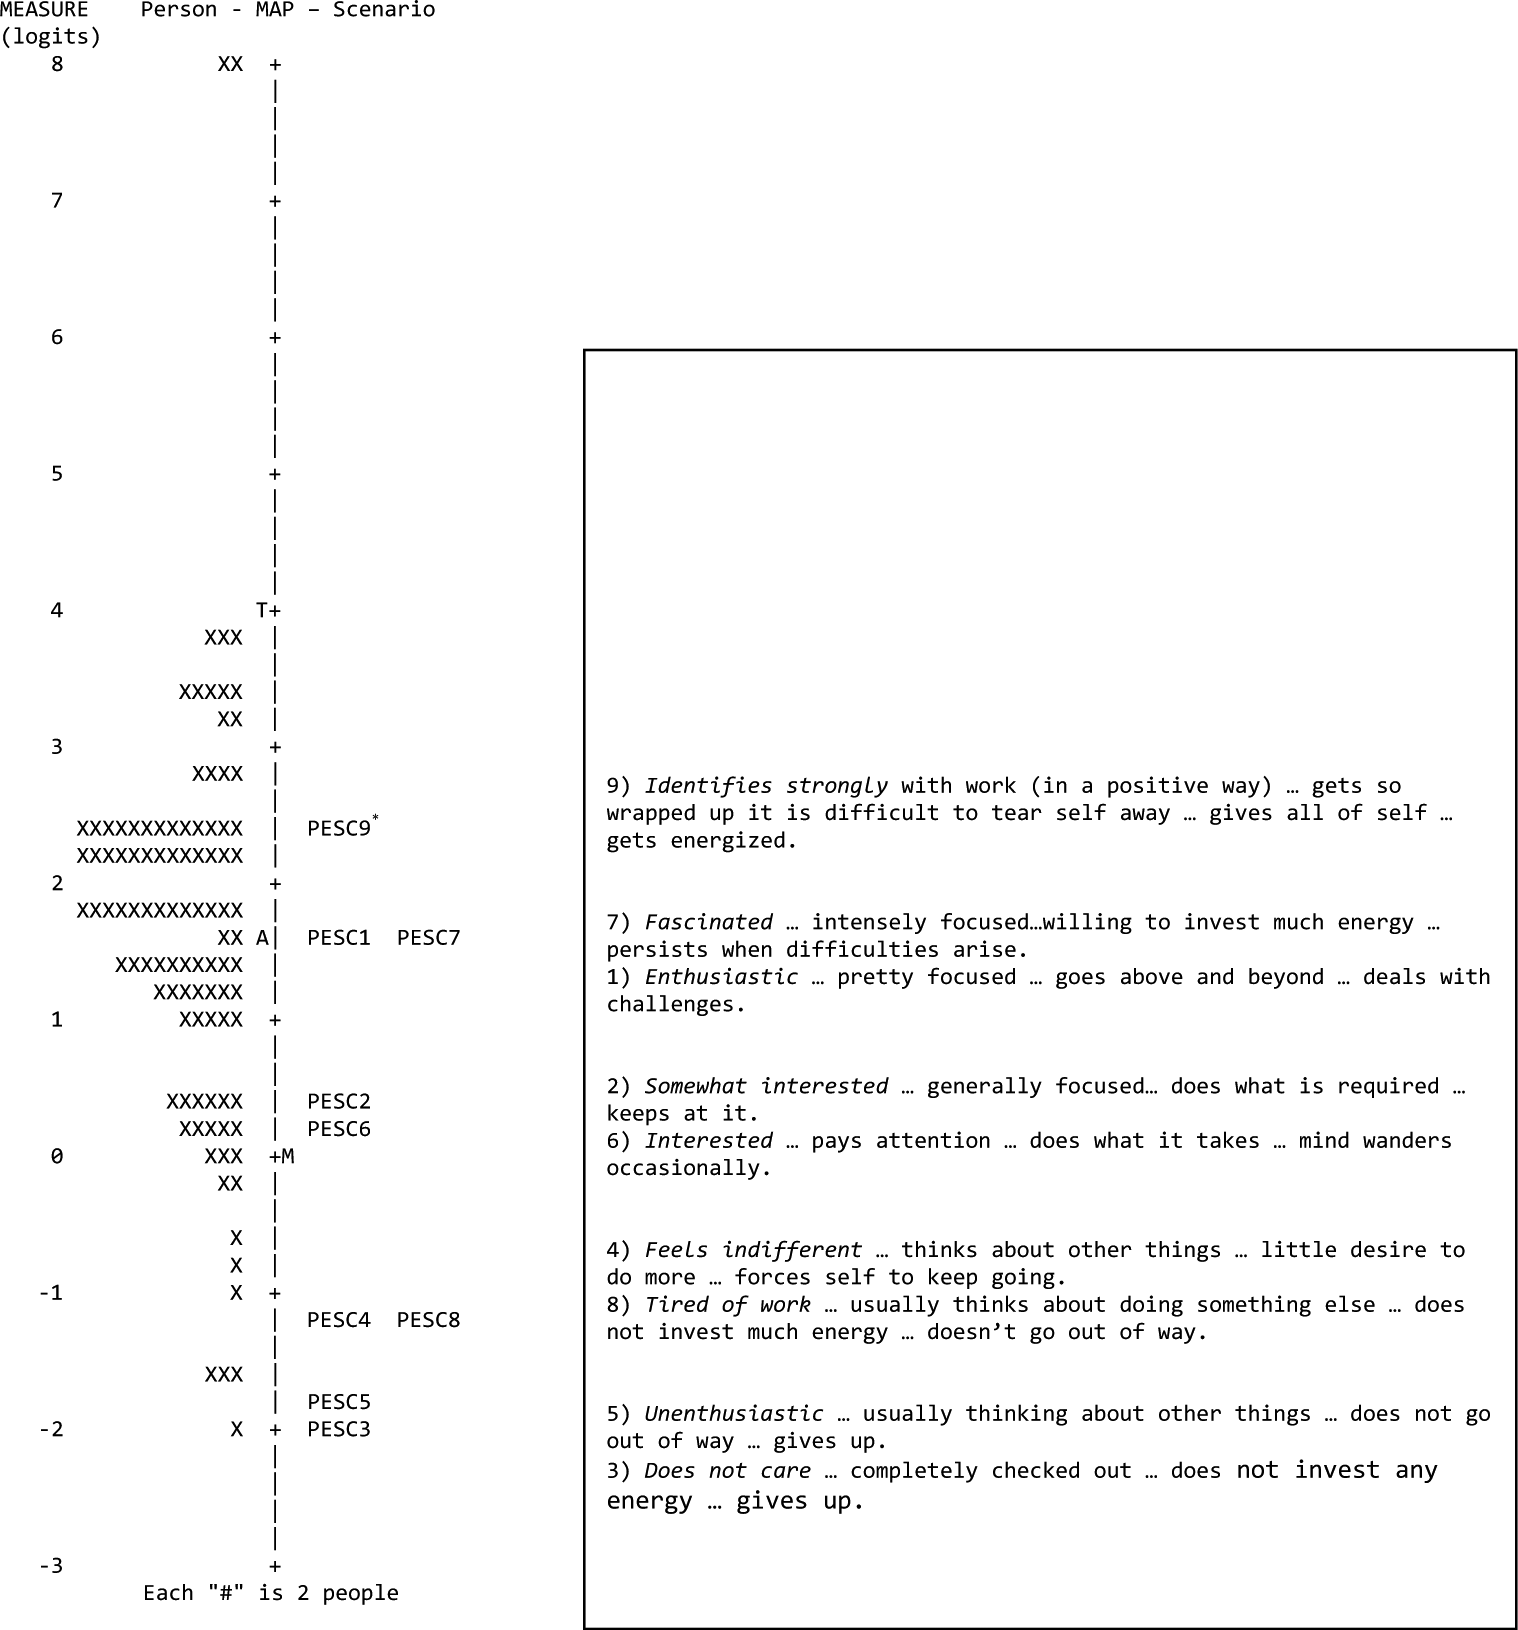
Work Engagement Scenario Scale: Structure.
Ideally, if our measurement purposes are met, we would like to see a “ladder-like” progression of relatively uniformly spaced scenarios moving from lower to higher levels of engagement. Although the distribution of the persons does not affect the estimation of the scenario difficulties, we would also like to see a wide uniform range of engagement levels representing persons who are not very much engaged at all to those who are highly engaged. Most important, however, we are concerned with whether these empirical results for the scenario difficulty estimates make substantive sense. In other words, is there a construct valid engagement scale here that defines a meaningful progression of scenarios along a continuum of easier-to-harder to be “much more engaged than X” levels?
As seen in Figure 1, starting at the bottom of the work engagement variable it is easiest to be “much more engaged than X” on scenarios PESC3 (does not care . . . ) and PESC5 (unenthusiastic . . . )—the italicized emphasis for simplicity of interpretation is on the Interest facet. These two are followed by slightly harder (more positive) scenarios PESC8 (tired of work . . . ) and PESC4 (feels indifferent . . . ). In the middle of the distribution of scenarios (at statistically the same location based on their standard errors) are PESC6 (interested . . . ) and PESC2 (somewhat interested . . . ). These are followed by harder scenarios PESC1 (enthusiastic . . . ) and PESC7 (fascinated . . . ). Finally, at the top of the figure scenario PESC9 (identifies strongly . . . ) defines the highest positive level on the productive work engagement variable because it is the hardest to be “much more engaged than X.”
It is clear that increasing degrees of Interest in one’s work is captured by the scenarios as they rise from the bottom of the scale to the top. The same can be said for Focus (completely checked out to difficult to tear self away), Energy (does not invest any energy to gets energized), and Perseverance (almost always gives up to gives all to work). It is encouraging and consistent with our Rasch scale development expectations that proceeding up the work engagement scale means engaging in increasingly deeper, more meaningful, and positive productive activities.
Figure 1 shows the mean location for each scenario based on the scenario’s total score across all participants. It does not reveal the location of different response categories, or the level of response, expected of a person to any one scenario at a given location. One way to reveal expected responses along the continuum is presented in Figure 2.

Work Engagement Scenario Scale: Interpretation.
Drawing on the WINSTEPS score equivalence table (Table 20.1) and Table 12.6(the so-called “Rasch-Thurstone thresholds map”—not shown), it is possible to describe what it means for any particular person to be at a particular level of engagement. Specifically, the horizontal lines in Figure 2 mark the sections along the engagement variable that correspond to average response scores of 1 through 5. No one had a total score that corresponded to an average of 2 or lower on the scenarios. There is a small group of people who had average scores between 2 and 3 and another small group of people with averages between 4 and 5. The largest concentration of people occurs between the averages of 3 and 4. An interpretation of these average scores is offered in the right-hand section of Figure 2.
For ease of practical application, Table 4 reproduces the text from Figure 2 and shows score ranges that may be utilized by any person who responds to the PEP-WS scale. In an intervention situation designed to engage people more fully in any of these four different roles, these qualitative interpretations based on a person’s estimated location on the PEP-WS engagement variable can be useful for charting changes in levels of engagement over time. If desired, a user of these scales could utilize these score ranges to develop descriptive terms that represented qualitativelydifferent levels on the engagement variable (Wilson, 2005).
Scenario Scale Score Translation Summary.

Note that the left margin of Figure 2 now consists of the raw scores instead of the logit estimates in Figure 1—all a user needs to do is add up their response scores and then find their location on the map. Because there is a nonlinear relationship between raw scores and logits the “distance” on the map between consecutive raw scores becomes larger in the ends of the distribution seen in the left margin of Figure 2.
Engagement Invariance
One of our goals was to define the construct of engagement in such a way that its associated measurement instrument would be invariant across roles. This means that the structure of engagement, as operationalized through the scenario wording and subsequent location estimates, would be the same for each role. Given that the scale structure for Work Engagement was consistent with a priori expectations, how well did the other three role scales fit the theory?
Figure 3 contains the variable maps for the work (Paid Employment SCenarios), caregiving (CGSC), informal helping (IFSC) and volunteering (VLSC) roles. A number of features are apparent in this figure: (1) across all four roles, SC9 is the hardest scenario, SC3 and SC5 are the easiest, and SC6 and SC2 are in the middle of the continuum; (2) SC9, SC1, and SC7 form a “cluster” at the top, SC3, SC5, SC4, and SC8 form a cluster at the bottom, and SC2 and SC6 form a cluster in the middle; (3) the average level of engagement for the people (“A”) is relatively high for each role but is highest for volunteering and lowest for caregiving; and (4) each set of scenarios has produced a desirable wide spread in the person engagement estimates. (Note: in particular, that there is no upper level ceiling effect where large numbers of people have responded with 5s on all scenarios.) In terms of a ladder-like arrangement of scenarios, the four scales each capture an identical progression from lower levels through higher levels of engagement and they have generated a range of person estimates that meaningfully discriminates between lower, moderate and higher levels of engagement.

All role scenarios.
This subjective interpretation of measurement invariance across the four roles was augmented by plots of the respective pairs of scenario difficulty estimates. Each plot represented a near identity between the pairs of estimates for each set of scales. Pearson correlations between the pairs of scenario estimates (ranging from .994 to .999) further support the conclusion that the scenarios operationally define a meaningful engagement construct that is consistent with theory and is independent of the specific role.
Category Characteristic Curves (CCCs)
CCCs display the probabilities of responding in each scoring category for any person on any scenario (Wright & Masters, 1982). From a measurement and instrument development perspective, the ideal pattern in the CCCs occurs when each response category is the expected response at some level of person-by-scenario interaction. This pattern occurs when the threshold estimates follow a strictly increasing order—as they do for each of the four scales—and the separation and spread in the CCCs and category threshold estimates (the τ j where the CCCs intersect) was excellent. This means the response categories are understood and are being used the same way regardless of role.
Goodness-of-Fit
Rasch fit analyses rely principally on person-by-item residuals—the difference between a person’s observed response on an item (scenario) and the estimated response expected under the model (Wright & Stone, 1979; Ludlow, 1983, 1986). A positive residual is associated with a higher than expected response; negative residuals result from lower than expected responses. Although a variety of statistical and graphical procedures are available for analyzing residuals a standard first approach is to consider summary statistics in the form of “mean squares” (Wright & Masters, 1982). A rich history of experience has developed around the general properties and utility of these statistics (see, e.g., the work of Richard Smith, 1991).
We started with the unstandardized, weighted mean square statistics because they take into account the variance of the expected response (the so-called “Infit MS” in WINSTEPS) and they tend to be useful for looking at the consistency of a person’s responses across all the scenarios. We also employed the unweighted mean square statistic because the nature of the response options and the novelty of the scenario items could prove distracting and problematic for some participants. Here the so-called “Outfit MS” is good at picking up unusual instances of particularly low or high scoring people providing occasional highly unexpected responses to a scenario.
Although there is great variation in the Rasch literature on suggested criterion values for these statistics, we often use a liberal criterion of +1.3 to flag potential problems. Such a small value may declare “too many” misfit problems but it will also minimize missing a potential problem—a crucial point in the development of a new instrument. These two forms of fit statistics are generally sufficient to reveal consistent unexpected responses either made to a scenario (“scenario fit”) or made by a person (“person fit”).
Table 5 contains the scenario difficulty estimates “d,” Infit MS, and Outfit MS for each scenario for each role. One of the first things to note in the table is that there is no apparent problematic “presentation order” misfit effect—higher misfit values do not tend to occur at the start or the end of the scenario sequence. In addition, there is no single scenario that demonstrates misfit across all four roles. What we do see, however, is that the easiest scenario (#3: does not care . . . completely checked out . . . does not invest any energy . . . gives up) elicited some unexpected responses for the Work and Caregiving roles (Infit = 1.4 and 1.58, respectively). And the hardest scenario (#9: identifies strongly with work (in a positive way) . . . gets so wrapped up it is difficult to tear self away . . . gives all of self . . . gets energized) elicited some unexpected responses for the Informal Helping and Volunteer roles (Infit = 1.58 and 1.49, respectively).
Item Fit Statistics.
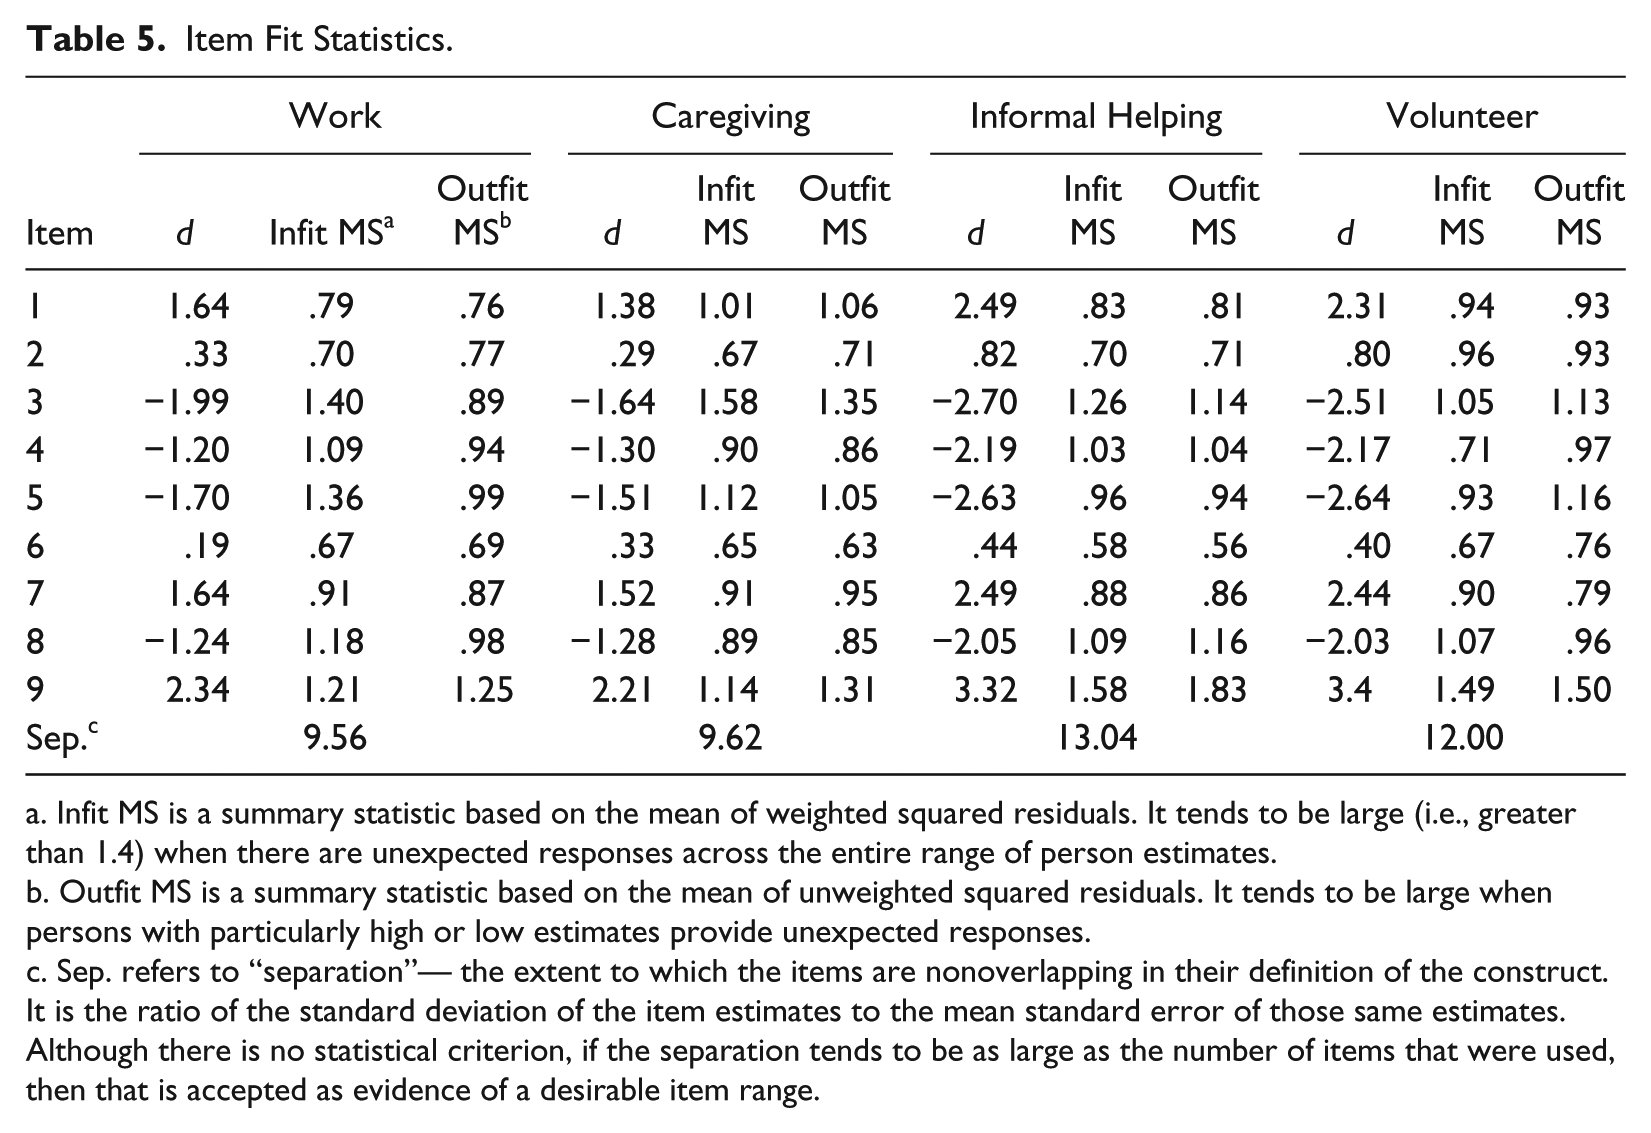
Infit MS is a summary statistic based on the mean of weighted squared residuals. It tends to be large (i.e., greater than 1.4) when there are unexpected responses across the entire range of person estimates.
Outfit MS is a summary statistic based on the mean of unweighted squared residuals. It tends to be large when persons with particularly high or low estimates provide unexpected responses.
Sep. refers to “separation”— the extent to which the items are nonoverlapping in their definition of the construct. It is the ratio of the standard deviation of the item estimates to the mean standard error of those same estimates. Although there is no statistical criterion, if the separation tends to be as large as the number of items that were used, then that is accepted as evidence of a desirable item range.
Typically, when a hard item demonstrates misfit it is because some low scoring people unexpectedly provided high scores. Likewise, when an otherwise easy item demonstrates misfit it is usually because some high scoring people unexpectedly provided low scores. Furthermore, when an item is fundamentally flawed in some way, it typically shows misfit across both the Infit and Outfit statistics—which these scenarios do not exhibit. Since the misfit for these two scenarios does not show across all four roles, we looked more closely at the observed responses, expected responses, and standardized residuals for the most misfitting people in order to shed some light on what might be happening on these two scenarios.
A variety of analytic tools are available in WINSTEPS, and other software such as SPSS, for investigating the extent to which systematic residual variation may underlie item and person misfit. We routinely employ the observed responses, expected responses, and standardized residuals reported in Table 7.1 (not shown). Looking across the response records for all persons with Outfit MSs > 1.2 (a very liberal choice for detecting misfit) on each of the four scenario scales, we identified four different patterns of unexpected responses: “erratic,” “start-up,” “matter of degree,” and “opposite.”
The “erratic” patterns are characterized by extreme unexpected low and high responses, that is, just the highest and lowest response categories and no “2” or “3” responses. Since the sum of primarily 1s and 5s will produce a mid-range total score, the expected values will tend to be around 3, and the resulting residuals will tend to be large. These kinds of unexpected responses to Scenarios #3 and #9 were exactly what contributed to the misfit statistics on these scenarios. We do not think these response patterns are the fault of the scenarios; rather, they seem to be a characteristic of a particular type of person.
“Start-up” patterns are common when people are faced with an unusual, novel item format and there is some initial confusion about how to understand and respond to the item. This can be reflected in either unexpected low or high responses to the first few items. Persons were found who had a “5” where a “2” was expected on the relatively difficult first scenario. It is plausible that their understanding of the “comparative” task changed as they took subsequent scenarios. This finding suggests that a “warm-up” scenario might be useful in a future version of the scales.
When polytomous response options, such as those in the present data, are used it is not unusual to find responses that are consistent with their general expectation but may still be unexpectedly high or low. This next pattern is called “matter of degree” because persons were found who had responses that were low as expected—but slightly lower (a “2” instead of a “3”), and high as expected—but slightly higher (a “3” instead “2”). We suggest this reflects a degree of unreliability in the person’s use of the response options that is independent of any feature of the scenarios.
The final pattern, “opposite,” occurs when there is an occasional response (in contrast to the “erratic” pattern) that is in the opposite direction than was expected. For example, persons were found who had responses of “5” on scenarios where a “2” was expected. This pattern may occur when an otherwise low or moderate scoring person has special knowledge, experiences, or circumstances that are not usually associated with a particular item. These situations may be investigated further when there is an opportunity for follow-up interviews or when sufficient demographic information is provided that some plausible hypotheses may be tested.
Probabilistic item response theory models, such as the present one, assume a random degree of unexpected response variation. When the unexpected variation is systematic, however, then the items must be investigated to remove or modify aspects of the items that have contaminated the measurement process. None of the patterns presented above are specific to a single role and no pattern fully explains the misfit on Scenarios #3 and #9. These observations suggest that the misfit observed on Scenarios #3 and #9 is relatively minor and due to interactions with particular people, not circumstances due to structural flaws in the scenarios.
Discussion
The overarching goal of the PEP project was to develop a definition and measure of engagement in paid and unpaid productive activities—specifically paid work, volunteering, caregiving, and informal helping—for use among older adults (Matz-Costa et al., in press).Toward that end, the present study introduced the development and implementation of a Rasch (1960/1980) comparative engagement scenario measure of engagement based on Guttman’s facet theory and sentence mapping procedures. Evidence presented here suggests, not only that the PEP scenario scales hold promise for illuminating the lived experiences of role involvement among older adults but also that a scenario-style item format can offer multiple advantages over the narrowly focused items typically seen in Likert-based scales.
Measuring Engagement in Later Life Activities
The results provide strong empirical support that (a) the psychological state of engagement can be conceptualized and measured on a meaningful continuum defining a unidimensional and hierarchical construct ranging from lower to higher levels of engagement; (b) the difficulty levels of the scenario items are invariant across diverse activities; and (c) the meaning of person scores along the continuum is independent of activity. These findings demonstrate the robustness of the engagement construct and its applicability to a broad range of productive activities. This is important because of the construct’s potential in helping to answer a looming question of great public health significance: Does having roles in one’s life that provide the opportunity for personal engagement serve to promote and/or restore positive health and well-being outcomes in later life? (e.g., Keilhofner, 2008; Rowe & Kahn, 1998; Svanborg, 2001). The present investigation contributes to the building of a nomological net (Cronbach & Meehl, 1955) for this important construct.
Furthermore, research has suggested that engagement is indeed a malleable state that can respond to targeted interventions (Heslin, 2010). Since scores on Rasch scales represent a person’s location within a carefully scaled series of items, one is able to directly interpret what a given score on this instrument means along with what it would take to move an individual from a given location on the scale to a higher one. Thus, the scenario scales can easily and meaningfully chart a person’s change in engagement at different assessment points—a scale characteristic that is particularly useful in the development of interventions (Mayhew et al., 2011). These scales can also be used in survey research or by practitioners in community or medical settings to assess the extent to which older adults are involved in roles/activities that enhance their physical, mental, and spiritual health and to identify opportunities and barriers to engagement.
Utility of Rasch-Based Scenario Scales
Analysis of the PEP scenario scales supports further development of scenario-style items as a broadly applicable measurement approach. Given that engagement was theorized as a unidimensional but complex construct where a higher level of engagement is characterized by high interest, focus, energy, and perseverance, these four facets of engagement were assumed to function simultaneously in defining a hierarchy of intensity that progressed along a continuum. Indeed, psychometric results from our Rasch scenario approach based in facet theory and sentence mapping supported this assumption and produced what can be seen as a powerful alternative to the narrowly focused item description typically seen in Likert-based scales.
During item generation and pilot testing, it became apparent that engagement was a “you know it when you see it” construct—which is true of many psychological or social constructs. Most people could readily and easily describe what they typically think and feel when they are highly engaged in an activity, and most people could describe what they typically think and feel when they are not so engaged in an activity. However, it was much more difficult to come up with a discrete, concrete set of Likert-style items that seemed to fully describe these states. Results suggest that a scenario approach, which describe a series of hypothetical people or situations that respondents are asked to relate to, can work well when applied to a measurement task where the concept is complicated, as is the case here, and where attempts to produce more concrete individual items tend to be simpler but no more valid. Furthermore, within the Rasch measurement framework, the opportunity to define a person’s location in terms of a comprehensive, rich, qualitative description removes some of the arbitrary subjective narrative construction that occurs when items located near a person are combined as though they constituted a scenario in the first place.
Finally, the incorporation of a hypothetical person into the scenario (i.e., respondents are asked to answer in terms of whether they were more or less engaged then the hypothetical person on a 5 point scale ranging from “much more engaged than Person A” to “much less engaged than Person A”) emphasizes the practical utility of this approach. Given that many positive psychological constructs suffer from what might be described as an acquiescence bias or social desirability bias, this scenario response format seems to help mitigate against this tendency by depersonalizing the items somewhat.
Future Research
The foundation developed in the current article creates fertile ground for future research efforts in this area. First, it is important to point out that the utility of a measure does not necessarily guarantee the validity of the construct on which it is based. While creating a self-report measure that is reliable and differentiating represents one step in validating the engagement construct, there are several potential next steps in validating the construct as well as the PEP scenario scales. Future research might test whether the hierarchy developed in the current research can be validated in relation to other self-reported measures (e.g., measures of work engagement), momentary measures of engagement, or the judgment of an expert observer. One could also examine the extent to which PEP results predict engagement-related behavior, such as role performance, desire to remain involved in the role, or overall health and well-being. Although we could not locate any clinical or physical criterion standards for validating a self-report measure of engagement, some research suggests that developing such standards may be possible. Building on neuroscience research that has begun to provide insights into the neurological drivers of behavior in the social environment (e.g., Lieberman & Eisenberg, 2008), Rock and Tang (2009) propose a series of brain-body biological markers that could be used to measure the engagement state objectively, including those assessed through neuroimaging (i.e., fMRI, PET, EEG), skin conductance response, and heart rate variability. These domains represent future research arenas for validating the engagement construct and the PEP scenario scales put forth in the current article.
Second, while the PEP scenario scales were created with older adults in mind, they could be used by adults of any age. Future research should test whether the scale is reliable, valid, and psychometrically equivalent when used with younger and midlife adults. The sentence mapping approach we employed is particularly powerful for guiding the development of computer-based automatic item generating algorithms (Gierl & Haladyna, 2013) that would generate potentially limitless variations of age-appropriate scenarios through the replacement of (a) proper names and (b) phrases and key words written as interchangeable alternatives at the three levels of intensity for each of the four facets. This approach to scenario development, in combination with computer adaptive testing principles (Linden & Glas, 2010), could lead to the construction of short-form scales (in contrast to their present long-form structure) consisting of a minimal number of “on-target” scenarios to administer, say 3 or 4, hence reducing the response burden across the four roles.
Finally, our scenario approach for capturing role engagement could be useful in helping people at various life stages to decide on prioritizing life roles and reflecting on the extent to which their current engagement levels differ from their desired engagement levels. Such an exploratory tool would be useful in a wide variety of settings, including career counseling and life coaching. Future studies should assess the utility of the PEP scenario scales as a tool for guiding independent or counselor-guided reflection on what might be small or large changes in one’s existing role portfolio that would allow for a deeper, richer day-to-day experience.
Footnotes
Declaration of Conflicting Interests
The author(s) declare no potential conflicts of interests with respect to the research, authorship, and/or publication of this article.
Funding
The author(s) disclosed receipt of the following financial support for the research, authorship, and/or publication of this article: This work was supported by a grant from the Alfred P. Sloan Foundation’s Program on Workplace, Work Force and Working Families to the Sloan Center on Aging & Work at Boston College (Grant Numbers 2008-6-15, 2011-6-23); the Boston College Institute on Aging; the Graduate School of Social Work at Boston College; and a Boston College Research Incentive Grant.