



Abstract
Following the 2011 wave of political unrest, extending from the Arab Spring to the UK riots, the formation of a large consensus around Internet censorship is underway. The present paper adopts a social simulation approach to show that the decision to “regulate”, filter or censor social media in situations of unrest changes the pattern of civil protest and ultimately results in higher levels of violence. Building on Epstein's (2002) agent-based model, several alternative scenarios are generated. The systemic optimum, represented by complete absence of censorship, not only corresponds to lower levels of violence over time, but allows for significant periods of social peace after each outburst.
It’s time we heard a little bit less about the economic and sociological justifications for what is in my view nothing less than wanton criminality.
Boris Johnson, Mayor of London, Clapham, 9 August 2011
We are not social scientists. We have to deal with urgent situations.
Paul McKeever, Police Federation Chairman, SkyNews, 11 August 2011
The Political Role of Social Media - Moving away from Double Standards
In the wake of August 2011 outburst of civil unrest in the UK, several voices from the mainstream media and diverse political figures, from London Mayor technology adviser Mike Butcher 1 up to Prime Minister David Cameron himself, 2 have pointed the finger at social media use as playing a major role in the riots.
Meetings between government officials and representatives of the main social networking platforms involved (Facebook, Twitter and BBM) were held to establish guidelines for a more stringent regulation of social media and Internet communication in general, to avoid tactical use of mobile networks by riot “flash mobs” or to counter online social influence mechanisms. The Internet kill switch solution (temporary shutdown of entire telecommunication networks), infamously and ineffectively attempted in Egypt during the January 2011 revolutionary outbreak, was also proposed.
The parallel between the regulating frenzy of Britain’s Conservative government and the disastrous electronic censorship of Hosni Mubarack’s dying regime highlights the utterly ambiguous attitude of the European political establishment and mainstream media towards Internet social communication. In a (regrettably not infrequent) display of duplicity, the same information technologies that had been presented as tools of liberation in the height of the Arab Spring, have been portrayed as threats to the very values of freedom and peace that Western governments allegedly stand for.
So the question of why social media would bring democracy to developing countries and anarchy to Western ones remains open. Some analysts interpret this contradiction as a strategy which, by creating a climate of moral panic surrounding popular culture, distracts from, and smoothes away, the societal issues underlying the uprisings (Fuchs, 2011).
These arguments received a cold welcome from British authorities, worried that “economic and sociological” explanations of the 2011 events would be used as “justifications” of more and more confrontational means of political dissent. The positions expressed by Conservative politicians prompted diverse reactions in the academic community. The presidency of the British Sociological Association maintained that systemic factors (such as social and economic inequalities or racism) account for macro-behaviours of “irrational” crowds participating in the riots. 3 Others, like some of the participants in the Academy of Social Sciences October 2011 seminar, 4 insisted on compliance to norms as a key element in determining individual propensity towards civil violence. These distinct approaches to the explanation of social behaviour, and to personal responsibility, challenge and complexify the reductive portrayal of social sciences as a homogenous ethos of liberal apologists of the riots.
Authorities’ abstract denunciation of social researchers is, in this sense, not representative of the range of positions expressed within our scientific community. Acknowledging the variety of these reactions can be considered the first step towards a more informed formulation of the present paper’s research question: what can we, as social scientists, say about the role of social media in assisting or even encouraging widespread political conflict? Very little, it may appear, insofar as data on actual social media use and traffic were only sparsely available during the UK riots. In the aftermath, large amounts of data and messages automatically harvested via social media were made available to some researchers and journalists. 5 Yet the limitations of such privately owned “big data” (in terms of cost, completeness, and ethical viability) are increasingly highlighted by the scientific community. 6
To deliver a robust, insightful explanation of such complex social processes, we adopt an innovative ethno-computational approach, relying on an empirically-informed agent-based social simulation. This methodology, proposed in Tubaro and Casilli (2010), is based on three tenants: 1) collecting a small set of qualitative data touching on the target social process; 2) using these data to define a set of behavioural and relational rules for a population of artificial agents implemented in a computer-based environment; 3) generate scenarios that enable exploring the implications of these rules by simulating iteratively interactions among these agents.
For the purpose of this research, given specific time and ethical constraints, 7 we have relied on a “rapid ethnography” as outlined in Millen (2000), using few key informants, capturing rich field data through observation at multiple and interactive points (both onsite and via electronic media), and collaborative qualitative data analysis (notably comments to our blogs and social media profiles).
The resulting computer-generated socially consistent scenarios have led us to detect and assess key factors coming into play within the specific process under investigation. One of these factors is the use of social media to organize flash mobs and to build field awareness in urban uprising settings.
The present paper aims to show that the decision to repress or censor social media in a situation of civil unrest – beyond the negative cultural consequences of repression of freedom of expression – is suboptimal even as to its expected impact on civil violence.
Epstein’s Civil Violence Model (Revisited)
Social scientists have been modelling civil violence via agent-based simulation for almost a decade now. 8 One major contribution – upon which our own simulation model will build – is contained in an article published by Josh Epstein in 2002 (Epstein, 2002). Epstein’s model, like all agent-based simulations, is a game-like computer model based on a set of simple rules – and generates complex results. Basically it describes a society where there is only one type of social agent (represented by circles in Figure 1). Of course this is an oversimplification, but one which is functional to avoid political splits between insurgents and law-abiding citizens (“looters” and “clean-up campaigners”, “gangsters” and “community heroes” in the rather crude characterisations often adopted by UK Conservative milieus in August 2011). Epstein’s standard social agent is an ideal-typical individual that can, according to his/her context of social interaction, adopt a violent style of expression of political dissent.
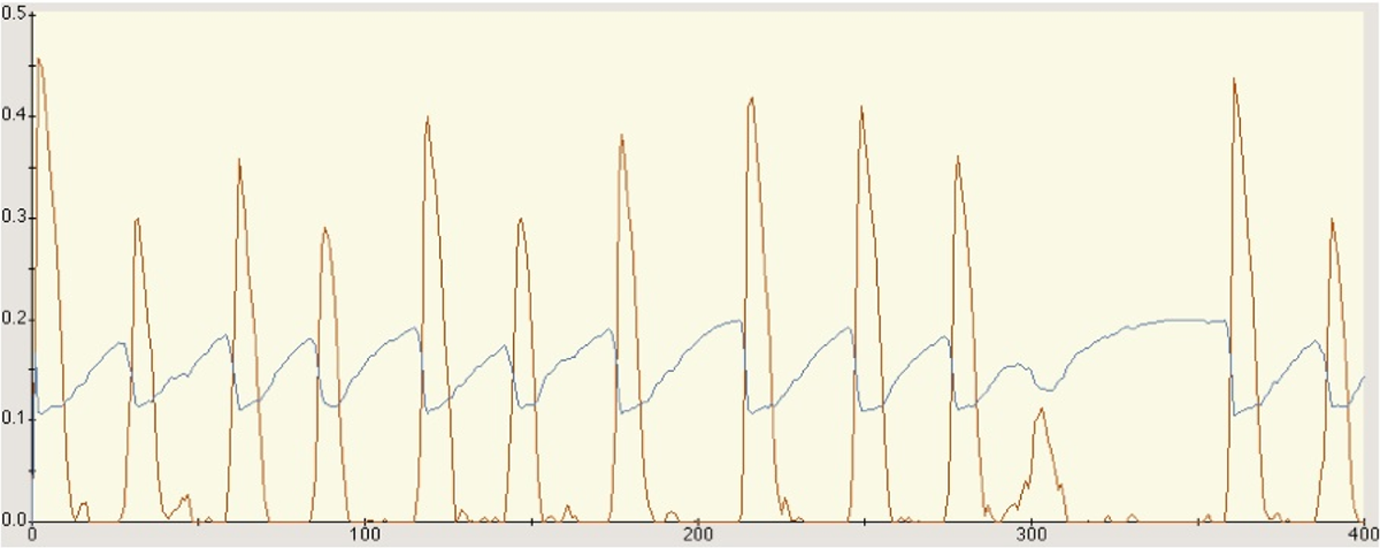
A typical civil unrest pattern-outbursts of violence punctuate long periods of stability when political tension is building up.
The agent’s behaviour is influenced by several variables, the first one being its personal level of political dissatisfaction (“grievance”). This can lead the agent to abandon its state of calm and become an active protester. However, the decision to act – whether it is to go on a looting spree or to engage in violent demonstrations – is conditioned by the agent’s social surroundings (“neighbourhood” in the model’s language). Does it detect the presence of police in the surroundings? If the answer to this question is “no”, it will act. If the answer is “yes”, another question is asked: is this police presence counterbalanced by a sufficient number of actively protesting citizens? If the answer to this second question is “yes”, then the agent acts. Sometimes, in an utterly random way, one of the active citizens gets caught by the police and is sent to jail for a given period of time. Again, the apparent simplicity of this rule is sadly consistent with the many episodes of arrests in confused and sometimes arbitrary round-ups, triggered by the UK government’s adoption of a hard line in dealing with riot repression.
The model takes into account other factors that might mitigate civil violence, such as government legitimacy and the perceived risk of being arrested. Agents have the possibility of moving from one place to another on the social grid to team up with other protesters and engage in coordinated actions. This point will be specifically addressed in the next paragraph, given its significance to the tactical use of social media. 9
The main result of Epstein’s model is that, in a typical situation, civil violence does not look like a linear progression. Naïve visions of political conflict as a cumulative process, where confrontation escalates until a regime is toppled, turn out to be fallacious. Times of unrest bring forth what Epstein describes as a “punctuated equilibrium” (see Figure 1): long periods of stability, where rebellion is smouldering, are followed by short violent outbursts.
Another variable, which Epstein called “vision”, turns out to be crucial. Vision is an individual agent’s ability to scan his/her neighbourhood for signs of police officers and/or active protesters. The higher the vision, the greater the agent’s awareness of its surroundings, and the range of possible actions available.
In 2004, Uri Wilensky built an adaptation of Epstein’s original model for the agent-based simulation package Netlogo, making it freely available online (Wilensky, 1999, 2004). Taking his contribution as a starting point, we have developed a new version of the model, 10 also programmed in Netlogo, to evaluate the tactical use of social media to create flash mobs deployed in a situation of civil violence.
Our innovation with respect to the original model is twofold. Firstly, we have reinterpreted “vision” in terms of censorship – with high levels of vision corresponding to low censorship, and vice versa. Secondly, and more importantly, we have modified the consequences of “vision”. In the original simulation, agents and police officers move to randomly chosen places within their vision range. Conversely, in our model a different rule has been introduced to make agents move to places in their vision range that are surrounded by the maximum number of active protesters. 11 This simple change simulates the behaviour of individuals involved in civil unrest, using BBM or Twitter to detect, and to converge in, hot spots. The result of the modified model is thus consistent with the tactical use of mobile technologies by protesters to gain a situational advantage over police forces and have a better awareness of the field, its resources and possible weak spots. If the value of vision is higher (as in a situation where online networking tools are widespread and not censored), each agent has fairly complete information as to what is going on even in remote locations. If social communication is censored, the value of vision is lower, and agents have partial or non-existent awareness of their surroundings and tend to move randomly.
Internet Censorship - A Source of Protracted High-level Violence
Our social simulation code reproduces the functioning of a social system (presumably an urban setting, such as a city or a borough) over a relatively long period of time (in practice and for modelling purposes, 1,000 time steps), 12 for different values of the parameter vision caeteris paribus (see Table 2A in the Appendix A). Graphically, the Netlogo implementation of the model represents social agents as grey circles, all the more dark as their levels of grievance are high. Active protesters turn black and jailed protesters take the shape of a cross; police officers appear as triangles (Figure 2).
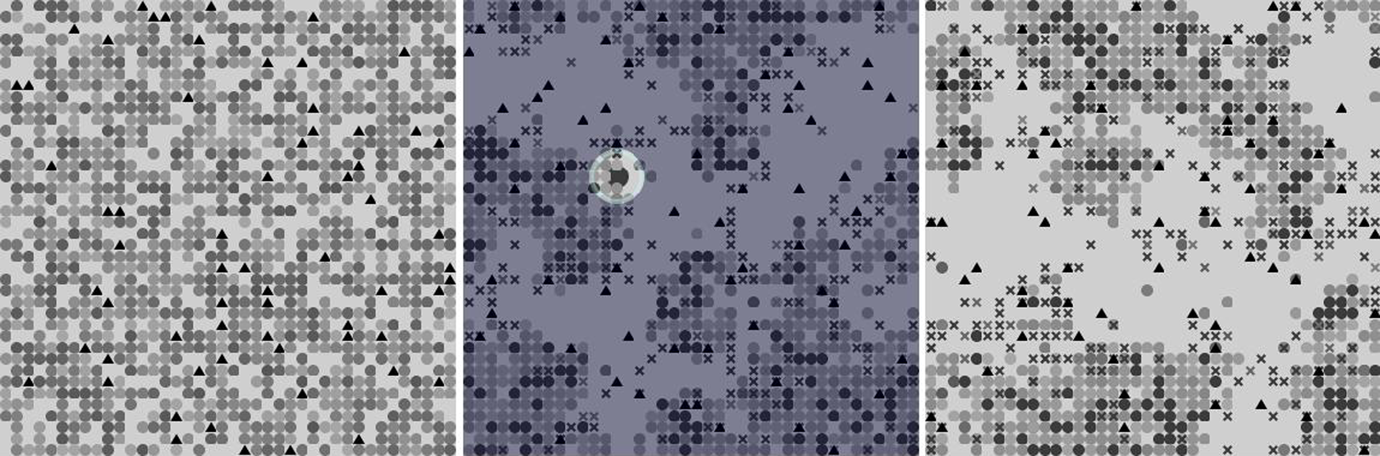
A hypothetical social system, as can be represented graphically in the model, at time 0 (left panel) and after some time steps (central and right panels). Circles represent social agents, whose level of grievance is indicated by lighter or darker shades of grey. Active protesters are coloured black and jailed protesters are shaped as crosses. Triangles represent police officers; light grey areas are empty.
Running the model several times generates alternative scenarios (Figure 3), and allows the comparison of outcomes of lower or higher values of vision – indicating the effects of more or less censorship of social media.
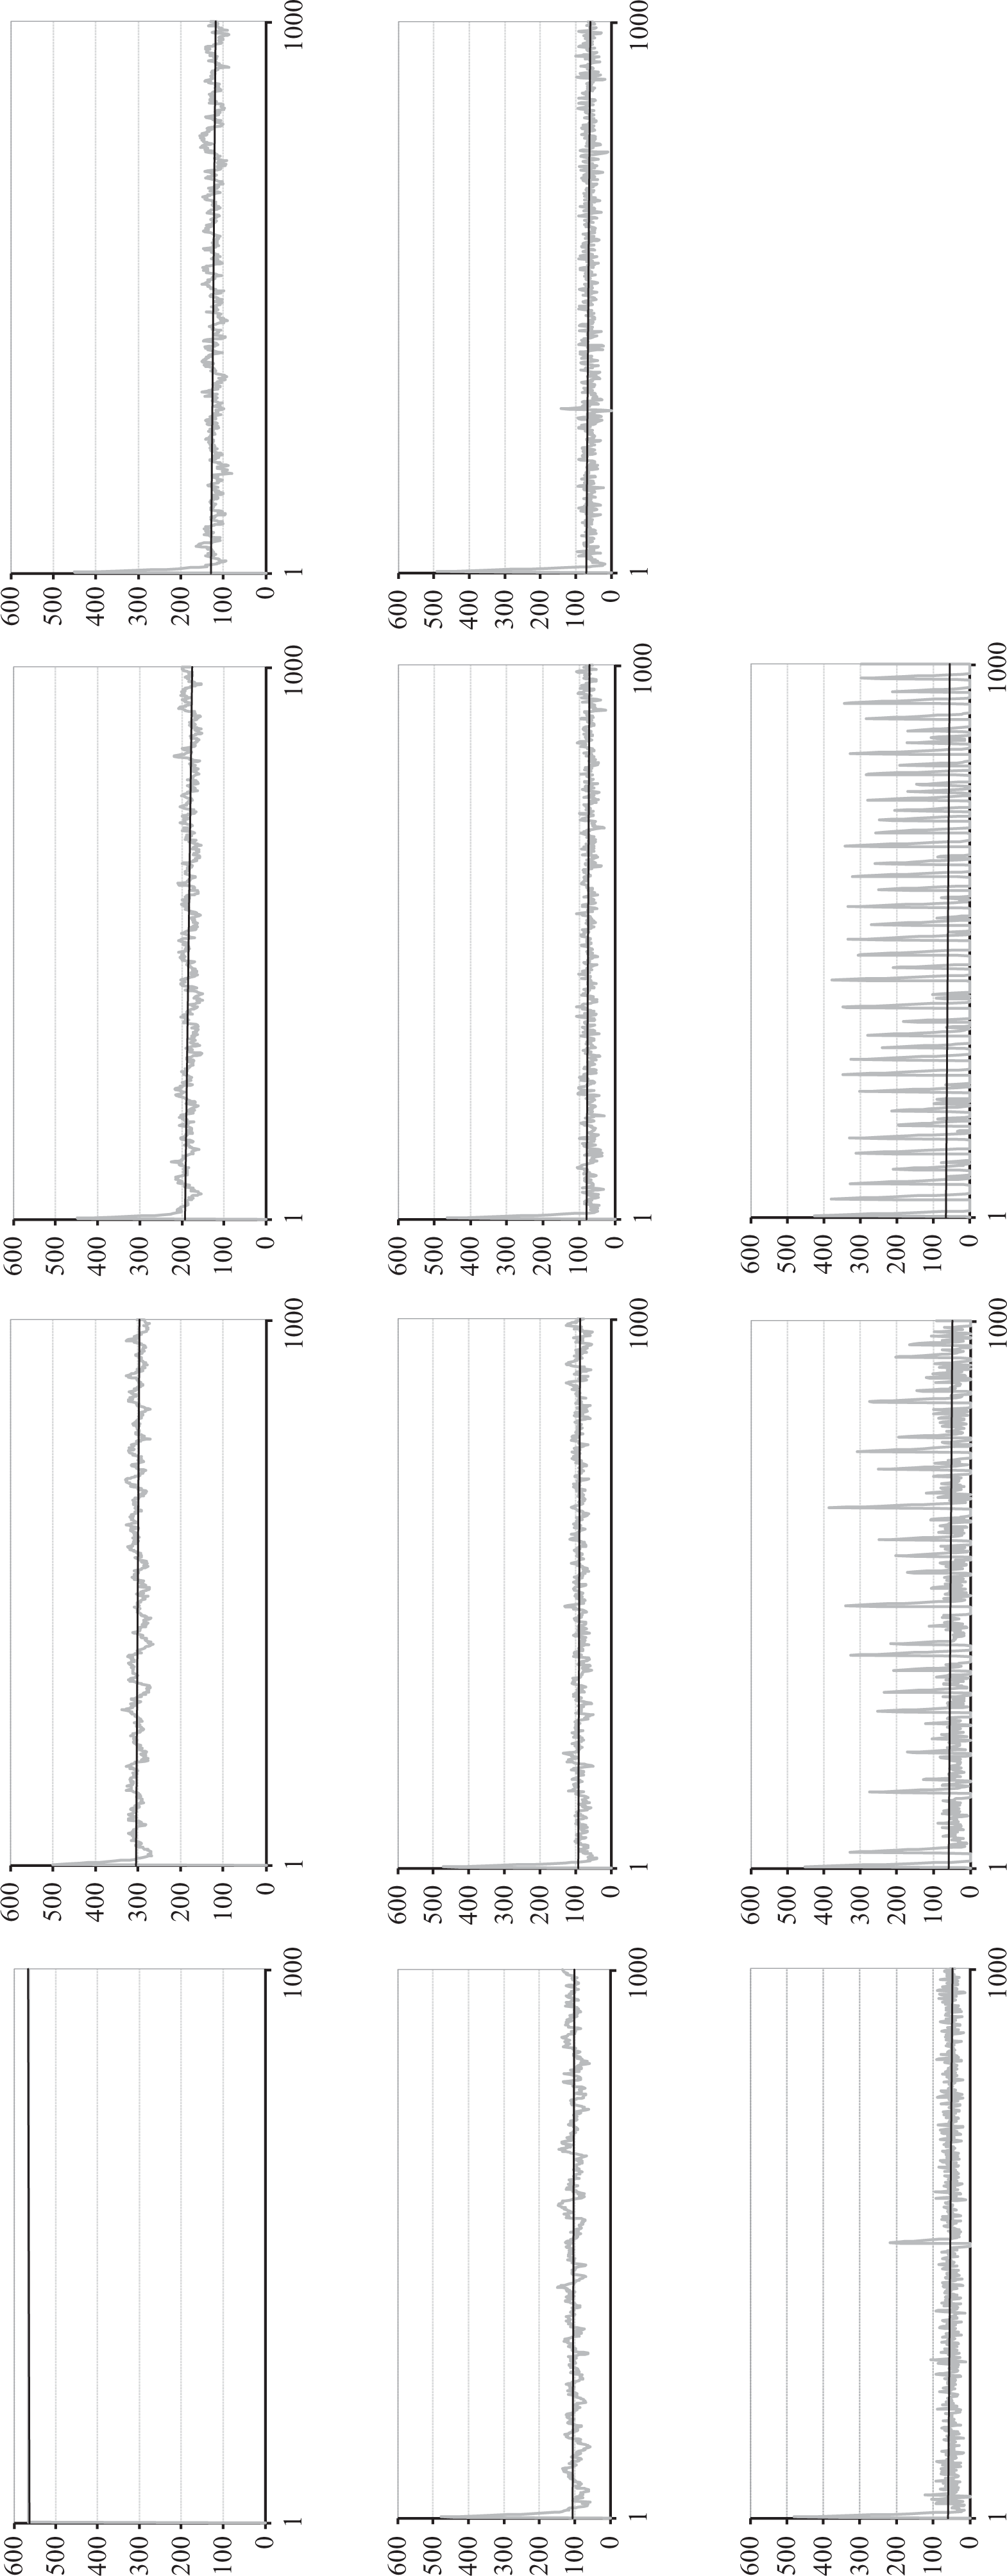
Grey patterns represent number of violent protesters over time with different levels of social media censorship: from 0 vision (total censorship, upper left corner) to 10 vision (no censorship, lower right corner). Trend lines are in black. Time is measured as number of steps (1 to 1000).
Different patterns of civil unrest over time are generated by different values of vision. All scenarios display an initial outburst, but the subsequent evolution of the overall number of agents engaged in active violent behaviour (grey line) is influenced by the level of censorship government applies on social media. In the case of total censorship (vision = 0), the level of violence stays at its maximum virtually forever (a scenario reminiscent of the Egyptian situation, where an escalation of protests followed the decision to block Internet access). The other cases correspond to less and less censorship. Values between 1 (almost complete censorship) and 9 (almost no censorship) correspond to different levels of protracted civil unrest: the stronger the censorship, the higher the average level of endemic violence over time (best linear fit represented by the black lines in Figure 3).
The last case, corresponding to highest vision (and thus virtually no censorship) deserves further comment. Apparently this situation is characterised by incessant high-level outbursts of violence, with peak active levels that seem to be even more sizeable than in other cases. Yet, the average level of violence over time (black fitting trend line) remains among the lowest. Moreover, if we want to measure the magnitude of violent outbursts, their peak active level is not an appropriate measure. Looking at time intervals between outbursts, at the duration of outbursts, and at the level of “social peace” between outbursts, helps us discover that this scenario is actually the systemic optimum. In the absence of censorship, agents protest, sometimes violently, nevertheless they are able to return to significant levels of calm (number of quiet agents in Figure 4), when social unrest is halted.
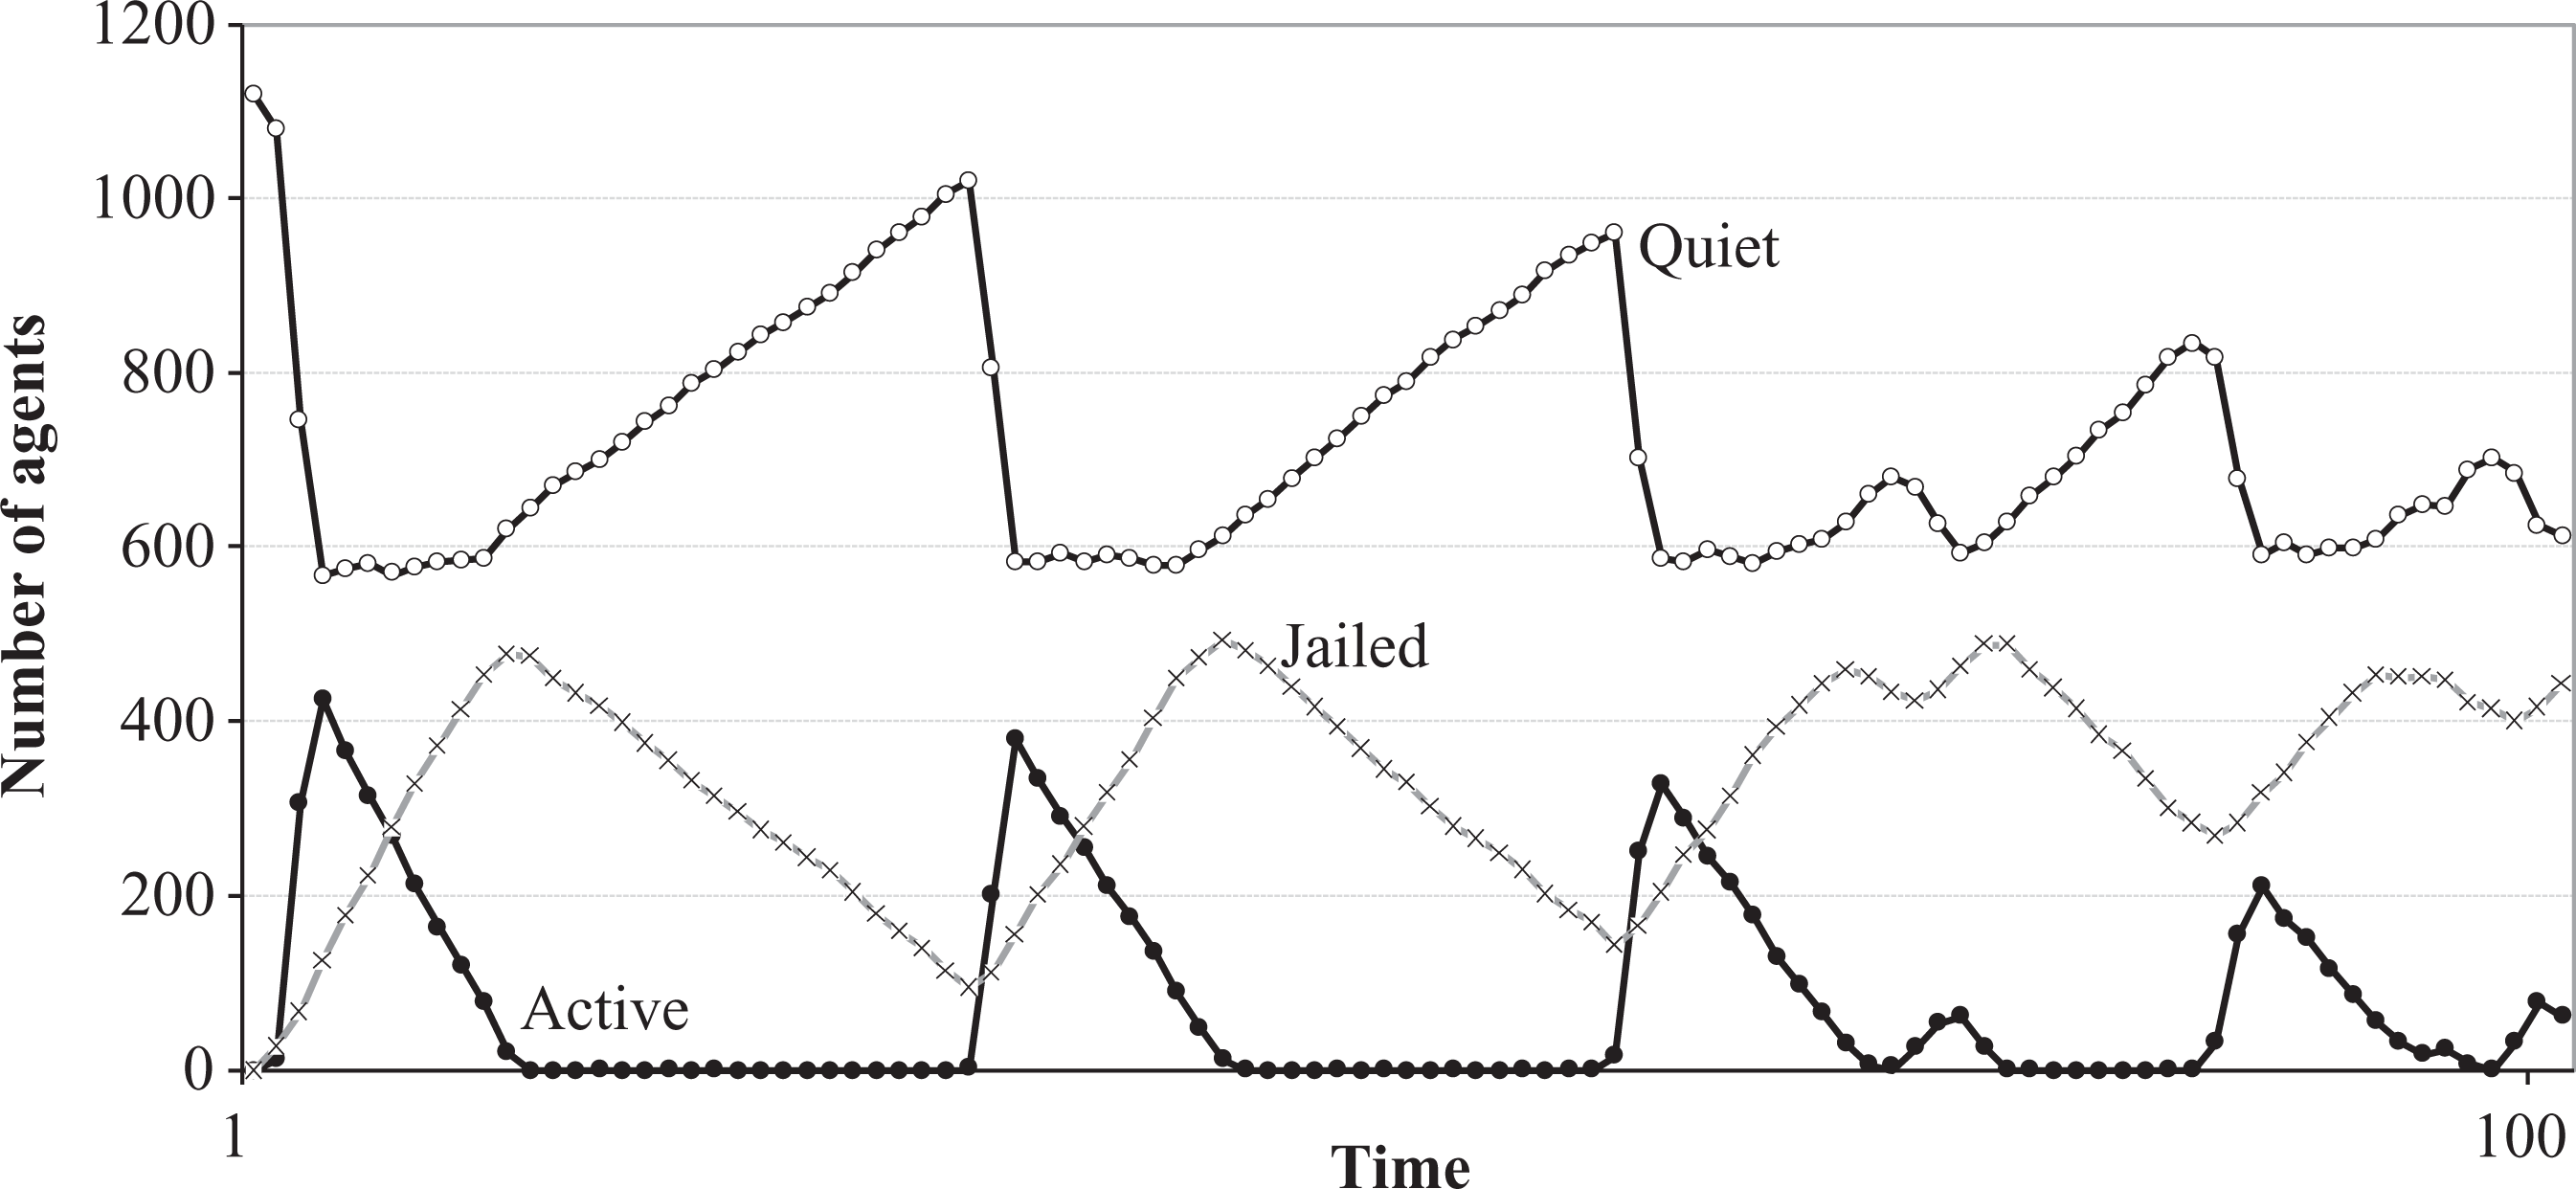
In the absence of censorship, high levels of social unrest are possible (see peaks in number of active agents), but between uprisings, there is a return to significant levels of calm (number of quiet agents).
This is the only scenario where active protest drops to zero for extended and repeated periods of time (see Table 1A in the Appendix A). Although this situation – consistent with what Epstein described as “punctuated equilibrium” in his original model of civil violence – does not seem to match a complete and consistent (and empirically unlikely) “social peace”, it still corresponds to a state where citizens are free to voice their dissent on social media, to coordinate their efforts and act about it – albeit in confrontational ways – while still enjoying a higher level of calm over time (see Figure 5).
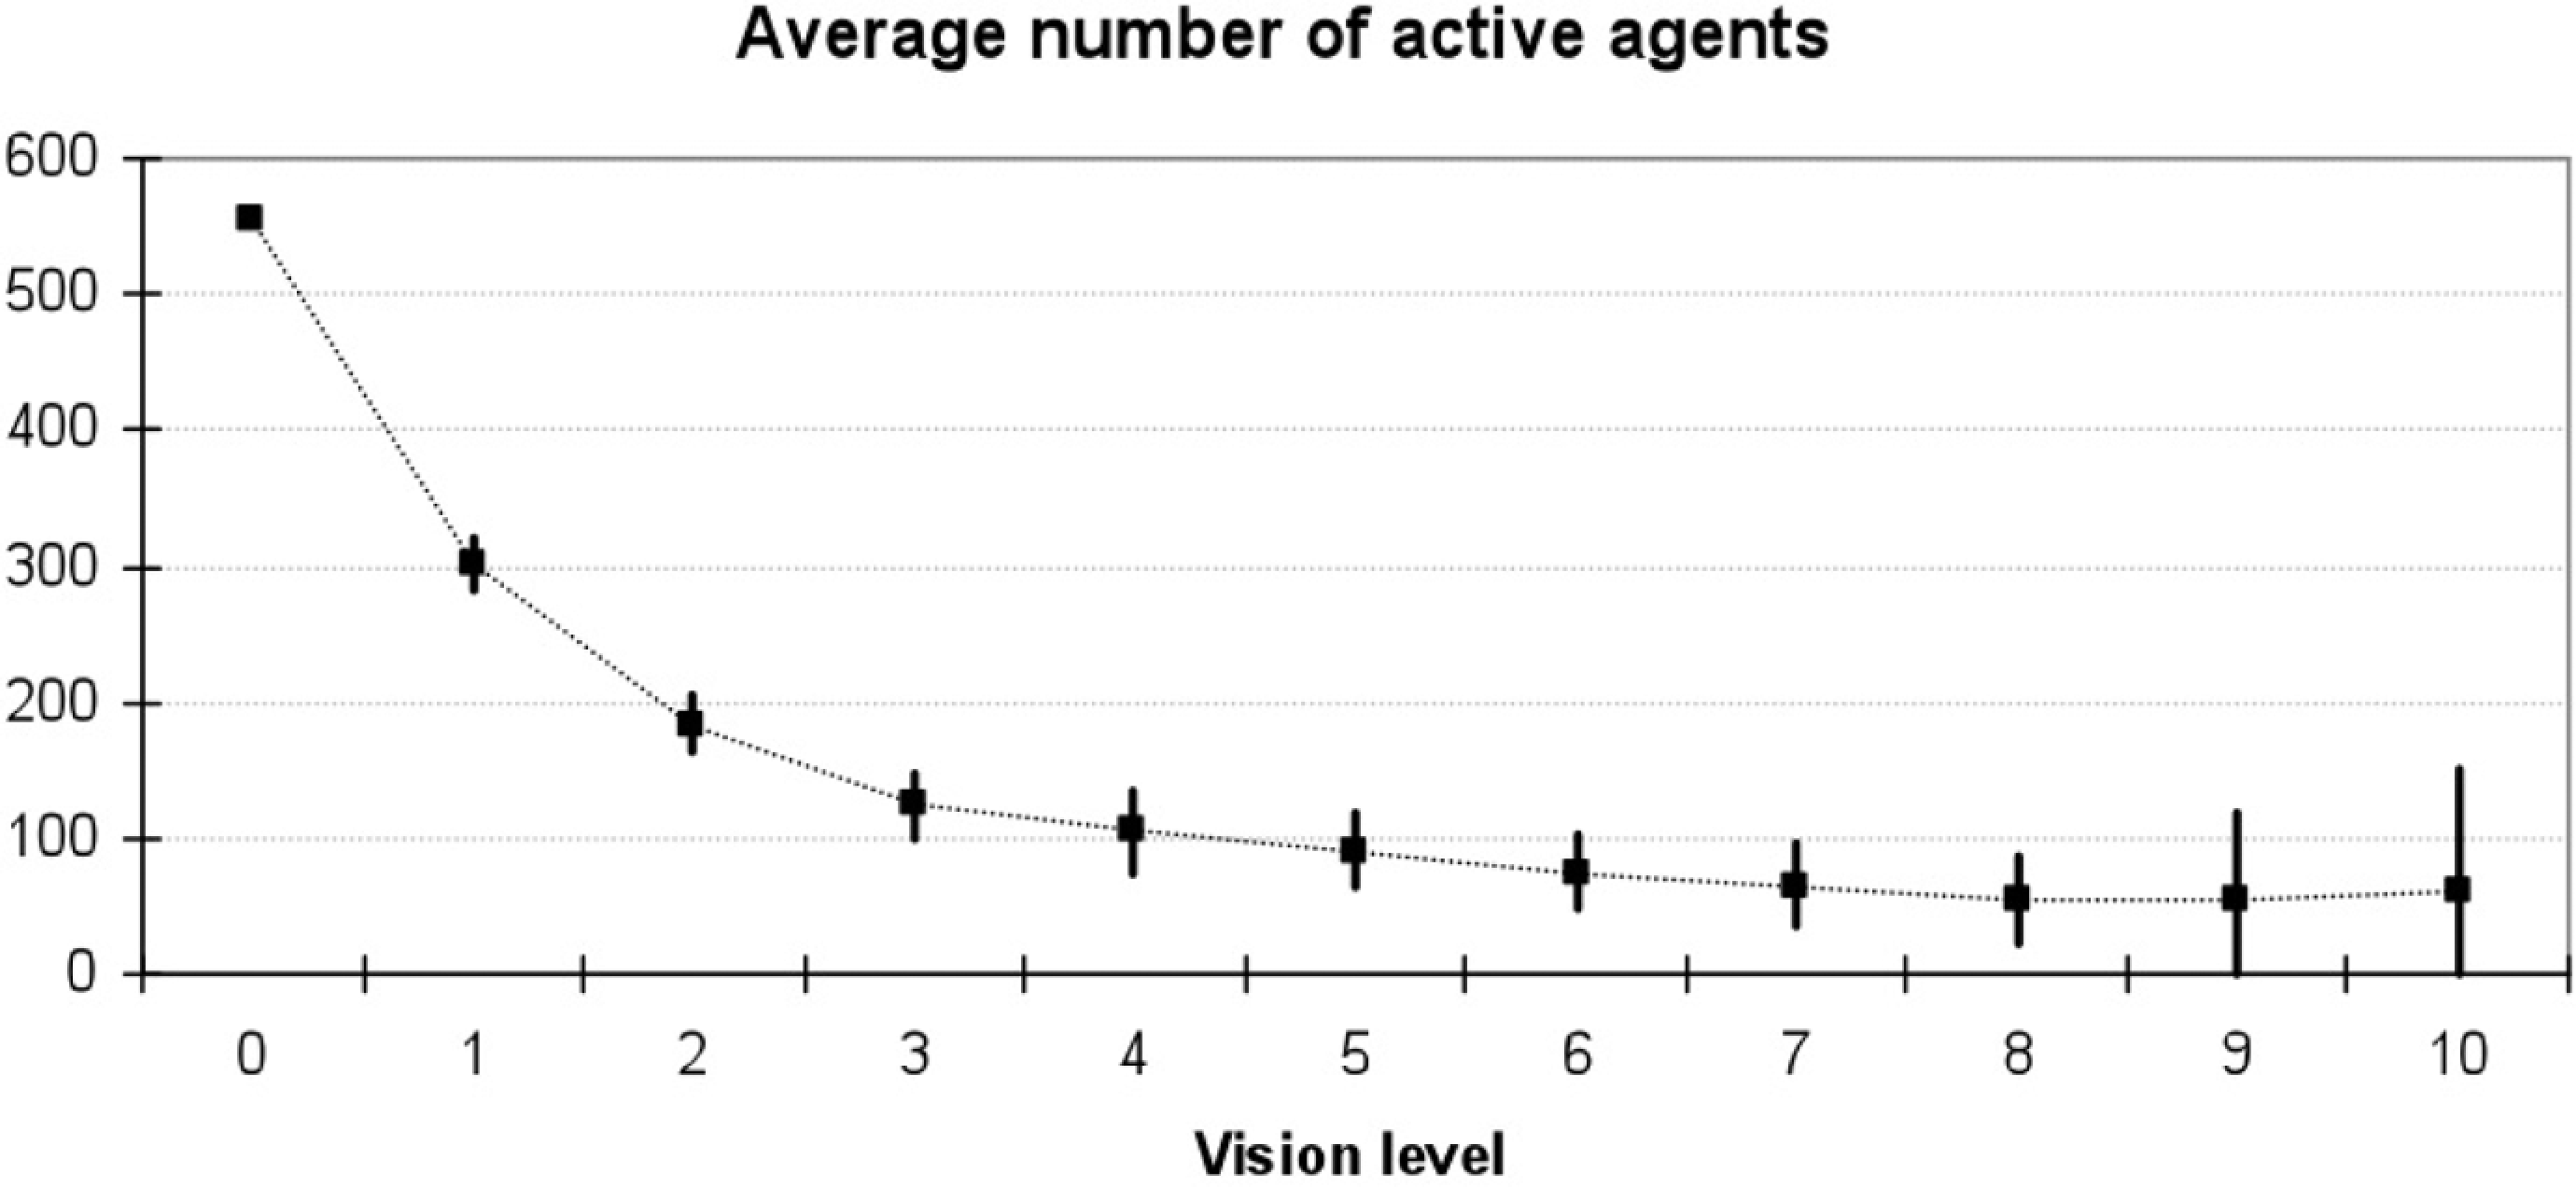
Average and variability of levels of civil violence (measured by number of active agents) as function of levels of censorship. Higher vision means less censorship and implies less civil violence.
Why Absence of Censorship Is Better Than Moderate Censorship
To better assess the implications of this finding, it is useful to look more closely at the average number of agents who are active (a proxy for the overall level of civil violence), quiet (not taking active part in protests) and jailed, for each possible level of censorship.
Recall that one feature of the model is the presence of police officers, who can arrest protesters and keep them in jail for some time; one might therefore ask whether lower levels of violence correspond simply to having many agents in jail, so that unrest might restart as soon as they get out. 13 Figure 6 above shows that this is not the case: while the average number of jailed agents increases with vision up to a certain point (about 7-8), it then decreases again; and the number of agents that do not participate in protest remains stable up to about the same level of vision (of 7-8), then slightly increases. This result shows that the lower levels of civil violence that are observed under conditions of highest vision (and, equivalently, least censorship) are due to the choice of agents themselves to remain quiet, not to repression by the police forces.

Average number of active, quiet and jailed agents as a function of levels of censorship. Higher vision means less censorship and implies less civil violence. The total number of agents is constant across all simulations, and over time.
Based on these remarks, another important point can be clarified. Arguably, the level of civil violence is only slightly lower with maximum vision (9 or 10 in the model, corresponding to total absence of censorship), than with a vision of about 7-8 (corresponding to some moderate degree of censorship). Yet peaks of violence are sharper when vision is 10 than when it is just 7-8. Therefore, one interpretation might be that a moderate degree of censorship is preferable to no censorship at all, in that it produces a fairly similar average level of violence, but with more stability. 14 Figure 6, however, shows that the level of stability in the moderate censorship scenario is achieved at the price of having a larger proportion of the population in prison. Indeed the average number of jailed agents reaches a maximum precisely when vision is 7. Instead, the low average violence that is produced in a no-censorship system (vision of 10) derives largely from endogenous processes that lead society members themselves to choose to be quiet – and in this sense is better.
Progressive Changes in Levels of Censorship Validate Previous Results
So far, we have assumed that the value of the parameter “vision” – and thus, the degree of censorship – remains constant during a single simulation run. The question that arises is to what extent our results differ if, starting from an initial situation in which access to social media is unrestricted (vision = 10), the government decides to exert censorship, whether partial (vision between 1 and 9) or total (vision = 0). To address this question, we consider two possible cases: “exogenous” changes that modify vision at some pre-determined moments in time, and “endogenous” changes in which vision varies whenever the system reaches some critical threshold, in particular in terms of number of agents engaged in protest. The former correspond to government measures that become enforceable at pre-defined times, independently of the state of the system at those times; the latter exemplify cases in which the government partially and progressively restricts access to online communications whenever it feels threatened by a high number of protesters. 15
Figure 7 presents results obtained with an exogenous change in levels of vision, in a simulation run of 1,000 time steps. Vision changes from 10 (no censorship) to 5 (moderate censorship) after 200 time steps, and goes down to 0 (full censorship) after another 600 steps. The system first reproduces the pattern observed in Figure 3 above for a (constant) level of vision of 10; when vision becomes 5, it shifts very rapidly to the pattern that corresponds to this level of vision, portrayed in Figure 3; and after vision drops to 0, it moves to the pattern that Figure 3 shows to be characteristic of this level of vision. Interestingly, these patterns could be entirely predicted based on our first simulation of scenarios with constant values of vision over time, as represented in Figure 3. These results are fairly general in that qualitatively similar systemic behaviours are obtained with different combinations of values of vision and number of steps after which a change occurs; for example, moving from a level of 10 to 2 (instead of 5) to 0. Hence, it can be concluded that the above analysis is also helpful to assess the effects of exogenous changes in vision.
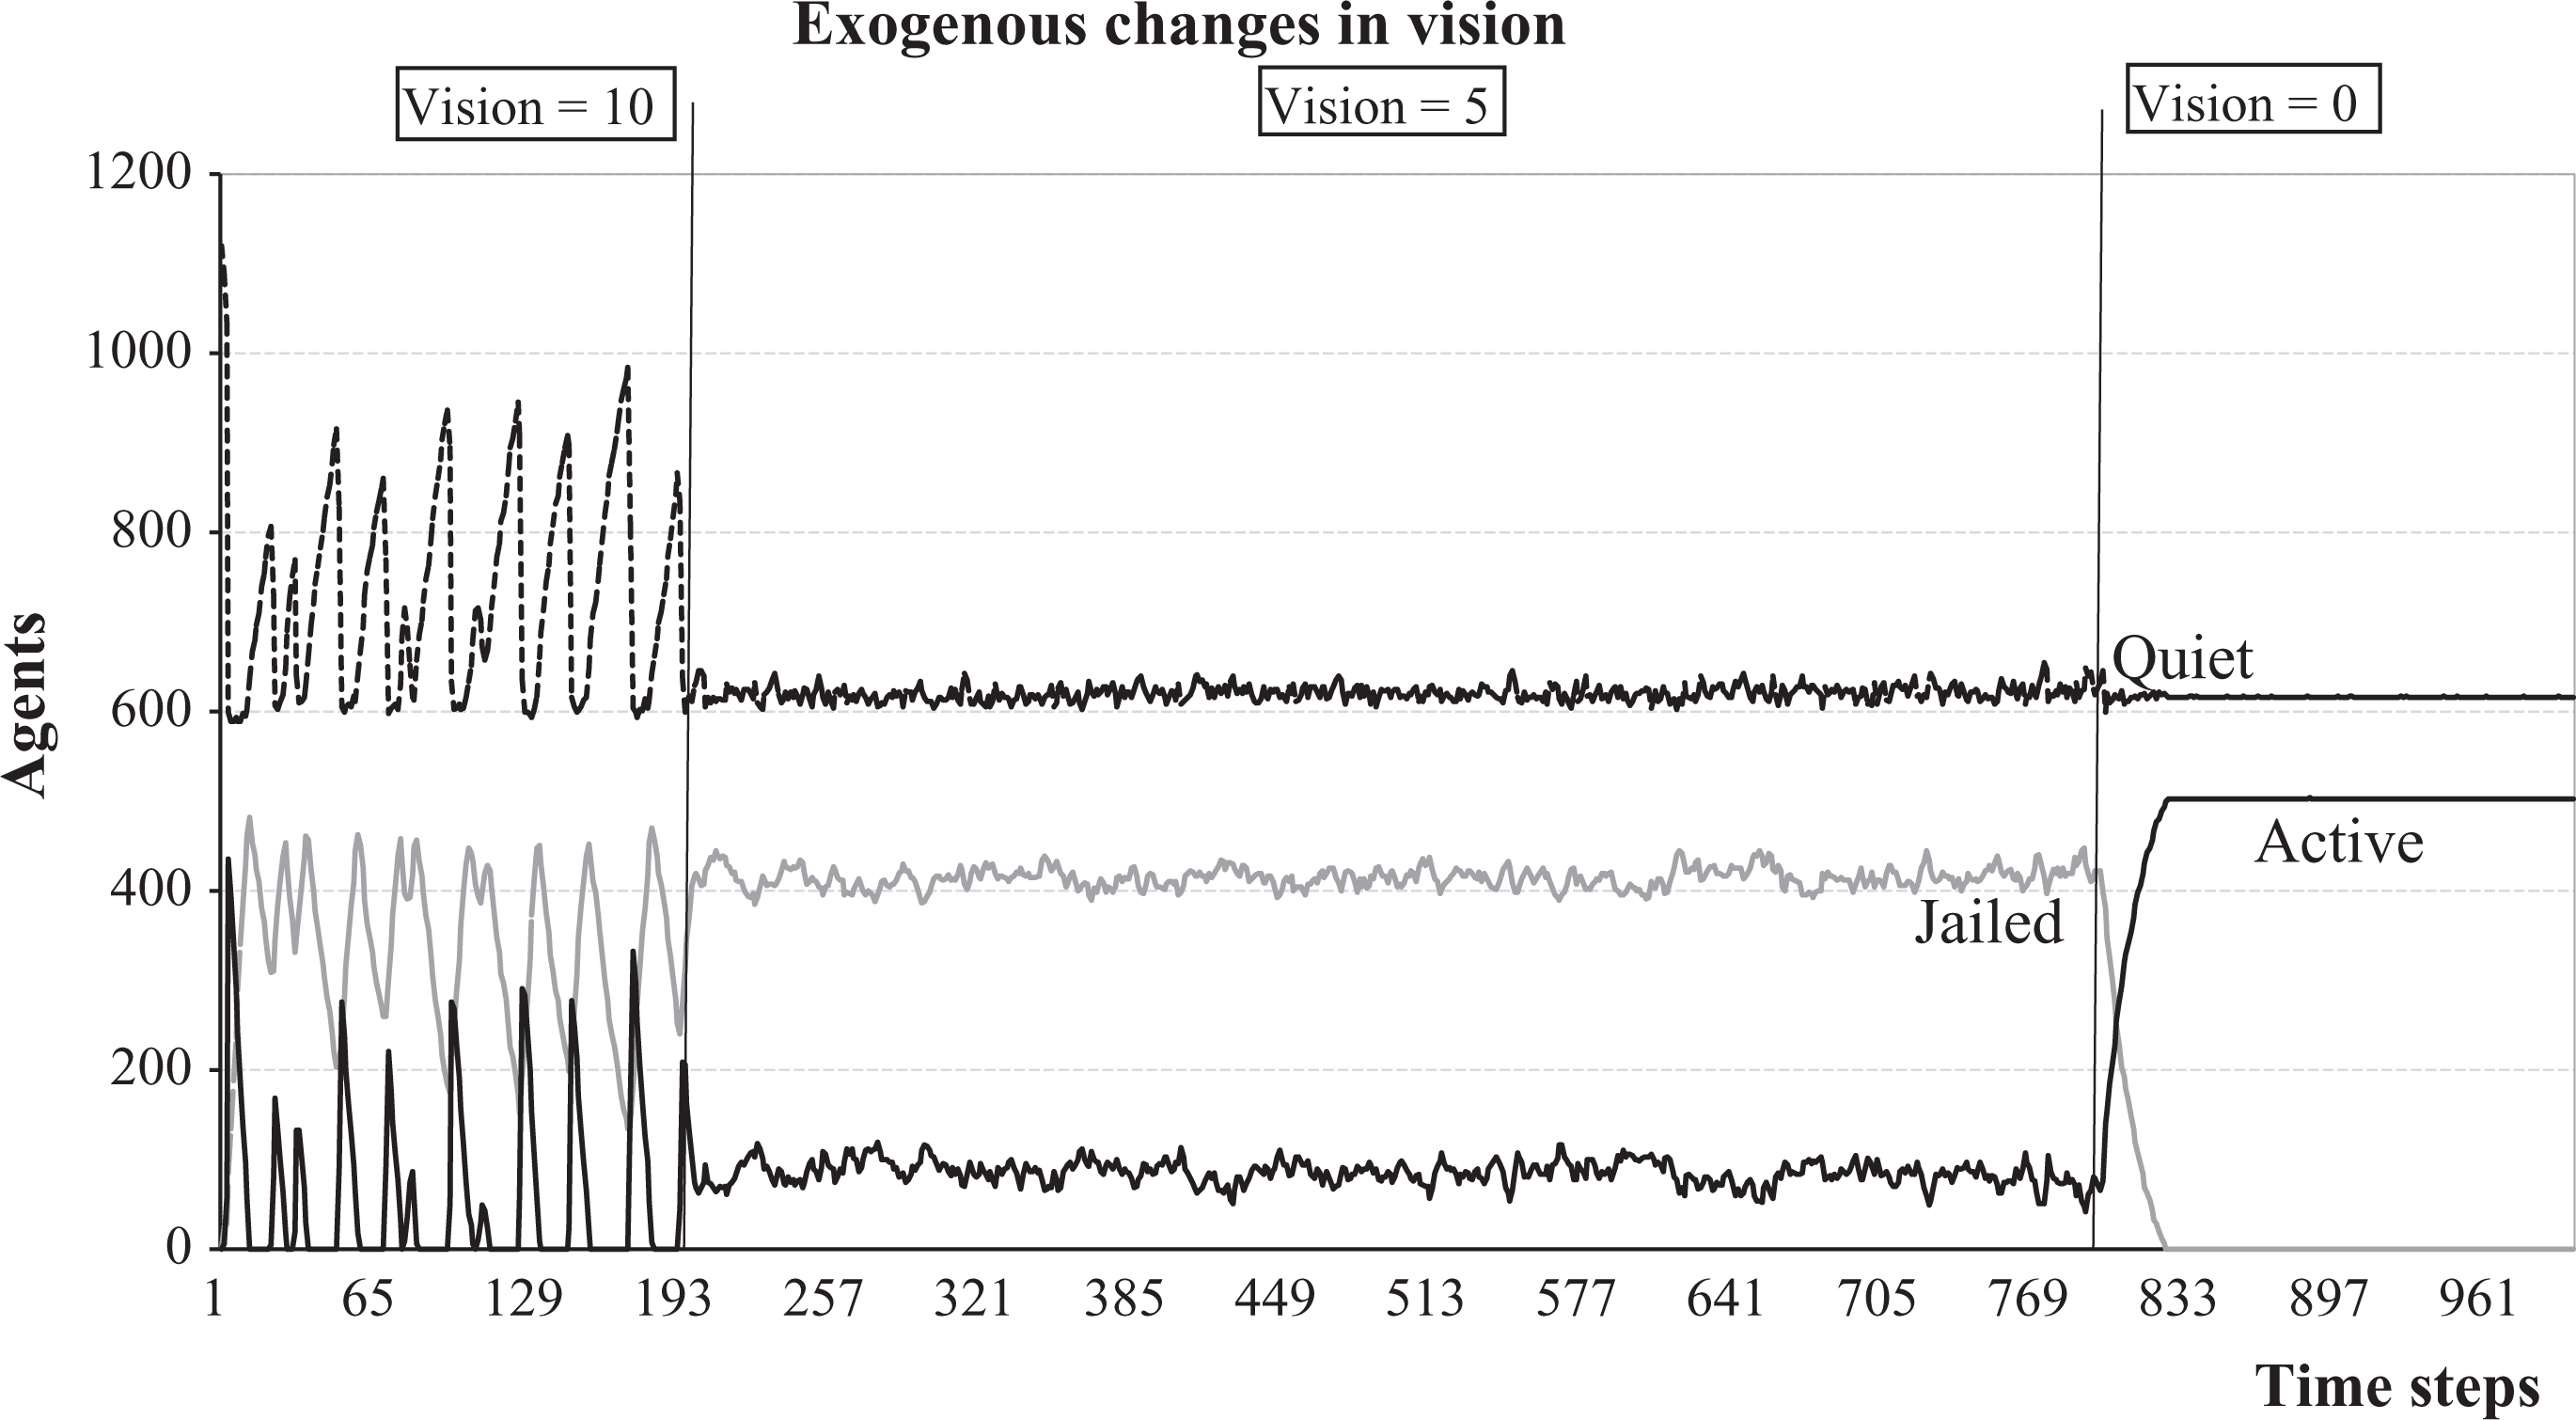
Number of quiet, jailed and active agents when vision decreases from 10 to 5 after 200 steps, and then to 0 after another 600 steps. In each case, the system reproduces the pattern that is observed when vision is constant at the level considered, and that can be predicted based on Figure 3 above, after a change, it switches very rapidly from one pattern to the other.

Number of quiet, jailed and active agents (left panels) and levels of vision (right panels) when vision starts from 10 and declines by one point whenever the proportion of active agents over the whole population reaches a critical threshold – here, 30% (upper panels), 10% (middle panels) and 50% (lower panels).
To study the effects of endogenous changes in vision in simulation runs of 1000 time steps each, we implement the rule that whenever the number of active agents exceeds a certain percentage of the total number of agents, vision declines by one point. Thresholds of 45 percent and above are never reached, and vision remains de facto constant at 10 all the time: the no-censorship solution is obtained. In all other cases, the system adjusts very rapidly to a state in which the level of vision stabilizes at some value below 10, and the numbers of active, jailed and quiet agents reflect the same outcomes that are obtained when the corresponding level of vision is constant at that value (as illustrated in Figure 3 above). In particular, when the critical threshold is between 15 percent and 45 percent, vision reaches equilibrium at some intermediate value (between 3 and 9), corresponding to moderate censorship; if the threshold is 15 percent or lower, vision stabilizes at 0 (full censorship), and the system exhibits a pattern that closely resembles the upper-left panel of Figure 3. We illustrate these three cases in Figure 8, with specific thresholds of, respectively, 30 percent, 10 percent and 50 percent. Again the conclusion is that, after some initial adjustment, the system’s outcomes are consistent with the explanations outlined in the previous sections of this article.
In all cases, the system rapidly stabilizes for a level of vision that remains constant over time, and reproduces the pattern observed when vision is constant at that level. Possible equilibrium levels of vision are 10 (for thresholds of 45 percent and above), 0 (for thresholds of 15 percent and below), or intermediate values (for all other thresholds).
Concluding Remarks
The case against Internet censorship presented here illustrates the importance of social analysis in contemporary political settings. Politicians’ and police authorities’ disapproval of “social justifications”, dismissed as – at best – a luxury one cannot afford in times of unrest, are to be considered symptomatic of a shoot-first-ask-later stance leading to ill-advised policy choices.
Our paper attempts to respond to a social demand for clarification in a phase still dominated by conflicting discourses as to the possible causes and legitimate reactions to the 2011 outbursts of civil violence. The research directions gradually emerging are forking between the ones focussing on micro-motives (such as personality, culture, morals) and the ones relying on macro-indicators (such as poverty and social stratification) as explanatory factors. The computational method adopted here aims to bridge this divergence by showing how a set of rules operating at a micro level can account for collective dynamics.
An approach detecting macro-structures starting from micro-interactions is subject to limitations (limitations of which we are aware of) and may not always be suitable for social research.
16
Nevertheless along with Banos (2010), we consider agent-based simulations as “crutches” for theory building, all the more useful when adopting a stance consistent with established sociology. The present inquiry concerning the social factors influencing civil violence in a computer-mediated environment is grounded in the desire to generate public debate and political involvement, and our innovative ethno-computational methodological choices can help us “thematize our participation in the world we study”. Burawoy (2009: 19) aptly points out: When the ground beneath our feet is always shaking, we need a crutch. As social scientists we are thrown off balance by our presence in the world we study, by absorption in the society we observe, by dwelling alongside those we make “other”. Beyond individual involvement is the broader ethnographic predicament – producing theories, concepts, and facts that destabilize the world we seek to comprehend. So, we desperately need methodology to keep us erect, while we navigate a terrain that moves and shifts even as we attempt to traverse it.
Of course, studying computer-mediated communication via the civil violence model inspired by Epstein does not prevent other factors from coming into play. As shown in a recent paper by Klemens et al. (2010), rebellious outbursts are more likely given increased hardship (the recent financial crisis does seem to come into play here). Civil violence is also influenced by loss of government legitimacy – which in this case seems consistent with the unpopular budget cuts promoted by David Cameron, not to mention the 2011 News Corporation telephone hacking and corruption scandal. Finally, protest outbursts are less likely when the competitive advantage of activists is reduced. The growing presence of the Metropolitan Police and law enforcement initiatives on Facebook, 17 Flickr 18 or Google Groups 19 – not for repressive but for intelligence-gathering purposes – can actually account for the subsequent limitation of violent outburst by reducing the rioters’ communicational vantage point.
Other studies have applied social simulation to censorship in situations of civil violence. Garlick and Chli (2009), for example, insist that restricting social communication pacifies rebellious societies, but has the opposite effect on peaceful ones. Our intention has been to show that, in the absence of robust indicators as to the rebelliousness of a given society, the choice of not restricting social communication turns out to be a judicious one for avoiding to trade democratic values and freedom of expression for an illusory sense of security.
Footnotes
Appendix A
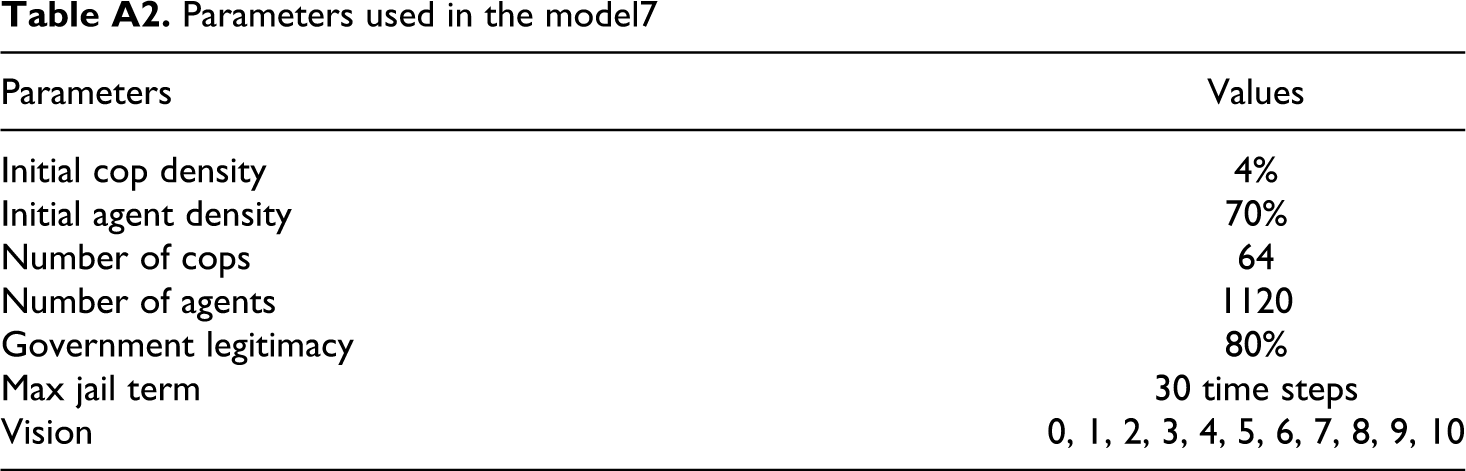
Parameters used in the model7
| Parameters | Values |
|---|---|
| Initial cop density | 4% |
| Initial agent density | 70% |
| Number of cops | 64 |
| Number of agents | 1120 |
| Government legitimacy | 80% |
| Max jail term | 30 time steps |
| Vision | 0, 1, 2, 3, 4, 5, 6, 7, 8, 9, 10 |
Funding
This research received no specific grant from any funding agency in the public, commercial, or not-for-profit sectors.