
Abstract
This study conducts a meta-analysis of empirical studies that have measured the spatial scale of industrial clustering. Two types of scales are examined: the peak scale (at which cluster effects are maximized) and the maximum reach (beyond which cluster effects are undetectable). We find that the scale varies significantly by the unit of analysis, industry sector, country of study, and the sources of cluster effects examined (e.g., knowledge spillovers, localization, and urbanization). Planners and policy makers should tailor the geographies embodied in cluster strategies to match the specific local needs and circumstances.
Introduction
Urban areas are centers of production and innovation due to the benefits brought by clusters of related industries (Beaudry and Schiffauerova 2009; Duranton and Puga 2001, 2004). Since Marshall (1890) and Jacobs (1969), researchers have intensively studied the causes and benefits of industrial clusters (Feldman 1994; Rosenthal and Strange 2001, 2004). These scholars have sought to understand the clustering processes and develop cluster strategies to enhance regional economic advantages. Numerous studies have quantified how much clusters contribute to productivity, wages, innovation, and entrepreneurship (Andersson, Klaesson, and Larsson 2016; Melo, Graham, and Noland 2009; Renski 2011), and the extent to which Marshallian (localization), Jacobs (diversity or urbanization), and Porter (competition) mechanisms are the drivers of cluster effects (Beaudry and Schiffauerova 2009).
A significant gap hinders our understanding of industrial clusters in their geographical domain. Whereas the benefits of clusters are expected to decay over distance (Rosenthal and Strange 2003, 2008), the specific geographical scales at which clusters exhibit impacts are not well understood (Andersson, Klaesson, and Larsson 2016; Overman 2003). The theoretical foundation and empirical evidence both are too limited to answer with any certainty whether a cluster effect extends throughout the whole labor market or a metropolitan area or is confined within a neighborhood. Earlier empirical studies have identified cluster effects at various levels of aggregation, such as a metropolitan area or labor market (Burger, Van Oort, and Van der Knaap 2007; Neffke et al. 2011), state (Bryan and Morten 2015; Rosenthal and Strange 2001), county (Fallah, Partridge and Rickman 2014; Hanink 2006), or city (Dekle and Eaton 1999; Han and Ke 2016). Nearly all of these studies selected the level of aggregation to investigate clusters as part of their research design rather than treating the geographic scale of cluster impacts as an empirical question. The same approach is taken by the US Cluster Mapping Project of the Harvard Business School (2018). While meticulously investigating industrial relatedness in order to define the sectoral membership of clusters, geographically, the US Cluster Mapping Project simply adopts the usual spatial aggregations—states, metropolitan areas, and counties—to map clusters. Some more recent studies have applied firm-level data to more precisely measure the distance at which cluster effects peak or the pace at which they subside (Aharonson, Baum, and Feldman 2007; Barlet, Briant, and Crusson 2013; Behrens and Bougna 2015). However, these empirical findings are mixed, with estimated spatial scales ranging from less than one mile in radius to more than 300 miles (Kolympiris, Kalaitzandonakes, and Miller 2015; Partridge and Rickman 2008; Rosenthal and Strange 2005).
It is, nevertheless, critical to understand the spatial scale of industrial clusters. Theoretically, estimating the spatial scale of clusters helps us to better capture the underlying mechanism(s) that drives the cluster effect. Most urban areas are blessed with the presence of not one but multiple clustering mechanisms; in these cases, estimating their varied spatial scales is a necessary step in determining how various clustering benefits may stack together geographically. For researchers, a deeper grasp of clusters’ spatial scale aids in selecting appropriate geographical units for conducting future empirical analyses (Cainelli and Ganau 2018). In practical applications, correct apprehension of the spatial scale of clusters makes it possible for planners to encourage firm and worker concentration at appropriate geographical units via policies and strategies such as zoning, industrial or innovation districts, and location-based incentives (Arauzo-Carod and Manjón-Antolín 2012).
This study fills the gap by conducting a meta-analysis of prior empirical studies that have explicitly measured the spatial scale of industrial clusters. We distinguish between two types of scales: the peak scale (where a cluster effect is maximized) and the maximum reach (the distance beyond which cluster effects are no longer detectable). This analysis makes two contributions. First, we provide a set of reference estimates of the spatial scale of clusters by summarizing and amalgamating the findings of existing studies. Second, we identify factors that account for differences in the estimated scales. For example, different clustering mechanisms (e.g., knowledge spillovers, localization, and urbanization) operate at different scales. The mixed empirical findings in prior studies are reconciled with the various determinants taken into consideration. Local planners can take home the message of the appropriate geographical unit at which to promote clusters and propel urban economic prosperity, that unit being tailored to specific policy aims and local characteristics.
The paper proceeds as follows. The next section qualitatively summarizes prior studies, especially empirical studies estimating the spatial scale of industrial clusters. The third section introduces the collection of empirical studies, the inclusion criteria, and the methodology for the meta-analysis. The fourth and fifth sections present and discuss the descriptive and quantitative findings, and the final section concludes with a summary of the results and their scholarly and practical implications.
Literature
Researchers have examined the benefits of industrial clusters, or urban agglomeration as most economists call it, since at least the nineteenth century. Marshall (1890) summarized the benefits of clusters of similar industrial activity (later termed localization economies) as labor pooling, cost savings with regard to specialized inputs, and knowledge spillovers. Ohlin (1933) and Hoover (1937) distinguished localization economies from urbanization economies—the benefits that arise from and are gained by a variety of economic activities locating together. 1 The seminal works of Jacobs (1961, 1969) described cross-fertilization across a diversity of urban industries and social interactions as a distinct source of clustering effects. More recently, Porter (1998) emphasized the essentiality of competition in the urban environment and argued that a “keeping up with the Joneses” motivation helps regions to maintain competitiveness in the global market. Following these lines of theoretical discussion, empirical studies have flourished in recent decades to estimate the magnitude of cluster effects and to differentiate various mechanisms of cluster benefits. Examples include Ellison, Glaeser, and Kerr (2010); Jaffe, Trajtenberg, and Henderson (1993); and Rosenthal and Strange (2001, 2003).
Industrial clusters have been found to exhibit a variety of benefits. For example, Strøjer Madsen, Smith, and Dilling-Hansen (2003) have found significantly higher productivity of Danish firms in clusters than their counterparts outside of the clusters. They argued that many mechanisms might account for this boost in productivity, such as networks, knowledge spillovers, and human capital mobility (i.e., labor pooling). Similar effects are found in the Japanese silk-reeling industry (Arimoto, Nakajima, and Okazaki 2014), in US manufacturing industries (Rigby and Essletzbichler 2002), and in China’s textile industry (Lin, Li, and Yang 2011). Melo, Graham, and Noland (2009) carried out a meta-analysis to summarize the results of studies that examined the relationship between urban agglomeration and productivity.
Innovation is another cluster benefit that has been examined frequently. For example, Wallsten (2001) found that firms close to an innovative firm are more likely to innovate themselves. A similar effect is confirmed by Beaudry and Breschi (2003) and Kolympiris and Kalaitzandonakes (2013). Other studies have identified the positive impact of own-industry or other-industry employment on firm innovation (Baptista and Swann 1998; Fang 2020; Feldman and Audretsch 1999; Moreno, Paci, and Usai 2006). This benefit of clusters on innovation comes from the mechanisms of knowledge spillovers, sharing of common (knowledge) inputs, and better matching between the skills needed by firms and those possessed by workers (Carlino and Kerr 2015). Carlino and Kerr (2015) have written a review paper, and Fang (2015) a meta-analysis to summarize the theoretical and empirical studies examining the relationship between clusters and innovation. Relatedly, entrepreneurship is another cluster benefit. Clusters are found to encourage the birth of new firms (Arzaghi and Henderson 2008), their growth (Delgado, Porter, and Stern 2010; Rosenthal and Strange 2005), and in some cases, their survival (Renski 2011). All of the mechanisms responsible for uplifting productivity and innovation may be conducive to entrepreneurship.
Clusters are found to boost wages (Addario and Patacchini 2008; Fu 2007; Rosenthal and Strange 2008). These authors argue that the effect arises from a combination of clusters’ attraction to high-skilled labor, their capacity to train and retain these workers, and skill complementarities that enhance labor force productivity. Other cluster benefits, such as more extended and in-depth networks, the attraction of capital investments, and higher returns to commercial real estate, have also been studied, though less frequently (Kolympiris, Kalaitzandonakes, and Miller 2011; Koster 2013; Ma et al. 2014).
There is, however, a lack of theoretical guidance and no empirical consensus on the spatial scale of industrial clusters, even though empirical studies of clusters generally must pick one or more geographical units of analysis. Industrial clusters generate assorted benefits by varied mechanisms, which may operate or accumulate at different spatial extents. Moreover, whereas there are solid foundations, both theoretical and empirical, to signify that cluster effects attenuate over distance (Andersson, Klaesson, and Larsson 2016; Koster 2013; Rosenthal and Strange 2008), how rapidly such attenuation occurs is a subject that has not been addressed by theories of clusters. Thus, the spatial scale of clusters remains an empirical question and a choice for researchers to make in conducting empirical studies. The options include administrative units such as states (Bryan and Morten 2015; Rosenthal and Strange 2001), counties (Fallah, Partridge and Rickman 2014; Hanink 2006), or cities (Dekle and Eaton 1999; Han and Ke 2016) and economically determined geographical units such as metropolitan areas or labor markets (Burger, Van Oort, and Van der Knaap 2007; Neffke et al. 2011). More recently, accessible microlevel data have enabled distance to be examined more precisely, using individual firm and establishment locations (Albert, Casanova, and Orts 2012; Barlet, Briant, and Crusson 2013; Brown, Dar-Brodeur, and Tweedle 2020). Case studies of specific industrial clusters also are common but typically do not explicitly define the geographical domain of the clusters studied (Austrian 2000).
Two types of spatial scales have been estimated in prior studies as Figure 1 illustrates. The peak scale is the distance at which the cluster achieves its maximum effect. Note that some studies assumed that the peak occurs at a distance of zero (de Groot, Poot, and Smit 2016; Drucker and Feser 2012; Han and Ke 2016), whereas others allowed the peak distance to be nonzero. The latter approach encompasses the notion that at some scales increases in distance may enlarge cluster effects by incorporating more employment activities and potential knowledge sources. These studies either found the cluster effect to attenuate continuously over distance (Wallsten 2001) or not necessarily to do so (Fang 2019). Thus, whether the peak scale is zero or not is an empirical question. The second type of spatial scale, maximum reach, is the distance beyond which the cluster effect diminishes past recognition; it defines the territory of the cluster effect. Table 1 shows various estimations of these two scales in prior studies, classified by different outcome variables. The range of these estimates is considerable, showing substantial heterogeneity across studies.
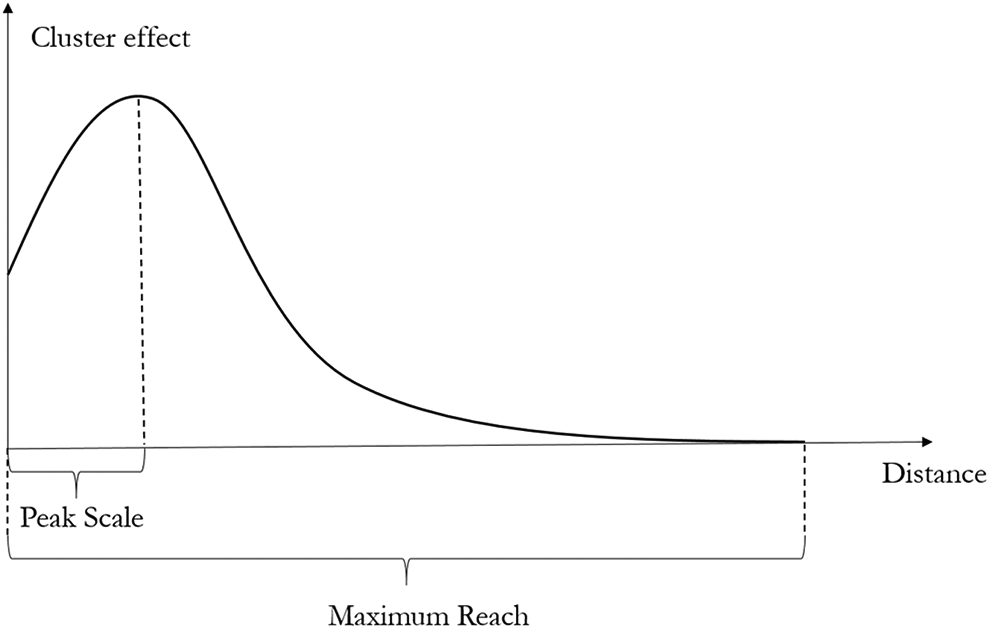
Two types of spatial scales of industrial clusters.
The Average and Median Spatial Scales of Clusters (in Miles), Weighted by Sample Size.
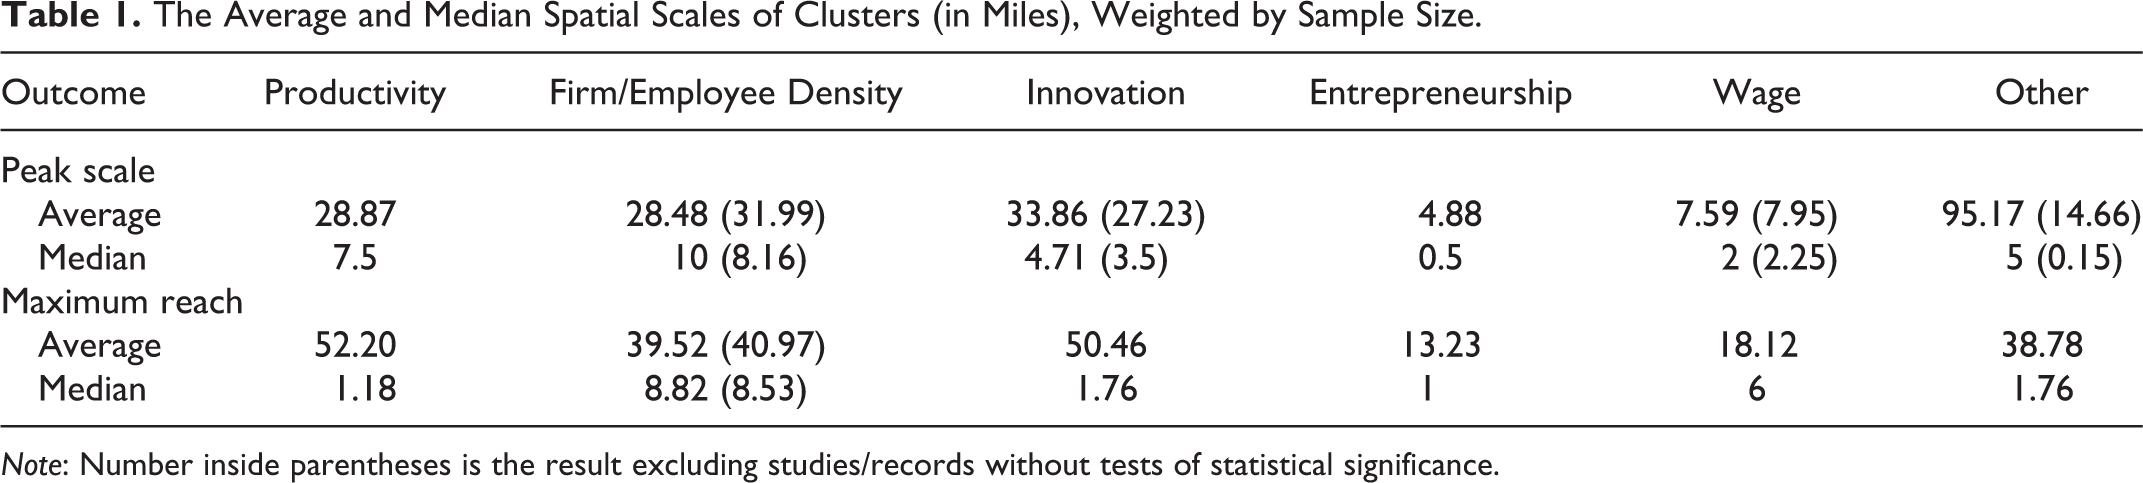
Note: Number inside parentheses is the result excluding studies/records without tests of statistical significance.
Several factors may have contributed to this heterogeneity. For example, Andersson, Klaesson, and Larsson (2016); Arzaghi and Henderson (2008); and Duranton and Puga (2004) suggested that different underlying mechanisms for clusters likely operate at various geographical scales. The attenuation rate of clusters may also vary by location (Cainelli and Ganau 2018; Fu 2007; Rosenthal and Strange 2008). Moreover, different economic outcomes affected by clusters, such as productivity, wages, innovation, and entrepreneurship, are likely to concentrate at different geographical scales (Cainelli and Ganau 2018; Halpern and Muraközy 2007; McHale, Agrawal, and Kapur 2008; Rosenthal and Strange 2005, 2008), a point corroborated by the evidence in Table 1.
Faced with mixed findings, it is crucial to establish a general reference for the spatial scale of industrial clusters to guide future studies and policy choices. Meanwhile, determining which factors change the estimated spatial scales and by how much is also critical to advancing our understanding of clusters. This study takes on these two tasks.
Data and Method
Data
The literature used in the meta-analysis is collected through the following procedures. First, we searched key word combinations of “spatial (or geographical) scale”/“spatial (or geographical) extent”/“spatial (or geographical) decay” and “cluster”/“agglomeration” through the first twenty pages of Google Scholar (i.e., the most-cited articles), the first 1,000 relevant studies in the Web of Science database, and the entire collections of Social Science Research Network and National Bureau of Economic Research working papers to account for unpublished works. Second, we manually examined these collections and removed articles of little relevance or that do not contain an empirical examination of the spatial scale of clusters. After this screening, we were left with 106 articles collected from Google Scholar (in which eighty-seven overlap with the collection from the Web of Science, and nineteen are unique from Google Scholar), ninety-one from the Web of Science (in which four are unique), two from SSRN, and one from NBER. Third, we added nineteen additional studies that appear repeatedly in the reference lists of the collected papers and three more independently known to the authors. This process provided us with a total of 135 articles.
We then cleaned the collected literature and categorized it into two lists. 2 The first list contains the research used in both the descriptive analysis (Descriptive Analysis section) and the meta-analysis (Average and Median Estimates section and Fundamental Differences and Methodological Choices Both Influence the Estimated Spatial Scale section). These studies (1) explicitly measured at least one of the two spatial scales of clusters and (2) reported critical methodological and statistical information such as sample size, studied industry, and statistical significance. Applying these two criteria to the 135 collected articles, we are left with this first list of eighty-five articles. Many of these studies contain multiple records resulting from distinct estimations being carried out for different subsamples, industries, time frames, or specifications. All estimation results within the main texts are collected but analyses in appendices are discarded. 3 A total of 968 records are obtained from these eighty-five articles. The process of paper collection and selection is illustrated in Figure 2.
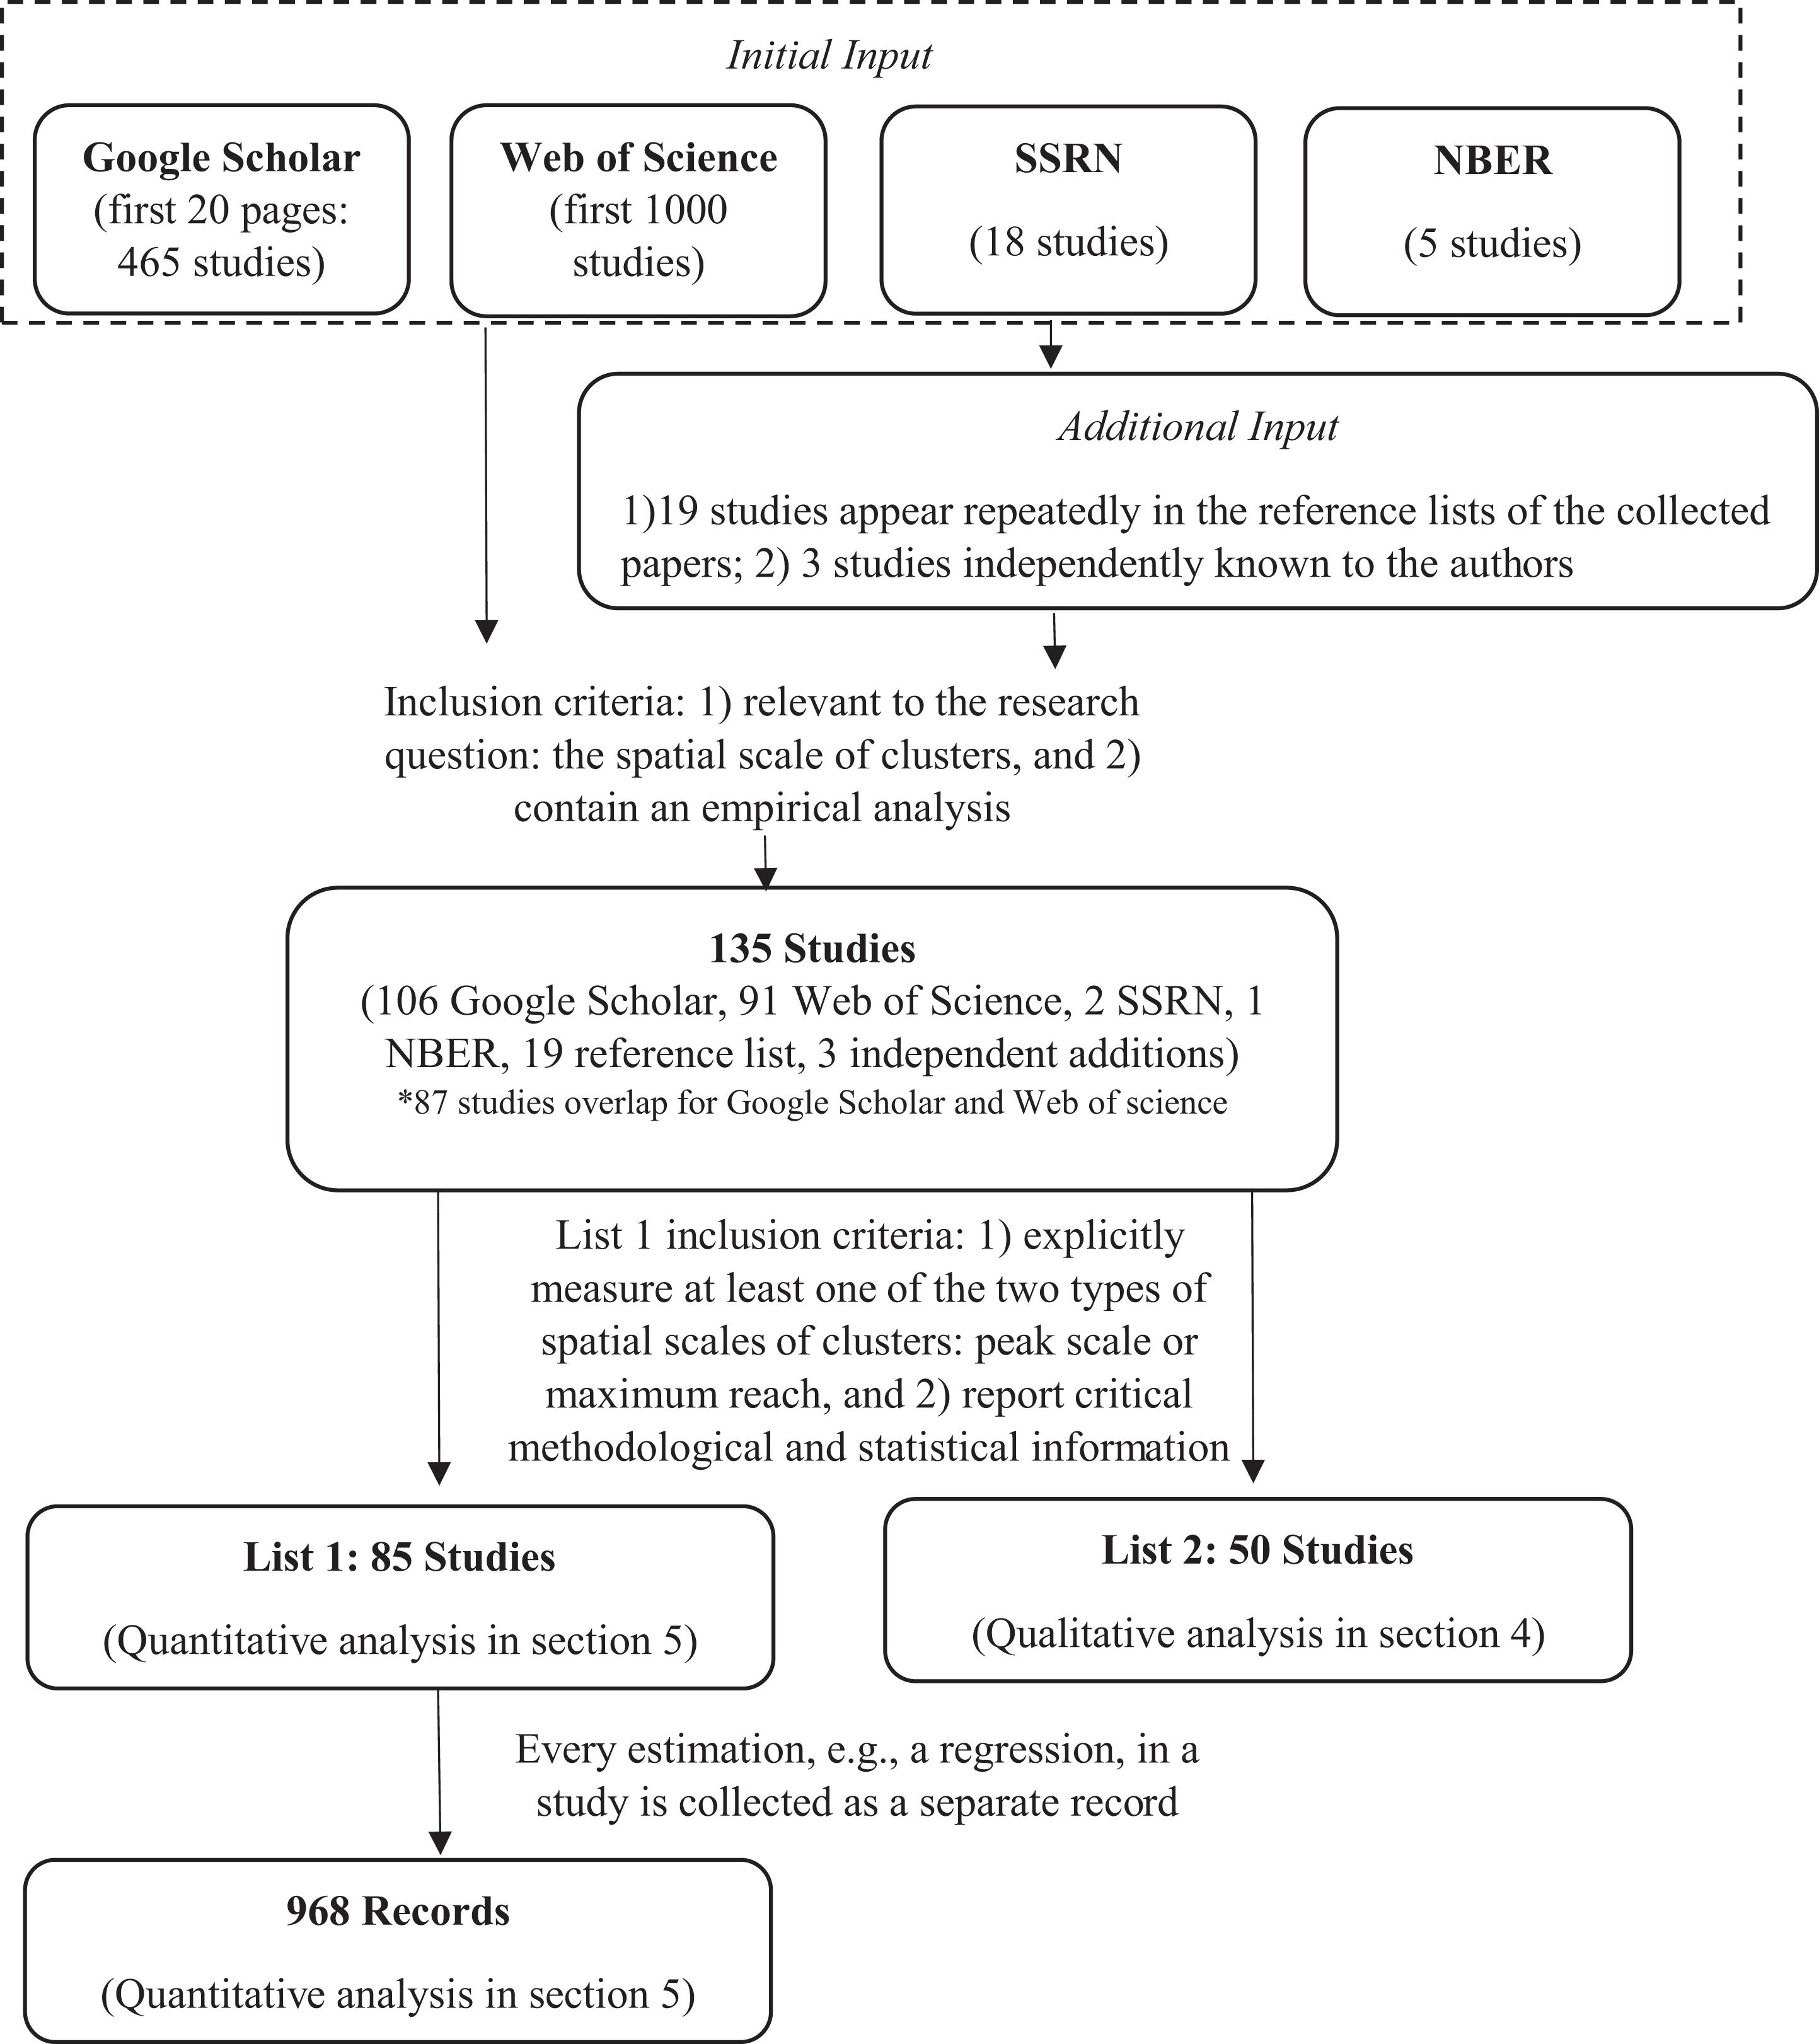
The process of paper collection and selection.
The second list contains studies that we use only for the descriptive analysis because they did not explicitly measure the spatial scales of clusters in a fashion compatible with the quantitative meta-analysis. This list includes another fifty studies. The methodological variations across both lists of studies are explored in detail in Methodological Variations in Studied Empirical Research section.
Different sets of information are collected for the two lists of studies. For the second list, we collected information on the spatial data level, studied location, vintage, industry/sector, type of model, dependent variable(s), key independent variable(s), method of distance estimation, and the clustering mechanism(s) examined. For the first list, we also collected the unit of distance measurement (e.g., km, m, mile), estimated peak scale and/or maximum reach, sample size, model estimation technique (e.g., density, regression, simulation), statistical significance, number of citations, and journal impact factor. These attributes are used as explanatory variables in the mixed-effect meta-analysis regressions; some of them explain much of the heterogeneity across studies.
Method
We adopt the method of meta-analysis to examine the empirical literature. Meta-analysis is a method that estimates the average effect across multiple empirical studies (DerSimonian and Laird 1986). The method was first adopted in clinical trials but has spread widely into other fields including economics (Stanley et al. 2013), business (Orlitzky, Schmidt, and Rynes 2003), urban planning (Fang 2015; Stevens 2017), and regional science (Melo, Graham, and Noland 2009). A meta-analysis overcomes several common shortcomings of a single empirical study, such as a small sample size, a single location, and a limited time frame. By combining a large number of samples from multiple studies, potentially from different countries and periods, a meta-analysis can efficiently measure the average effect and reveal the homogeneity or heterogeneity of the estimated effect across space and time.
We focus on the two different spatial scales of industrial clusters described above. The peak scale is where planners and firm managers should target their efforts, all else equal, to reap maximum benefits from clusters. The maximum reach is the greatest distance at which the benefits of a cluster can identifiably spillover, signifying the largest appropriate scale of regional collaboration in fostering a cluster. All localities within this distance can be mobilized in forming a strong regional cluster, but beyond this distance such collaboration likely is futile. Among the eighty-five studies evaluated in the meta-analysis, eighty-three estimated the peak scale and forty-three estimated the maximum reach.
We separated papers using different outcome variables. This is a choice made based on both theoretical and methodological considerations. Theoretically, industrial clusters are places in which multiple economic mechanisms intertwine and various economic outcomes emerge, impacted by the industrial cluster’s features to different extents. These outcomes may not all manifest at the same spatial scale. Certain outcomes such as entrepreneurship might be quite concentrated in space, as entrepreneurs benefit from a small and tightly connected ecosystem in which they can interact frequently with each other (Arzaghi and Henderson 2008; Rosenthal and Strange 2005). This requires a relatively short physical distance. In contrast, productivity and wages may be elevated throughout the entire labor market, which can be as large as an entire urban area or metropolitan area (Di Addario and Patacchini 2008; Fu and Ross 2013; Lin, Li, and Yang 2011). For example, if a region is attractive to high-skilled labor, people can live and work throughout the metropolitan area and thus boost wages across the entire region. Thus, separating outcome variables helps us produce more meaningful and insightful results.
Methodologically, a major criticism for the application of meta-analysis in social science is that studies are too heterogeneous in terms of their measurement of independent and dependent variables as well as the specific contexts (Nelson and Kennedy 2009). Pooling the results of such studies is akin to averaging apples and oranges. We dealt with this problem in three ways. At the highest level, we separated empirical studies into two lists, the first containing the more or less comparable studies included in the quantitative meta-analysis. The noncomparable studies we summarized only qualitatively and descriptively. At a medium level, we separately analyzed papers that examine different outcome variables. Various outcome variables are measured in disparate ways and with distinct units and may involve different clustering mechanisms. Thus, summarizing them together can be misleading. We classified studies into six groups with different outcome variables: (1) productivity, typically measured by total factor productivity, total output, and total value added; (2) firm and employee density, measured by the number of firms or employees per square mile, or a concentration or agglomeration index of firms or workers; (3) innovation, measured by patent counts or citations, or metrics of research and development (R&D) activity, funding, or awards; (4) entrepreneurship, measured by the number of firm births and new firm employment; (5) wages, measured by wage levels or growth; and (6) other outcome variables, which includes housing prices, office rents, and collaboration networks, among others. These outcome variables typically measure a type of cluster benefits as discussed in Literature section, except for firm and employment density, which is the spatial demonstration of a cluster itself. Lastly, we captured the remaining heterogeneity of prior studies using independent variables in the mixed-effect model to explain why their estimates differ.
For the descriptive analysis, we constructed a table summarizing the estimates and explored methodological variations across studies. For the quantitative meta-analysis, we calculated the average and median estimates for the two spatial scales and conducted a mixed-effect meta-analysis regression (at the record level; Sutton et al. 2000), specified as follows, to explore which factor(s) explain the heterogeneity in the estimation:

In equation (1), i indexes studies, r indexes individual records, and
Mechanism Investigated and the Estimated Spatial Scale.

Note: Standard errors in parentheses are clustered by article. This group of dummy variables does not form perfectly collinearity because one record can examine more than one mechanism, with multiple explanatory variables.
*p < .05.
**p < .01.
***p < .005.
Sector of Study and the Estimated Spatial Scale.

Note: Standard errors in parentheses are clustered by article. For the maximum reach model, other sectors are used as the baseline. For the peak scale model, this group of dummy variables does not form perfectly collinearity because some records examined samples from both the manufacturing and service sectors.
*p < .05.
**p < .01.
***p < .005.
Unit of Analysis and the Estimated Spatial Scale.
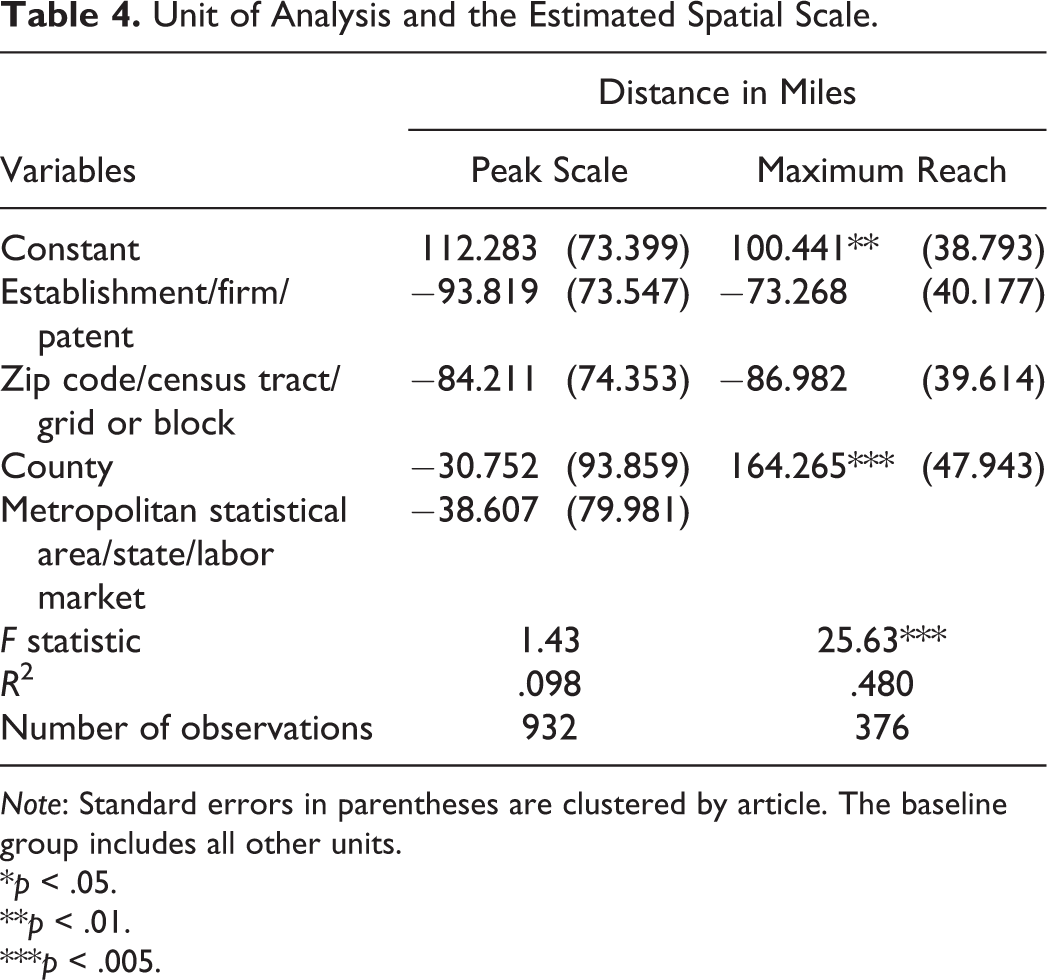
Note: Standard errors in parentheses are clustered by article. The baseline group includes all other units.
*p < .05.
**p < .01.
***p < .005.
Choice of Analysis and the Estimated Spatial Scale.
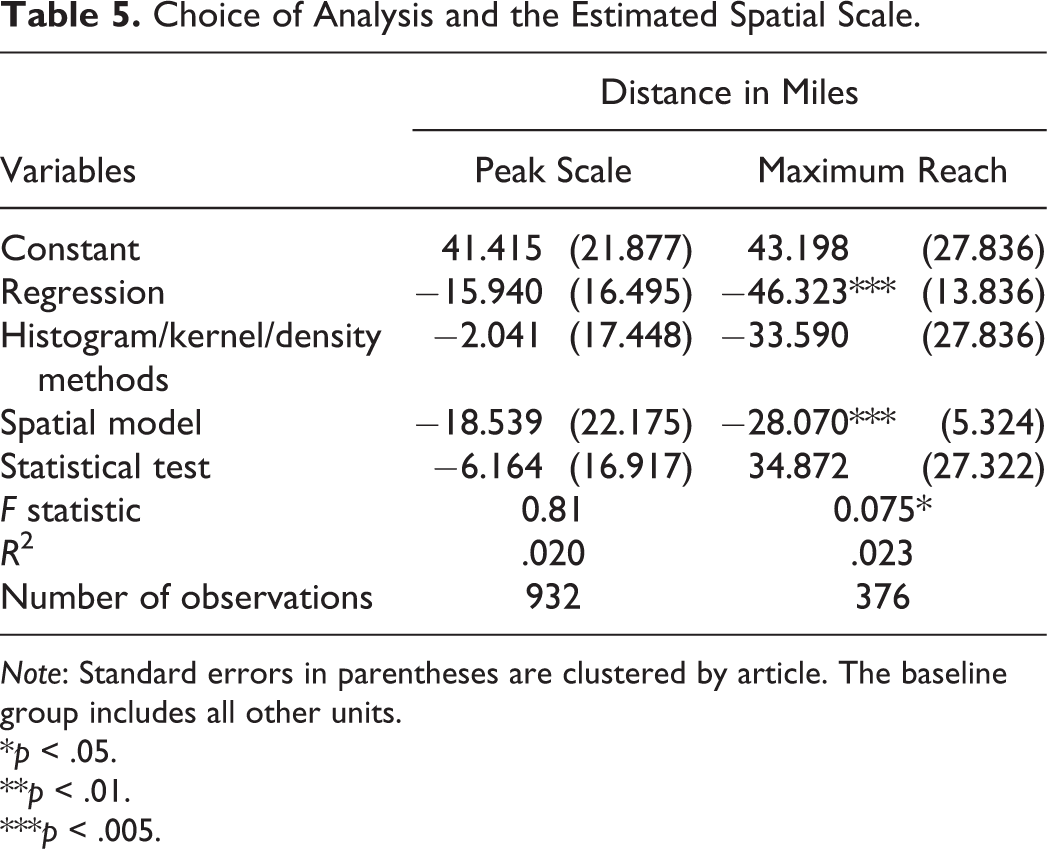
Note: Standard errors in parentheses are clustered by article. The baseline group includes all other units.
*p < .05.
**p < .01.
***p < .005.
Factors Influencing the Estimated Spatial Scale.
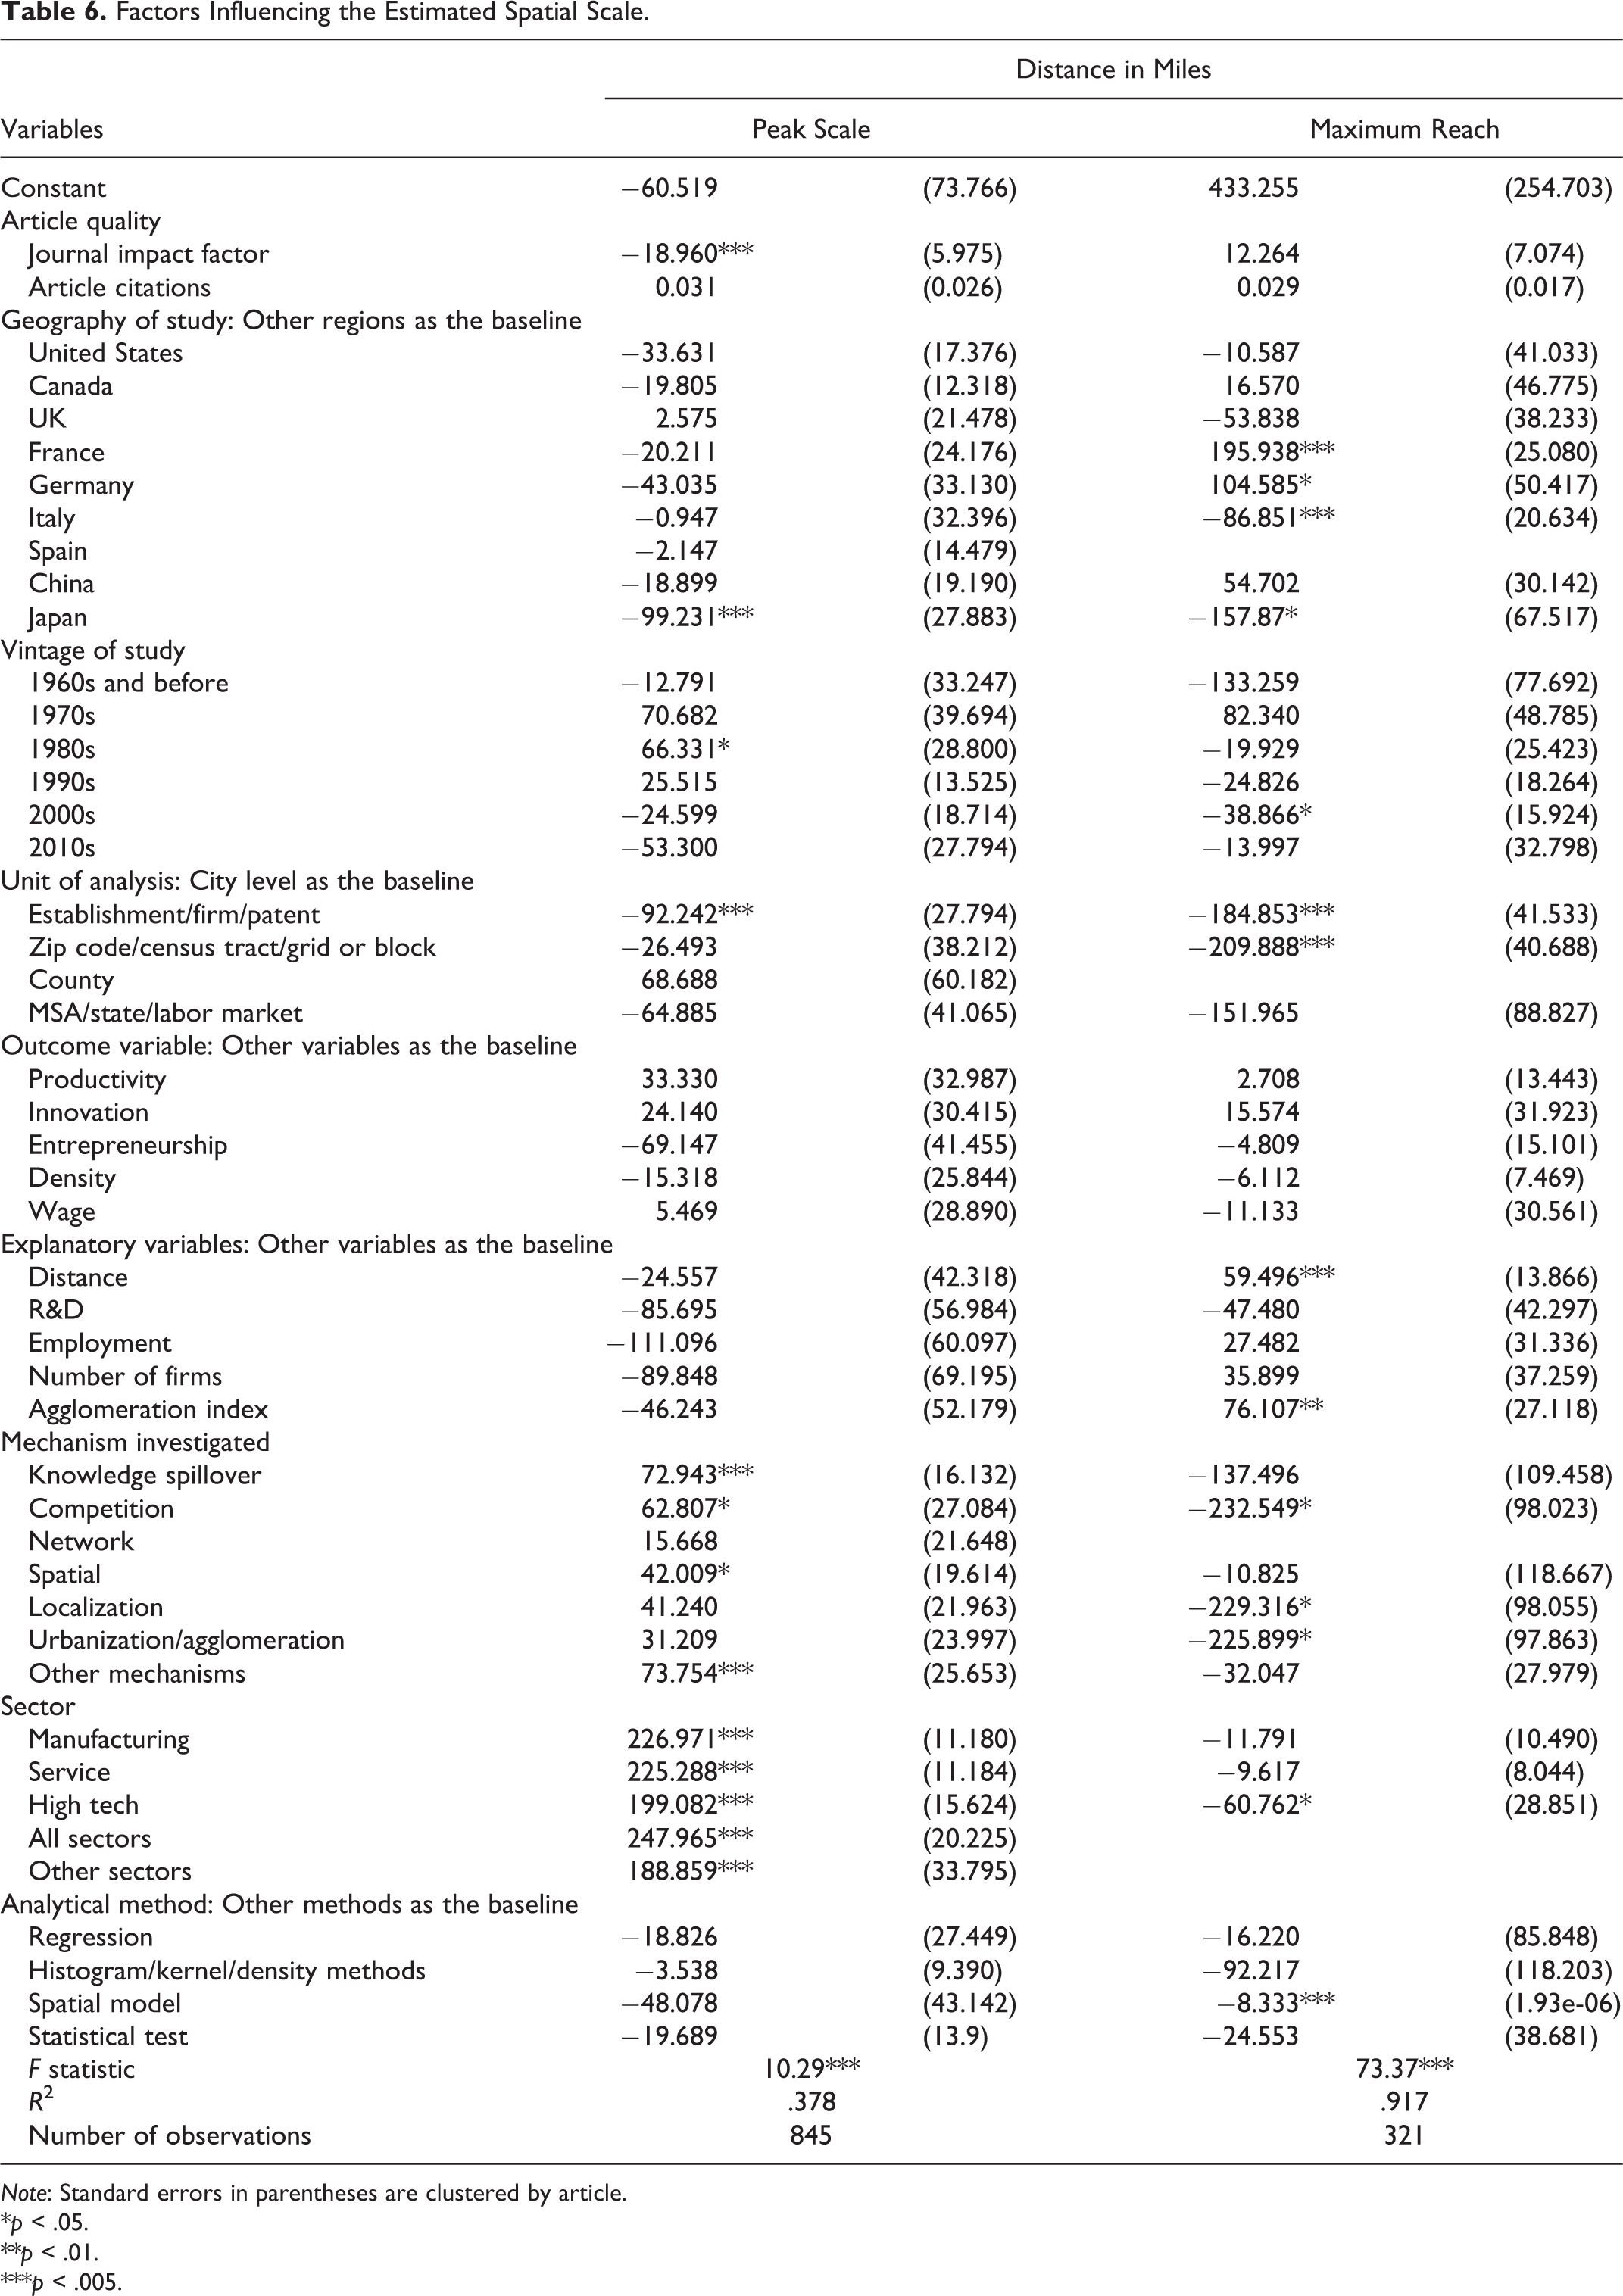
Note: Standard errors in parentheses are clustered by article.
*p < .05.
**p < .01.
***p < .005.
Methodological Variations in Studied Empirical Research
The eighty-five studies included in the quantitative meta-analysis incorporate many variations but have in common that each estimated either the peak scale or the maximum reach of cluster influence. They did so most often with regression analyses that incorporated distance-based measures of clusters. However, some adopted other methods such as constructing indices of concentration, calculating statistical measures of spatial relationships, estimating spatial density patterns, or conducting simulation exercises. These studies are analyzed in Result section.
The second list of fifty papers encompasses studies that were not used in the meta-analysis because they did not directly estimate the peak scale or maximum reach of industrial clusters or did so in a way that is not comparable with the majority of studies. A few of these works consisted of descriptive summaries of previous studies and did not fully describe the underlying data. Two are themselves meta-analyses. 4 A couple more studies did not calculate or report a peak scale or maximum reach, despite employing methodologies capable of doing so, aiming instead to apply distance metrics to identify or distinguish industrial clusters. The majority of papers in the second list investigated the spatial scale of clusters with atypical methodologies or measurement strategies.
Several papers incorporated geography through classifying locations by administrative units rather than by adopting distance measures. Rosenthal and Strange (2001), for example, calculated proxies for cluster effects in US manufacturing industries for zip codes, counties, metropolitan statistical areas, and states. Their study did shed light on the spatial scale of clusters, showing that different clustering mechanisms prevail at different geographical units. However, there is no way for us to quantify the peak scale or maximum reach estimated from this study, since administrative units are of quite different sizes.
A few analyses, such as Chauvin (2019), measured distance according to travel time rather than spatial separation. This approach may improve accuracy, particularly for the retail sector that is sensitive to the divergence between distance and travel time. Yet it is challenging to operationalize and requires highly reliable information on travel behavior or transportation networks.
Another set of studies estimated elasticities of the outcome variable with respect to clusters, specifying the functional form of distance decay in advance. Because elasticity need not be constant along the range of distances examined, these analyses usually reported estimates at the sample means. Although the findings are not directly comparable with those of the majority of studies, this method does offer two notable advantages. First, the estimates are not limited to linear relationships between clusters and the outcome analyzed. Second, specifying the functional form of distance decay tightens the focus of the estimation procedure and thus increases its statistical power at the potential cost of inaccuracy or bias due to a flawed specification. Some studies, such as Feser (2002) and Drucker (2012), empirically tested multiple distance specifications.
The largest share of studies in the second list considered distance in a limited fashion, by testing only one particular distance, combining multiple distance-based influences into an index, defining location discretely through concentric distance bands, or most commonly by assuming a linear influence of distance on cluster effects. In these studies, data constraints may have hindered a more thorough evaluation of the spatial differentiation of cluster impacts. In some cases, distance seems to have comprised a relatively minor aspect of a study focused on other factors influencing clusters.
With such substantial divergence in methodologies, it is neither desirable nor possible to summarize the substantive results of the excluded studies as a single group. We provide only the broadest generalization that these studies tend to provide positive evidence of substantial cluster influences across a wide variety of environments.
Result
Descriptive Analysis
Table 7 summarizes the characteristics of the two lists of empirical studies. The number of studies estimating the spatial scale of clusters has been increasing over time. Most studies have focused on North America—the United States and Canada. Several European countries have been repeatedly studied, including Spain, France, Germany, the United Kingdom, and Italy. A smaller set of studies has examined Asian nations, with China and Japan receiving more attention than other Asian countries. The majority of these studies examined vintages of the 1990s and 2000s, the period in which more microlevel data became available. Relatedly, the vast majority of these studies adopted microlevel data, such as establishment, firm, or patent/inventor data. These data are best suited to examine the spatial scale of clusters as they allow precise measurement of the distance between economic actors. In terms of industries, about one-third examined all industries/sectors, one-third focused on manufacturing industries, and the final one-third studied either the service sector or the high-tech industries. The studies/records adopted six groups of different outcome variables: productivity, firm/employee density, innovation, entrepreneurship, wage, and others. About 40 percent examined the density of firms or employees, followed by those examining innovation and productivity as Figure 3 shows.
Number of Studies/Records with Different Characteristics.
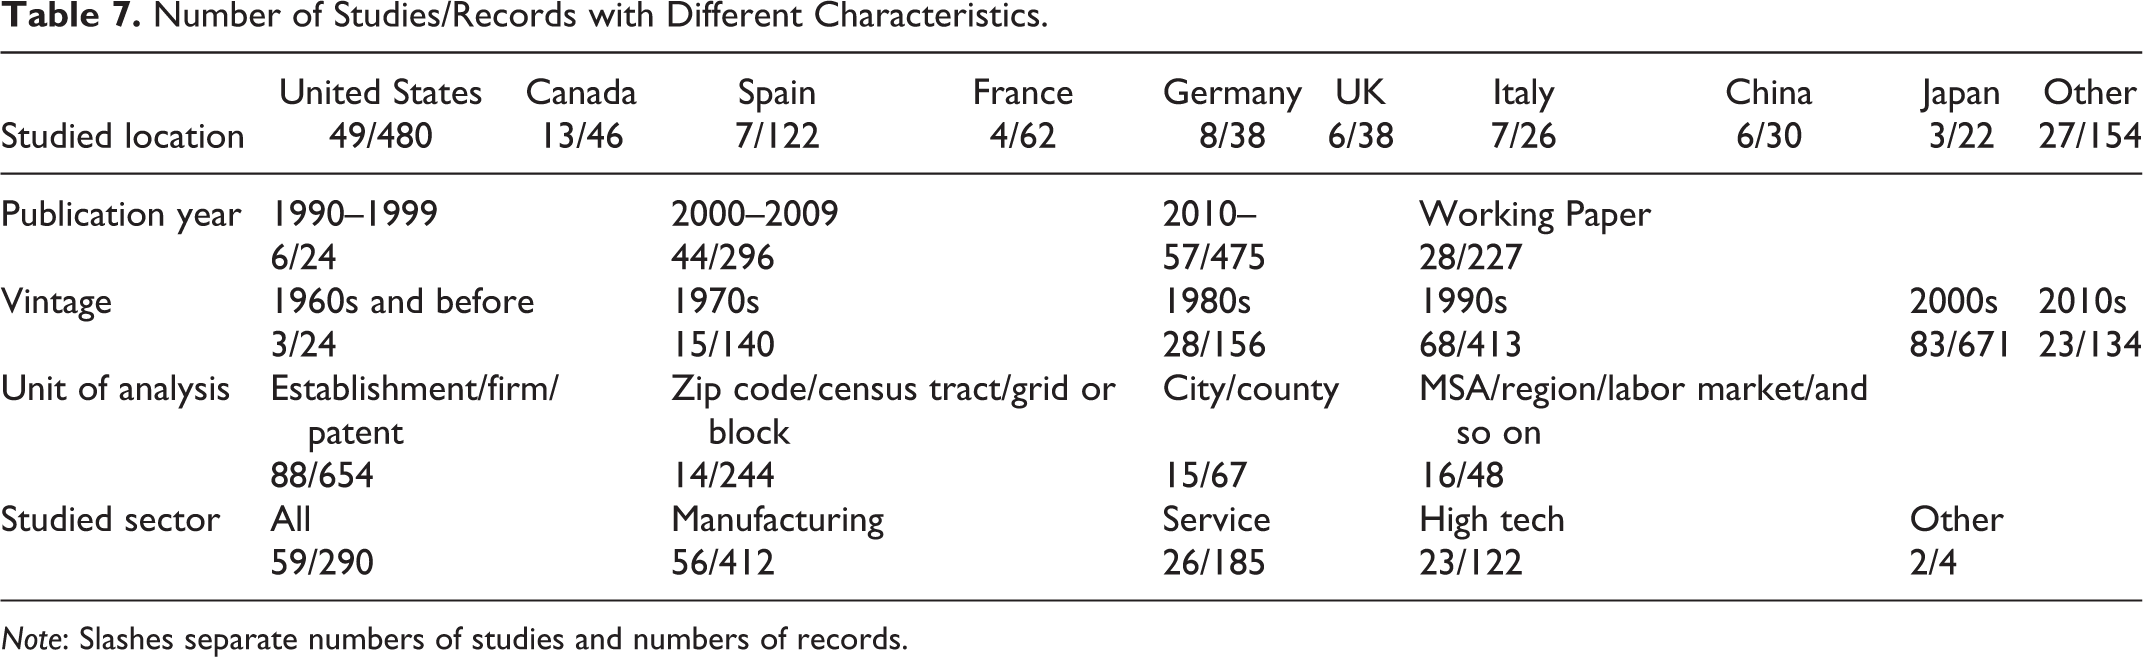
Note: Slashes separate numbers of studies and numbers of records.
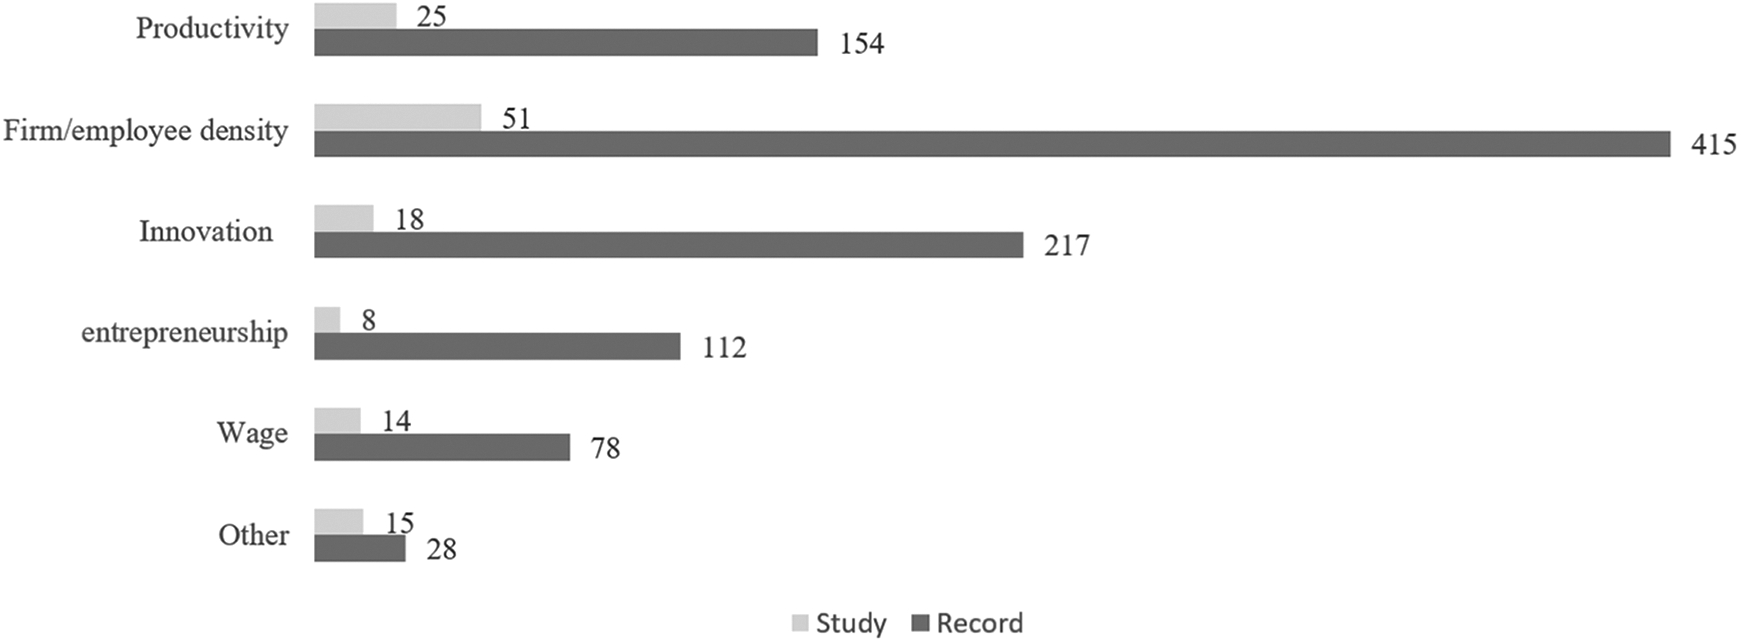
Studies/records with different outcome variables.
Studies/records also investigated various clustering mechanisms. Most studies explicitly stated which mechanisms they investigated, such as localization effects, urbanization effects, knowledge spillovers, competition, or networking. A few tested the spatial correlation or spatial concentration of firms and workers without specifying a mechanism; we classified these studies together as “spatial” mechanism. We classified localization and specialization together, as both capture the cluster effect stemming from a single industry or a group of very closely related upstream and downstream sectors. Similarly, we grouped urbanization together with diversity and agglomeration effects, as all three capture cluster effects from the mingling of various industries. Different mechanisms often are related to different outcome variables, but these features do not map one to one. For example, the knowledge spillover mechanism typically involves an outcome variable of innovation, but some papers adopted the birth of high-technology firms (i.e., entrepreneurship) and the spatial relationship between a firm and its collaborators as dependent variables. Therefore, we used mechanisms and outcome variables separately to explain the various spatial scales from previous studies as displayed in Tables 2 and 6. Figure 4 shows that most studies and records examined the localization/specialization effect, followed by those studying urbanization/diversity and knowledge spillovers.
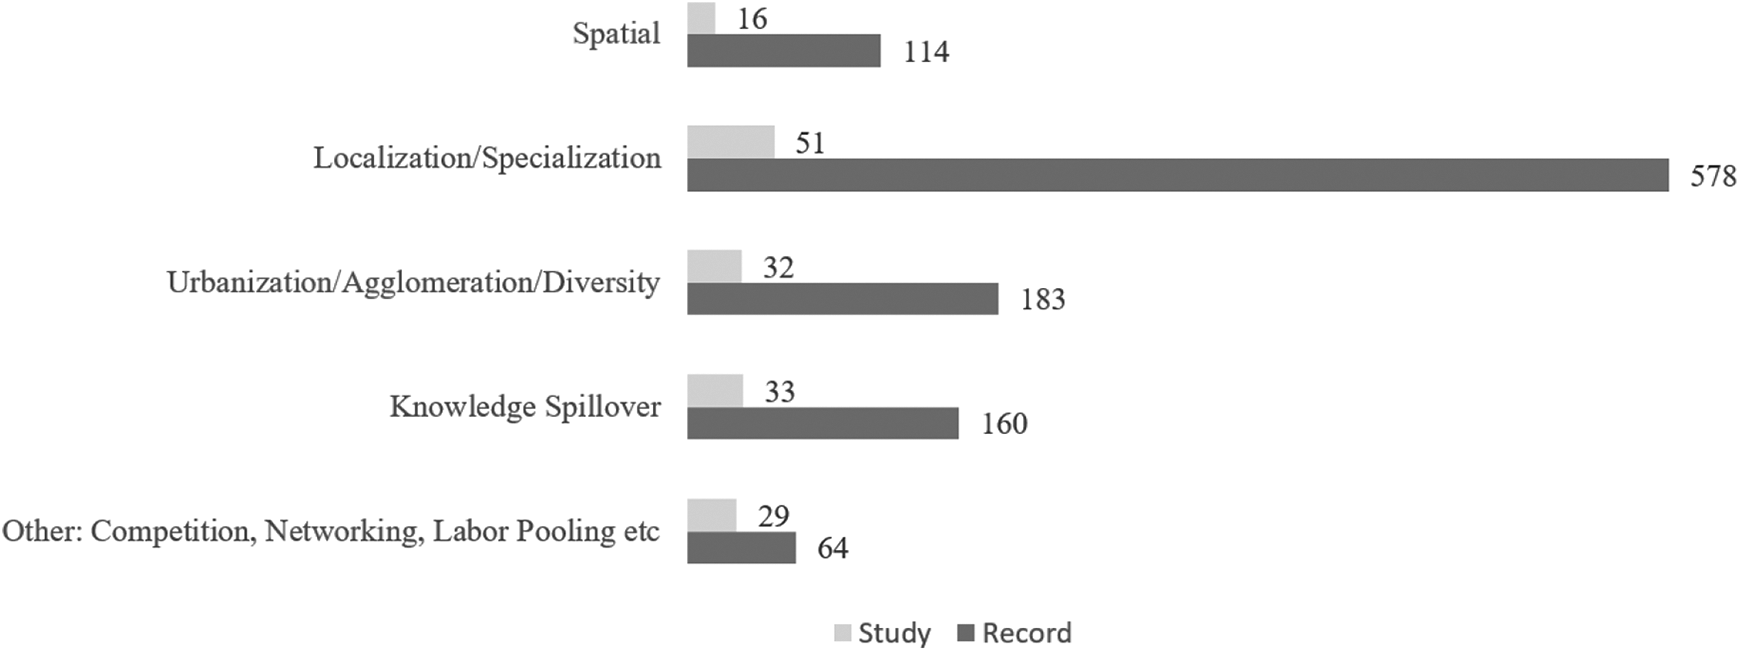
Studies/records estimating different clustering mechanisms.
Table 8 summarizes the distribution of the estimated spatial scales. The spatial scales appear mostly to be small, but the estimates differ by outcome variables. The majority found the peak scale to be within ten miles for studies/records using productivity and wage as outcome variables. For entrepreneurship, the estimated results are overwhelmingly concentrated within one mile. The results are mixed for innovation: 30 percent concentrate within one mile, but many estimated ten to twenty miles or even more than fifty miles. In contrast, for firm and employee density, the results are more evenly distributed across distance categories. The patterns are similar for the maximum reach, except that for innovation, a greater share of studies/records estimated the scale to be within the range of one to ten miles.
Number of Studies/Records with Different Estimated Spatial Scales of Clusters.
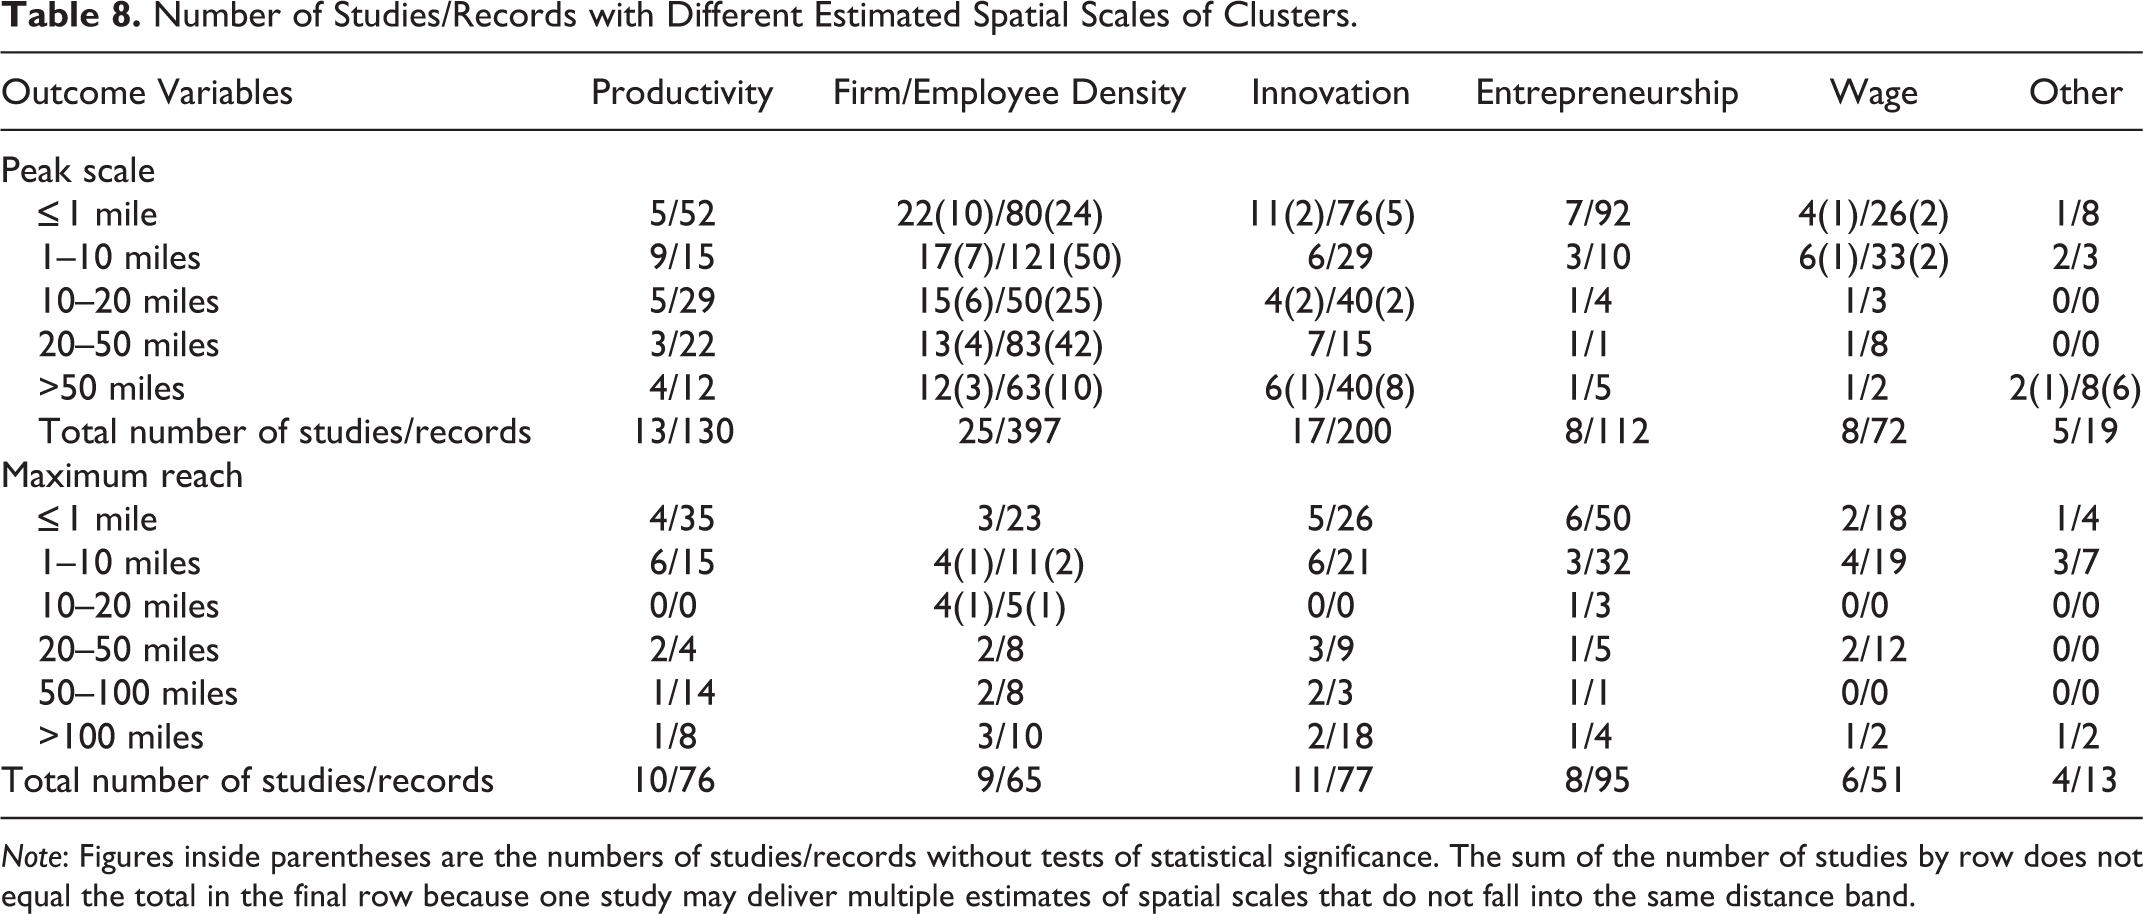
Note: Figures inside parentheses are the numbers of studies/records without tests of statistical significance. The sum of the number of studies by row does not equal the total in the final row because one study may deliver multiple estimates of spatial scales that do not fall into the same distance band.
Average and Median Estimates
To obtain a point estimate of the spatial scales of industrial clusters, we calculated the average and median scales, weighted by sample size. The estimated scales, again, vary significantly across outcome variables as Table 1 shows. Entrepreneurship as the outcome variable is associated with the shortest peak scale at 4.88 miles, wage follows at 7.59 miles, while productivity and firm/employee density show similar peak scales at about twenty-eight miles. Innovation is associated with the farthest distance at 33.86 miles, but only 27.23 miles if excluding studies without statistical tests, not much different from productivity and firm/employee density. Note that while the average estimates for wage and entrepreneurship are roughly in line with the distributional patterns (in Table 8), those for productivity, firm/employee density, and innovation are likely affected by outliers.
In these cases, the median estimate may be more suitable. The median peak scale has a much smaller variation across outcome variables, and the estimates are much more in line with the distributional patterns. The median estimate for entrepreneurship is 0.5 miles; for wage, it is 2 miles; for innovation, it is 4.71 miles; and for productivity and firm/employee density, it is 7.5 and 10 miles, respectively.
For maximum reach, the mean estimate for entrepreneurship is also the smallest, 13.23 miles, again followed by wage at 18.77 miles. The largest estimates are for innovation and productivity at 50.46 and 52.20 miles, respectively. The estimate for firm/employee density is in between at 18.77 miles. The median estimates, again, are much smaller and more in line with the distributional patterns: one to two miles for productivity, innovation, and entrepreneurship, six miles for wage, and 8.82 miles for firm/employee density.
These results imply that (1) mechanisms underlying each outcome variable are different, and thus clusters exhibiting these impacts prevail at different geographical scales; (2) a researcher needs to pick the most appropriate geographical unit to study the impact of clusters based on which outcome variables they are examining (e.g., those studying entrepreneurship needs to adopt micro-geographical data); and (3) for practical reasons, policy makers aiming to achieve different outcomes in their jurisdictions can use these findings to guide their development of industrial clusters at different geographical scales. A cluster that encourages entrepreneurship needs to concentrate geographically at 0.5–5 miles to exhibit the maximum impact.
Fundamental Differences and Methodological Choices Both Influence the Estimated Spatial Scale
The studies’ fundamental differences exhibit a significant impact on the estimated spatial scales of clusters; among them, different cluster mechanisms and sector of study appear to be the most prominent factors. Different cluster mechanisms, for example, explain 4 percent of the variation in estimated differences in peak scale, and 23 percent in maximum reach as Table 2 shows. Those examining “network” found a smaller peak scale than most of the other mechanisms, though the peak distance is not statistically significant. This is sensible as networks function at the interpersonal level, requiring face-to-face interactions that likely operate at a walkable scale (Arzaghi and Henderson 2008; Rosenthal and Strange 2005).
“Knowledge spillover” exhibits the largest peak scale and maximum reach among all mechanisms. This may be surprising, as tacit knowledge spillovers are thought to be most intensively exchanged at a localized scale. For example, when Wallsten (2001) measured knowledge spillovers by whether a small firm is more likely to obtain a Small Business Innovation Research Award after another nearby firm received one, he found that the peak impact occurred at a quarter mile of distance between the two firms. But then, as part or all of the knowledge is later codified, for example, turned into patents and new products, it can transmit with limited spatial decay across greater distances. For example, Gittelman (2007) found that patent citations, again measuring knowledge spillovers, can demonstrate effects extending to fifty miles. The finding is also consistent with studies of the impacts of universities and research institutes, which have suggested that knowledge spillovers that can be influential with infrequent face-to-face interactions and temporary proximity operate at large spatial scales (Drucker 2016; Goldstein and Drucker 2006; Hausman 2012; Torre 2008; Woodward, Figueiredo, and Guimarães 2006). This heterogeneity in knowledge and thus in the spatial scale of knowledge spillovers has gone largely unnoticed in prior studies. One exception is Duranton and Puga (2001), who argued that radical innovation is more likely to happen in bigger and more diversified cities (spatially unbounded) while routine innovation is likely to happen in smaller and more specialized cities (spatially constrained). Rather than treating “knowledge spillover” as a unitary phenomenon, researchers and practitioners should think carefully of the specific type of knowledge involved as well as the context of knowledge exchange processes.
“Localization” and “urbanization” both exhibit relatively large peak scales among all mechanisms, but only “urbanization” shows a relatively large maximum reach. In other words, “localization” does not appear to be more local than “urbanization” for its greatest impact but is more geographically constrained in terms of its extent. Similar to “urbanization,” “spatial proximity” appears to be less constrained in its peak scale and maximum reach. Finally, “competition” exhibits a medium peak scale, whereas its maximum reach is spatially constrained. These findings signal the importance of targeting different geographical scales in accord with divergent policy aims. To spur networking, a local geographical scale that facilitates frequent face-to-face interaction is critical (Gertler 2003; Storper and Venables 2004). For the exchange of codified knowledge and to embrace a general urbanization effect, a larger spatial scale is not an impediment.
These results also help us make sense of the literature that examines theories of localization, urbanization, and competition as contenders for explaining the most important source of cluster benefits. Beaudry and Schiffauerova (2009), for instance, summarized sixty-seven empirical analyses and found that studies revealing positive and significant urbanization effects outnumbered those that identified positive localization and competition effects. Their result is reasonable as most of the sixty-seven studies were based on regional level data, analyzing a relatively large spatial scale across which the effects of localization and competition may have decayed beyond detection (because they exhibit shorter maximum reach). The three sources of cluster benefits, rather than competing directly, may complement each other across the range of distances. The next breakthrough in cluster theories may come from figuring out how localization, urbanization, and competition interact at different spatial scales.
The sector of study also exhibits significant impacts on the estimated spatial scale as shown in Table 3. The manufacturing sector has the largest peak scale, followed by the service sector. Studies focusing on the high-technology sector estimated the smallest scales. This makes sense as high-tech industries rely more on face-to-face interaction to innovate and develop new products (Deltas, De Silva, and McComb 2015; Kolympiris and Kalaitzandonakes 2013), and manufacturing industries generally benefit more from input–output relationships rather than interpersonal network-building; the service sector falls somewhere in between. The spatial scale, and likely the clustering mechanisms, differs by industries, such that systematic comparison across sectors will be a constructive approach for future studies.
Aside from cluster mechanisms and sector of study, we tested how countries and vintages of study, and also different outcome and explanatory variables, affect the estimated spatial scales. (The detailed results are available upon request.) We found that clusters in France are associated with a significantly larger maximum reach than other countries, and the peak scale in France is also larger, though not significantly so. These findings show that clusters in different locations may exhibit distinctive spatial scales. We also found that earlier vintages generally are associated with larger scales, while studies of more recent decades tend to reveal smaller spatial scales; this differentiation is statistically significant for the estimated peak scale in the period after 2010. We think this is partly because recent data are more likely to be at the microlevel, and microlevel analysis units help reveal more local cluster scales (Table 4). Another possibility is that clusters have started to operate more at local levels in recent decades; with the rapid development and wide adoption of transportation and internet technology, the importance of distance has faded in some respects but not for the critical face-to-face interactions that must take place at the local level (Glaeser 1998; Packalen and Bhattacharya 2015; Storper and Venables 2004). We did not find statistically significant variation in estimated spatial scales across different outcomes and explanatory variables. Methodological choices play an important role in shaping the estimated spatial scales; these findings can provide essential guidance to researchers. For instance, the unit of analysis explains 48 percent of the variation in the estimated maximum reach and 9.9 percent in the peak scale (Table 4). In general, the larger unit, county, exhibits a significantly greater maximum reach than the microlevel geographic units, establishment/firm/patent, and zip code/census tract/grid or block. The same pattern exists for the peak scale, though statistically insignificantly. These results highlight the modifiable areal unit problem (Wong 2009). Introducing microlevel data helps overcome this problem and refine the actual scale of clusters. A second potential explanation is that researchers selected larger units when examining phenomena anticipated to have a broader reach. However, due to the lack of theoretical understanding and empirical consensus on which mechanisms prevail at which geographical units, even researchers who correctly selected relatively larger or smaller areal units were unlikely to have been able to select the optimal unit a priori. Thus, adopting multiple units to test for robustness remains important, both for scholarly rigor and for supporting practical policy recommendations.
Studies using regressions and spatial models are associated with a smaller maximum reach compared to those adopting other analytical methods as shown in Table 5. Regression and spatial models can control for other variables and consider overlapping spatial configurations. This added information may help refine the detection of the maximum reach of clusters. For instance, a kernel method may detect significant employment at a specific maximum reach. However, suppose employment were to diminish more rapidly than population with increasing distance. In such a case, employment at the detected maximum reach may not indicate a cluster after controlling for population density. Thus, we recommend considering more types of relevant data.
The quality of studies demonstrates a limited role. We did not find the journal impact factor or article citations to significantly affect the estimated peak scale or maximum reach. (The results are available by request.) Of course, it may be that these variables are not very good proxies for study quality.
Table 6 puts all of the explanatory factors together to estimate a complete model. The explanatory factors combine to explain 37.8 percent of the variation in the estimated peak scale and 91.7 percent of the variation in the estimated maximum reach. The maximum reach is much better explained due to its relative homogeneity. Many fewer studies estimated the maximum reach. Additionally, the quality of the information used in these studies often is superior (calculating maximum reach is more demanding of the underlying data), and the estimation procedures are more precise (requiring multiple distance bands or other methods of comparison across varying distances).
Several groups of explanatory variables suffer from multicollinearity problems. For example, more recent data are also more likely to pertain to finer geographic scales. As a result, some of the coefficients become statistically insignificant—the primary reason why we also analyzed groups of variables separately in Tables 2 –5. We tested the normality of the error terms; the estimated residuals do appear to be nearly normally distributed. The clustered standard errors, as mentioned above, account for heterogeneity across studies.
The results in Table 6 are, in general, consistent with those in Tables 2 –5, with a couple of exceptions. First, the impact of the country of study becomes more prominent. France and Germany are associated with clusters with greater maximum reach, while Italy, in contrast, has clusters with smaller maximum reach. Moreover, clusters in Japan have both smaller peak scale and maximum reach than those in many other countries. These differences have not been well noticed and understood in prior studies. One potential reason lies in the different city structures across countries. While in France and Germany, labor and knowledge move relatively freely and thus can produce clusters that extend afar, in Italy, local labor markets are more restricted in their spatial scopes, constraining the impacts of clusters within these local markets (Di Addario and Patacchini 2008). In comparison to Western countries, urban areas in Japan are denser and more transit-dependent. The dense urban centers permit cluster effects to accrue more quickly within shorter distances, and the well-developed public transit systems make mobility easy within the central city areas. But beyond city boundaries, the absence of a well-developed transit system hinders the spillover of cluster benefits. In contrast, car-dependent Western cities can more easily expand cluster effects to much greater distances via automobiles. In addition, each of these countries has a long, unique history of urban development, which may represent path dependency in both urban form and cluster patterns today.
These comparisons suggest the importance of locality heterogeneity. Different geographical ranges should be considered for various countries to initiate cluster policies. For example, firms in Japan need to be (and perhaps ought to be encouraged to be) more geographically concentrated than those in Western countries in order to reap the maximum benefits of clusters.
The second exception is that independent variables become more statistically significant in explaining the differences in maximum reach due to the control of other related variables. Agglomeration index and distance as explanatory variables are associated with larger maximum reach, while R&D is associated with the smallest maximum reach. This indicates that the impacts of agglomerations (high concentrations of firms and workers in related industries) and of the distance from the urban center itself can encompass substantial distances, but the impact of R&D is more localized. This finding is reconcilable because the cluster effect, in essence, is the externalities between firms. Both distance from the urban center and agglomeration index effectively capture these externalities that are not easily confined in space, while the effect of R&D can be spatially restricted within a single firm or a few neighboring firms. This is also consistent with the previous discussion of two types of innovation. R&D investments are more associated with an early-stage radical innovation that is not easily transferrable over long distances. Thus, R&D’s external effects are more likely to be exhibited through face-to-face communications, which are more constrained by physical space.
There is a general trend for later vintages to be associated with smaller spatial scales, which is consistent with the previous findings. Smaller units are associated with a shorter peak scale and maximum reach for the unit of analysis, which fits with the results in Table 4. Different outcome variables are not statistically significantly associated with different spatial scales. Findings for various cluster mechanisms match the results in Table 2. For the peak scale, knowledge spillover is associated with the largest scale, while network is associated with the smallest scale; competition, spatial relationship, localization, and urbanization fall in between. Competition in Table 6 shows a greater peak scale than it does in Table 2, though, and knowledge spillover and spatial relationships are associated with a broader maximum reach. In comparison, competition, localization, and urbanization are associated with smaller maximum reach.
Turning to industrial sectors, the manufacturing sector is associated with a larger peak scale and maximum reach than the high-tech industry as in Table 3. One slight difference in the full specification is that the service sector is associated with about the same peak scale and maximum reach as the manufacturing sector. Finally, studies published in journals with higher impact factors are associated with a smaller peak scale. These studies likely adopt more precise estimation methods and make use of more detailed and higher quality data, thus yielding more refined estimated spatial scales.
Conclusion
We conducted a meta-analysis to estimate the spatial scale of industrial clusters, combining and integrating the findings from prior empirical studies. Quite a large number of empirical studies have estimated the spatial scales of industrial clusters, producing mixed results. Moreover, these analyses are difficult to compare, encompassing a variety of methods, outcomes, industrial sectors, and contexts. A meta-analysis is useful in reconciling inconsistent empirical findings and revealing patterns hidden in the existing pool of evidence. We estimated the average and median spatial scales associated with different cluster outcomes (e.g., productivity, innovation, entrepreneurship, and wage) and probed the factors associated with the variation in spatial scales. In doing so, we revealed the following facts that contribute to our knowledge of clusters.
Innovation as an outcome of clusters and knowledge spillovers as the underlying mechanism can happen at either highly localized or wider geographical scales, depending on the type of innovative activities in question. Early-stage and radical innovation happen at local scales, as such creative activities require face-to-face interaction and the exchange of tacit knowledge (Gertler 2003). This is consistent with the finding that entrepreneurship as an outcome of clusters happens at more local scales, since entrepreneurial activities essentially are early-stage and radical innovative activities with new businesses as the products. Another corroborating piece of evidence is that networking is also found to occur at local levels, consistent with prior studies (Arzaghi and Henderson 2008; Storper and Venables 2004). Entrepreneurial activity and early-stage innovation usually require not only the exchange of knowledge but also relationship-building, networking, and collaboration. In contrast, other innovative activities are more routine and require mostly codified knowledge, such as refining and building on an existing patent. Citing a patent does not require physical proximity to the inventor, though a shorter distance may boost the chance of becoming aware of a particular patent. Thus, for those types of innovation, the effect of clusters can extend far afield. Few studies to date have differentiated among types of innovation, which this analysis suggests is much needed. Also, different measurements for innovation and knowledge spillover capture various types of innovative activities; for example, the form of new businesses, collaborative projects, and innovation awards capture more of the early-stage and radical innovation, whereas patent citations capture more of the transmission of already codified knowledge. Researchers should be cognizant of such subtle distinctions in what they are measuring and use different measures to distinguish among kinds or stages of innovation.
This study has made it clear that cluster benefits accrue at different geographical scales for distinct sectors and sources of cluster or urban agglomeration benefits. High-tech industries that require more radical innovative activities colocate at smaller geographical scales. In contrast, manufacturing industries involve more routine innovative activities and can benefit from expansive clusters in terms of labor pooling and supply chain relationships. Thus, studies that combine all sectors together are less effective in revealing the precise spatial territory of cluster effects. The mechanisms by which members of industrial clusters gain benefits operate differently at various spatial scales as well. Rather than adopting a horse-race approach to rank the relative importance of localization, urbanization, and competition mechanisms, it would be more valuable to investigate how these processes may interact and even complement each other at differing spatial scales. We look forward to future studies probing into these detailed differences across industries and cluster effects.
Our analysis highlights several methodological issues, such as the choice of unit of analysis, model approaches, and whether or not to conduct statistical tests, that can significantly affect the estimated spatial scales. In general, testing data at various geographical levels can help mitigate concerns regarding the modifiable areal unit problem (Wong 2009). Alternatively, researchers can use microlevel data where they are available, avoiding aggregating the measured clusters into broader spatial units. Microlevel data also support more detailed and finer-grained analyses and methods. An appropriate model choice, or sensitivity tests across various models, is critical to producing robust and trustworthy results. The choice to conduct statistical tests also has a significant relationship with the estimated geographical scale. A large difference in the magnitude of cluster benefits or spatial patterns may not be statistically significant; in contrast, a statistically significant difference may be small in magnitude. We suggest performing statistical tests where they are feasible, while also paying attention to the difference in magnitude to judge whether findings are substantively meaningful.
We find significant differences across countries. Clusters show distinctive patterns in various European countries and are spatially more constrained in Japan. These discoveries beg for additional investigation to explain their origins. We suspect that the connections (or lack thereof) among inner cities and suburbs, transit accessibility, and path dependency in urban forms may be important.
Practically, the most important lesson to be learned from this study is that cluster strategies ought to be tailored to specific regional and industrial needs. Different geographical scopes should be targeted for the design and implementation of policies in different regions. In other words, examining the specific geographical pattern of cluster effects in different regions is a prerequisite for designing effective policies.
Policies aiming at different outcomes such as promoting entrepreneurship and networking, encouraging specific types of innovation, or enhancing productivity, operate best at different geographical scales. In order to better encourage entrepreneurship and early-stage innovation, cities must not only encourage (related) firm concentration at a walkable scale but also provide a built environment that sustains frequent face-to-face interactions, such as with walkable streets (Ewing and Handy 2009; Hamidi and Zandiatashbar 2019) or a variety of social spaces (e.g., coffee shops, bars, and restaurants; Mehta and Bosson 2010).
Finally, policies ought to be tailored to the specific needs of industries. High-tech companies benefit from a similar spatial scale and local infrastructure as entrepreneurs, early-stage innovators, and networkers. In comparison, manufacturing companies require high-quality labor and well-integrated downstream and upstream supply chains, and their clusters are less constrained spatially. If future studies can delve more deeply into the detailed variations across industries, we anticipate that future cluster strategies can be more closely tailored and targeted than currently and that companies will be more fully able to realize the potential benefits of clusters.
The estimates derived in this research can provide initial directions toward targeting specific geographical scales in cluster policies, for example, suppose the state of Illinois is interested in encouraging firm concentrations in advanced manufacturing in order to spur entrepreneurship. In that case, the peak scale for this cluster will occur at a distance of approximately ten miles, and the maximum reach is around 392 miles, according to the estimates in Table 6. Thus, policies to promote advanced manufacturing entrepreneurship in Illinois can aim at relatively sizable areas to achieve maximum cluster benefits. The impacts of these industrial districts can extend quite far. Because of the wide range of estimates in the literature, we emphasize that the scale estimates calculated from this meta-analysis should be considered preliminary. They offer immediate but tentative guidance and provide an impetus for focused study to derive more precise estimates of the scale of industrial clusters in specific localities and contexts.
Footnotes
Declaration of Conflicting Interests
The author(s) declared no potential conflicts of interest with respect to the research, authorship, and/or publication of this article.
Funding
The author(s) received no financial support for the research, authorship, and/or publication of this article.