
Abstract
The aim of this study was to investigate threats and physical violence in the workplace by comparing four areas of human service work, namely psychiatry, eldercare, the Prison and Probation Service (PPS), and special schools (SS). The results revealed that there were statistically significant differences in the frequency of threats and violence among these areas of human service work. In particular, employees in SS were frequently exposed. More exposure was related to a higher degree of reporting incidents in writing to the workplace. However, exposure was not consistently related to self-rated seriousness of the incidents or attitudes that reflect accept of workplace threats and violence. Both threats and physical violence were rated within a moderate range of seriousness in all these areas of work. PPS and SS expressed more accept (attitude) of workplace threats and violence in comparison to psychiatry and eldercare. Conclusion: workplace threats and violence toward staff in areas of human service work is a widespread phenomenon. There is a particular need for better prevention in SS, more research on the seriousness of threats in general, and more knowledge about the relationship between work environment and attitudes about workplace threats and violence.
Threats and physical violence in the workplace has been recognized as a particularly prevalent problem in the human services sector. The higher percentages of workplace violence can be attributed to the working environment, where workplaces have much higher percentages of working directly with the public and working with unstable or violent persons (U.S. Department of Labor, U.S. Bureau of Labor Statistics, 2005). Therefore, this study on workplace violence and threats has chosen to further examine areas of human service work.
The purpose of this article is to compare and explore estimates of workplace violence and threats between high-risk areas. Within the literature on workplace violence three areas are regarded as particularly affected, namely psychiatry, eldercare, and the Prison and Probation Service (PPS; Hogh & Viitasara, 2005). However, in the course of a literature search on workplace violence, it became clear that there were no studies specifically concerned with workplace violence or threats among special education staff; despite evidence that suggests that special education educators are at an increased risk in comparison to classroom educators (Gerberich et al., 2011). We included special schools (SS) in order to examine the prevalence in comparison to areas traditionally regarded as high-risk within the human service sector.
Previous studies show that the prevalence of threats and violence varies considerably (Schat & Kelloway, 2005). For instance, evening workers in the Danish eldercare were subjected to 43.1% and 35.1% threats and violence respectively (Nabe-Nielsen, Tüchsen, Christensen, Garde, & Diderichsen, 2009), in comparison to nurses/nursing personnel in U.S. care institutions, who had a prevalence of 19.4% and 19.9% for physical and psychological violence respectively (Campbell et al., 2011). In a Canadian study of teachers, 80% indicated that they had experienced some type of violence in their career, with covert violence being the most frequently reported type of violence (75.2%; Wilson, Douglas, & Lyon, 2011). Some studies have highlighted particular subgroups of employees that are particularly at risk, such as special education teachers, who are almost five times more at risk than classroom educators (Gerberich et al., 2011), or nurses in psychiatry, who are almost twice as much at risk of any workplace violence than nurses in pediatrics (Campbell et al., 2011). Despite violence once being seen as exclusively a problem for occupations like prison officers, there are no recent studies on the prevalence among employees in prisons. A study from 1998 reported that 26% of prison officers in an American urban jail were subjected to violence, and 20% reported being exposed to more than two incidents (Safran & Tartaglini, 1998).
Trying to compare estimates of work-related violence in areas of human service work is complicated, because studies use different definitions of workplace violence, use different methods and collect data at different time points. One definition of workplace violence includes consequences of the violent incident, such as sick leave or bruising (Carmel & Hunter, 1993; Klein et al., 1997). A second way of defining workplace violence is by asking respondents to assess a range of violent and/or threatening behavior (Leather, Lawrence, Beale, & Dickson, 1998; Sharipova, Borg, & Hogh, 2008). Also, studies use different time periods for assessing violence/threats, that is, previous year or entire career (Menckel & Viitasara, 2002; Wilson et al., 2011). Several studies do not distinguish between threats and physical violence, but combine them into one question (Hogh, Sharipova, & Borg, 2008; Lawoko, Soares, & Nolan, 2004; Menckel & Viitasara, 2002). Furthermore, studies differ in their objectives, which entails that fatal, nonfatal, physical, or verbal (threats) violence may or may not be included in the definition of workplace violence.
The fact that studies are difficult to compare is a problem, because it is not possible to determine if estimates such as frequencies, perpetrators, degree of reporting, self-rated seriousness or attitudes about workplace violence are more or less similar in areas of human service work. Most studies have adopted an approach, where one occupation or one risk sector, that is, the health care sector, is examined. This approach may be preferred since being subject to violence at work involves a complex set of antecedents (Hogh & Viitasara, 2005). However, this makes it difficult to compare different areas of work or sectors.
Reporting systems are an integral part of violence prevention policies; also, reporting is a formal requirement in the case of absence from work due to incidents of workplace violence (The Danish Work Environment Authority). The issue of reporting incidents of threats and/or physical violence is relevant when comparing different areas of human service work, because some researchers have found that more frequent exposure to violence was related to more reporting (Sharipova et al., 2008). Sharipova et al. (2008) investigated whether type of perpetrator was related to reporting, and found that reporting was more frequent when the violence was performed by someone other than clients. Furthermore, they found that reporting was dependent on the degree of self-rated seriousness of the incident, which in turn may be related to the type of client, that is, a psychiatric patient, an elderly client, an inmate, or a pupil with a behavioral problem. The study, however, only included employees in eldercare and a measure of physical violence, thus the association between the frequency of physical violence and of threats, reporting, self-rated seriousness, and type of perpetrator in different areas of human service work still needs to be addressed.
Very few studies have investigated beliefs or attitudes about threats and violence in the workplace—and these studies only include health care staff (Åkerström, 2002; Bilgin & Buzlu, 2006; Poster, 1996). Poster (1996), as well as Bilgin and Buzlu (2006), found that a great majority of the staff expect to be assaulted at some time in their careers. In addition, Poster (1996) found that nurses exposed more than three times were more likely to agree that assaults were to be expected. These beliefs coexisted with a significant underreporting, in which half of the nurses did not report the incidents (Bilgin & Buzlu, 2006). One possible explanation for this underreporting could be that patient’s aggressive actions are often downplayed or accepted with reference to the patient’s illness. In fact, Åkerstrøm (2002) suggests that workers in the caring occupation avoid framing incidents as “violence” in order to keep and continue to work with patients. In contrast, Åkerstrøm writes: “No one expects service providers in prisons to like or respect prisoners, but one does expect staff in mental hospitals to understand their patients . . . ” (Åkerstrøm, 2002, p. 533). This raises the question whether these occupations are, in fact, different concerning their attitudes about workplace violence, which in turn, may influence the degree of reporting and self-rated seriousness. In particular, attitudes that reflect a form of accept of workplace violence could imply lower self-rated seriousness and lower reporting of incidents.
Our study intends to compare the four areas of human service work on the following estimates: frequency of threats and of physical violence, perpetrators, degree of reporting incidents, self-rated seriousness of the incidents, and attitudes about workplace violence. This comparison is possible because data is collected within the same methodology, use of the same definitions of threats and physical violence, and in the same time period.
Method
Research Design and Participants
This article presents descriptive findings comparing four areas of human service work. The study is the first part of a large prospective 1-year follow-up survey, in which participants were given a questionnaire at baseline, which will be followed by a shorter version of the same questionnaire 12 months later.
Criteria for inclusion in the project were employees at worksites within the four areas of human service work, namely psychiatry, eldercare, PPS, and SS (schools for pupils, from 5 to 18 years of age, who are affected by autism, attention deficit/hyperactivity disorder (ADHD) or general learning disabilities (mentally retarded). Each worksite should have a minimum of 18 employees. Furthermore, employees without client contact, who had been absent from the worksite more than 3 weeks prior to receiving the questionnaire, or had been employed less than 3 weeks at the worksite were excluded from the study.
In order to recruit participants we had meetings with the top managerial level, which is in the municipal for the eldercare and counties for psychiatry; eight out of 11 municipalities decided to participate, and two of the three counties accepted to participate. Hereafter local leaders were assembled and invited to participate. Four psychiatric worksites did not meet the inclusion criteria, but all other worksites were included. SS are organized somewhat differently, therefore, each school was directly approached. Fourteen agreed to participate in the study, two declined. With regard to the PPS all the staff was included in the project.
Data Collection—Baseline Survey
A web-based questionnaire was used for participants in the PPS; participants from the other areas of work received and filled out paper-and-pencil questionnaires during a planned meeting at the worksite. A researcher attended these meetings and completed questionnaires were returned to the researcher at the end of the meeting. Employees who did not participate in the meeting were asked to fill out and send the questionnaire directly to the researchers. It was stated in the cover letter of the questionnaire that participation in the study was voluntary and that the data would be treated confidentially. All questionnaires were collected in the period between May 2010 and October 2010. The study was carried out according to the Helsinki declaration of ethics.
Study Sample
The response rate was 86% (n = 930; 35 worksites) for the psychiatry, 82% (n = 966; 29 worksites) for the eldercare, 62% (n = 2,843; 83 worksites) for the PPS, and 90% (n = 758; 14 worksites) for SS. A total of 161 work sites and 5,497 respondents. Data on gender and age was retrieved from the survey (Table 1).
Description of Study Sample (%).
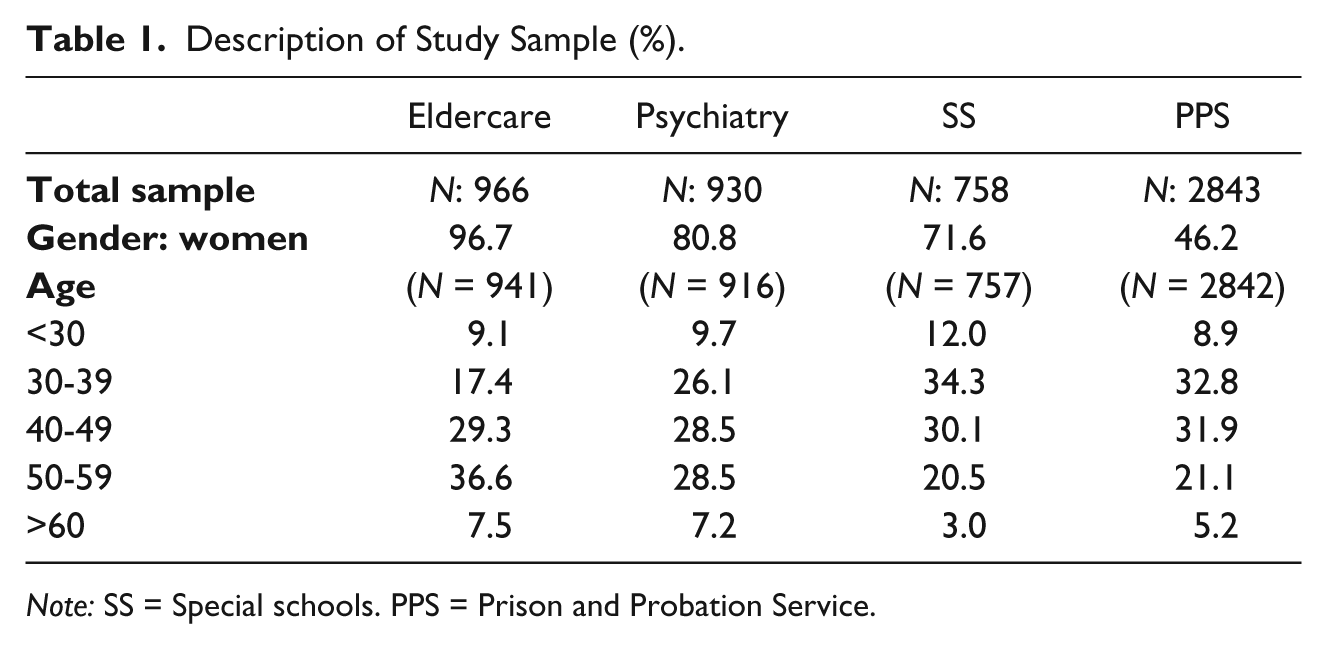
Note: SS = Special schools. PPS = Prison and Probation Service.
It is clear that staff in eldercare, psychiatry, and SS is predominantly female. The percentages are comparable to U.S. statistics that show that 88.2 % in nursing, psychiatric, and home health aides are women, and that 85.1 % of special education teachers are women (U.S. Department of Labor, U.S. Bureau of Labor Statistics, 2011). However, the PPS have almost equal numbers of men and women, which is unlike U.S. statistics, where only 26.1% of bailiffs, correctional officers, and jailers are women.(U.S. Department of Labor, U.S. Bureau of Labor Statistics, 2011) Some of this difference can be attributed to the fact that 18.1% of the employees in the PPS work as health personnel, teachers, social workers, and other job functions. However, it does seem that there is a gender difference, which could be due to cross-cultural differences in the protective service occupations.
Measures
The questionnaire includes one section that inquires about threats and another section that deals with physical violence. Each section was introduced by the question “Have you been exposed to threats (physical violence) at your current workplace within the past 12 months” followed by a list of threatening and violent behavior respectively. Threatening behaviors included: threats of beatings, written threats, threats in a scolding manner, threats in an insulting manner, threats over the phone, threats involving objects, and indirect threats (toward family). Types of physically violent behaviors were: spitting, hitting, hitting with object, scratching/pinching, shoving, being held, punching with a fist, kicking, biting, having a hard object thrown at you, and use of a weapon or weapon-like object (Menckel & Viitasara, 2002). A 5-point response-scale was given for each question: “No”, “Yes, now and then”, “Yes, monthly”, “Yes, weekly”, and “Yes, daily”. In the analyses, “now and then” and “monthly” were categorized as occasional, while “weekly” and “daily” were categorized as frequent. In order to test for significant differences we collapsed the items into a threat scale and a physical violence scale, where a high number indicate a high frequency. Both scales had high Cronbach’s α of 0.79 and 0.88, indicating a high internal consistency of the scales. These scales were also used to examine the correlation of exposure and attitudes.
The exposed participants were asked who the perpetrator(s) were: “A client”, “A relative to the client”, “A coworker”, “A superior”, “A subordinate”, and “Other people”. This item was made to fit the specific area of work by exchanging “client” with either “pupil”, “patient”, “elderly citizen”, or “inmate”. It was possible to report several perpetrators.
The questionnaire included two items on reporting incidents, “Have these threatening (or violent) incidents been reported in writing at the workplace?”. Participants were asked to state the degree of reporting incidents: “None”, “Less than half”, “Half”, “More than half”, or “All”. “Half” and “More than half” were collapsed into one category.
The degree of seriousness was measured by one question: “How serious would you rate the worst incident at the time that it occurred”. This item was measured on a scale from 1 to10, where 1 was labeled “not serious” and 10 labeled “Extremely serious” (Sharipova et al., 2008). The question was repeated for both threats and physical violence.
Finally, the questionnaire included five items concerning attitudes about physical violence and threats; both nonexposed and exposed participants were requested to answer. They were asked to what degree they agreed with the following statements: “Threats and violence are a part of the job”, “You get use to it”, and finally “You have to accept the risk”. Possible answers were: “Totally agree”, “Somewhat agree”, “Neither/nor agree”, “Somewhat disagree”, and “Totally disagree”. In the analyses these responses were collapsed into the categories agree, disagree, and neutral.
Statistics
Statistical analyses were performed in SPSS, version 18. The results are mainly based on descriptive analyses. In a one-way between-subjects ANOVA, we tested the differences in exposure to threats and to physical violence in the four areas of human service work. To control for multiple testing error we also did the analysis with a Bonferroni-correction and the significance level was set at 0.01; this did not change the statistical significant differences in exposure. Pearson’s product-moment correlation was computed to measure the associations between threats or violence and attitudes towards threats and violence in the workplace.
Results
Degree of Reporting Incidents
The degree of reporting threats and physical violence in writing at the workplace varied somewhat between the four areas of work (see Figure 1). The eldercare had the highest degree of “not reporting” of both threats (58.3%; N = 501) and of physical violence (53.5%, N = 473); similarly, almost half of the respondents in the PPS did not report neither threats (47%, N = 1,584) nor physical violence (48.6%, N = 461). In comparison, about one third did not report threats and about one fourth did not report physical violence in SS and in psychiatry. The latter also had the highest degree of reporting “all” incidents of physical violence (31.6%, N = 602), while the PPS had the highest degree of reporting “all” threats (20.0%, N = 1584).

Degree of reporting.
Frequency of Threats and Physical Violence
The most frequent type of threat across all four human service areas of work was threats in a scolding manner, and the second most frequent was threats in an insulting manner (Table 2). The least frequent threats were written threats and threats over the phone.
One Year Frequency of Different Types of Threats (%).
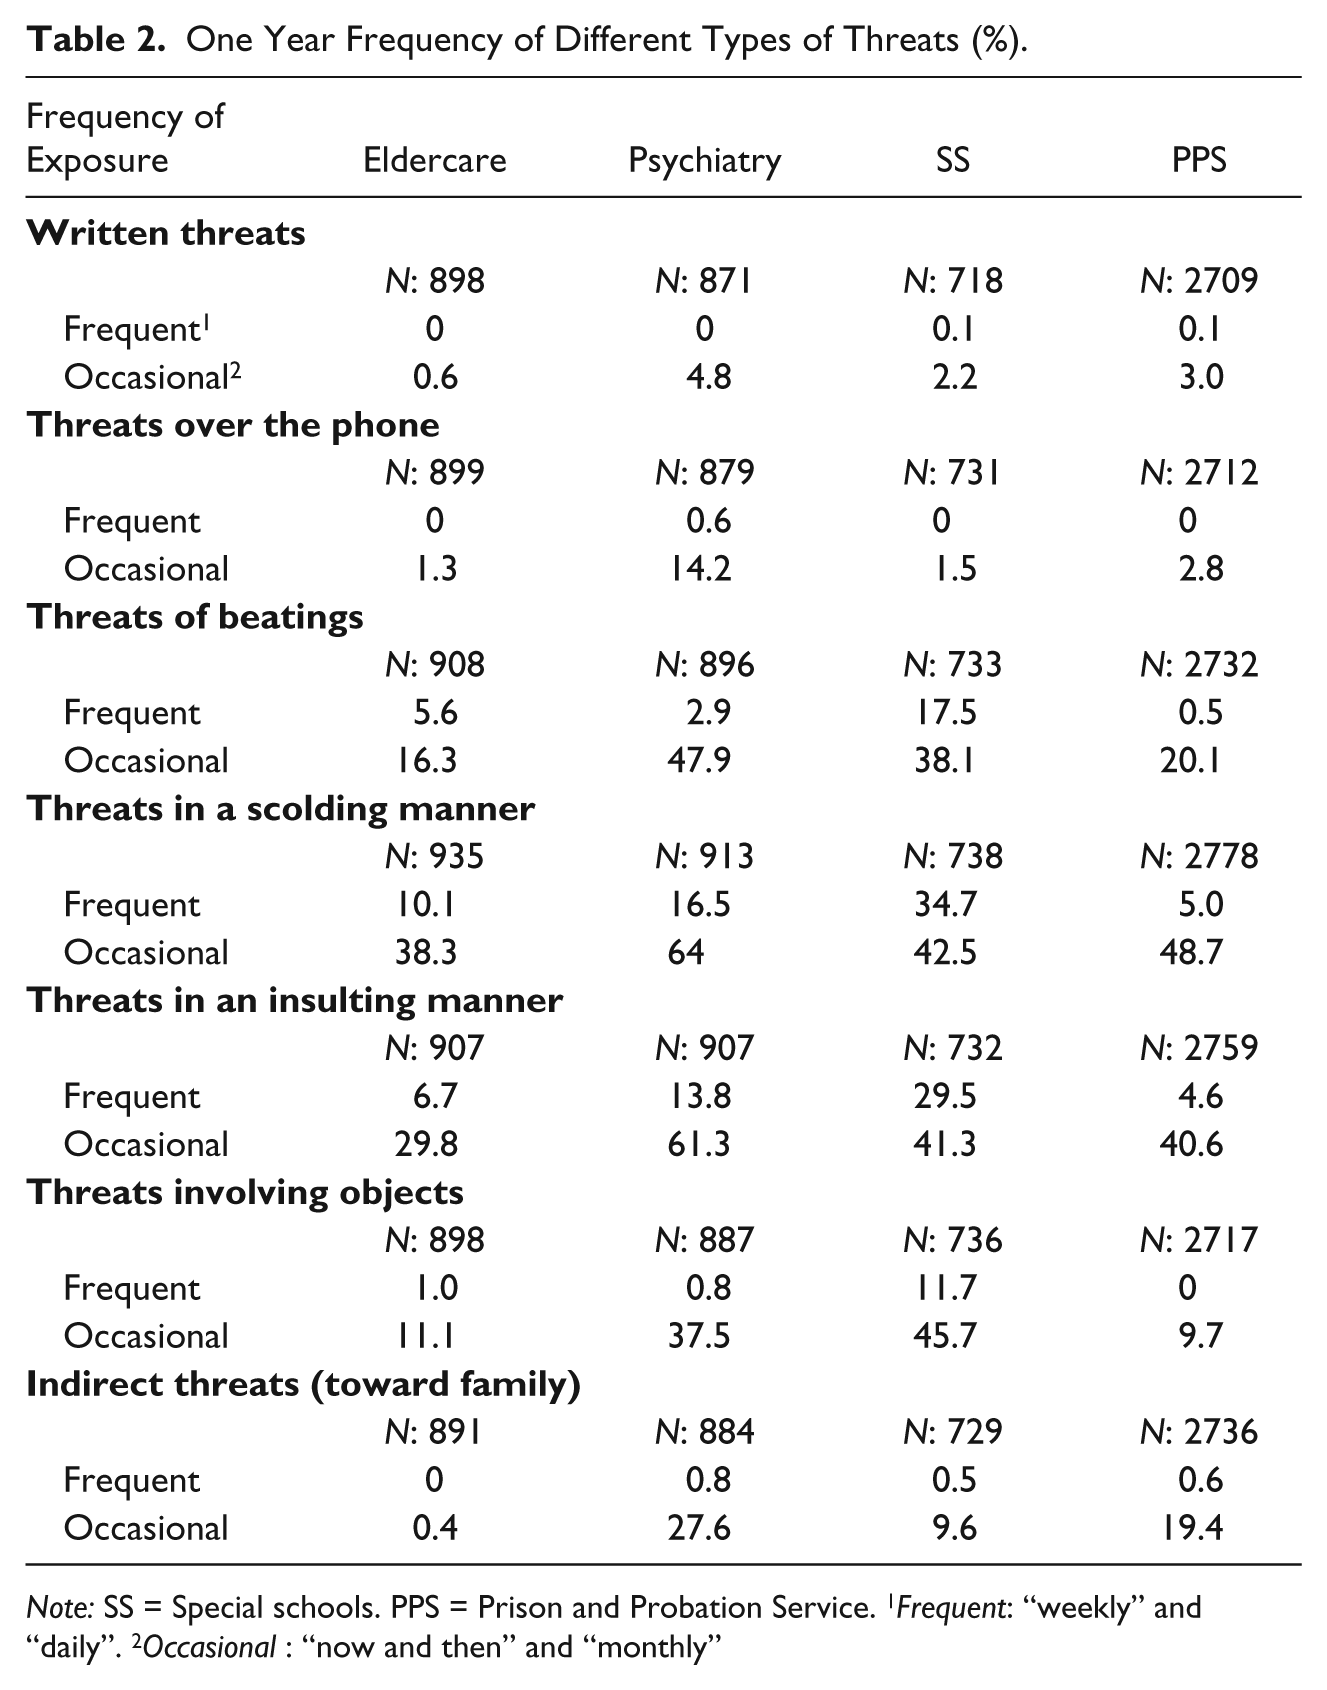
Note: SS = Special schools. PPS = Prison and Probation Service. 1Frequent: “weekly” and “daily”. 2Occasional : “now and then” and “monthly”
There seems to be a difference between the four areas of work, in which SS and psychiatry had higher frequencies of threats compared to the eldercare and the PPS. However, among the less frequent threats (written threats, threats over the phone, and indirect threats) psychiatry and the PPS were relatively more exposed.
Physical violence was more frequent in SS than in any of the other area of work (Table 3). Especially scratching/pinching (15.4%), shoving, (12.1%), and hitting (17%). In addition, SS were more exposed to occasional violence, where 57% were exposed to shoving, 49.6% to having a hard object thrown at you, and 46.1% to hitting. Psychiatry also had a relatively high degree of occasional violence, that is, shoving (43%). In the eldercare the most frequent types of occasional violence were: scratching/pinching (28.9%), hitting (21.5%), and shoving (20.2%). Staff in the PPS were the least exposed to both the frequent and occasional violence. In the latter, the most frequent types were: shoving (11.9%), having a hard object thrown at you (7.5%), and spitting (6.5%). Tables 2 and 3 also show that threats had higher frequencies than physical violence. In particular, threats were more common than physical violence in the PPS.
One Year Frequency of Different Types of Physical Violence (%).
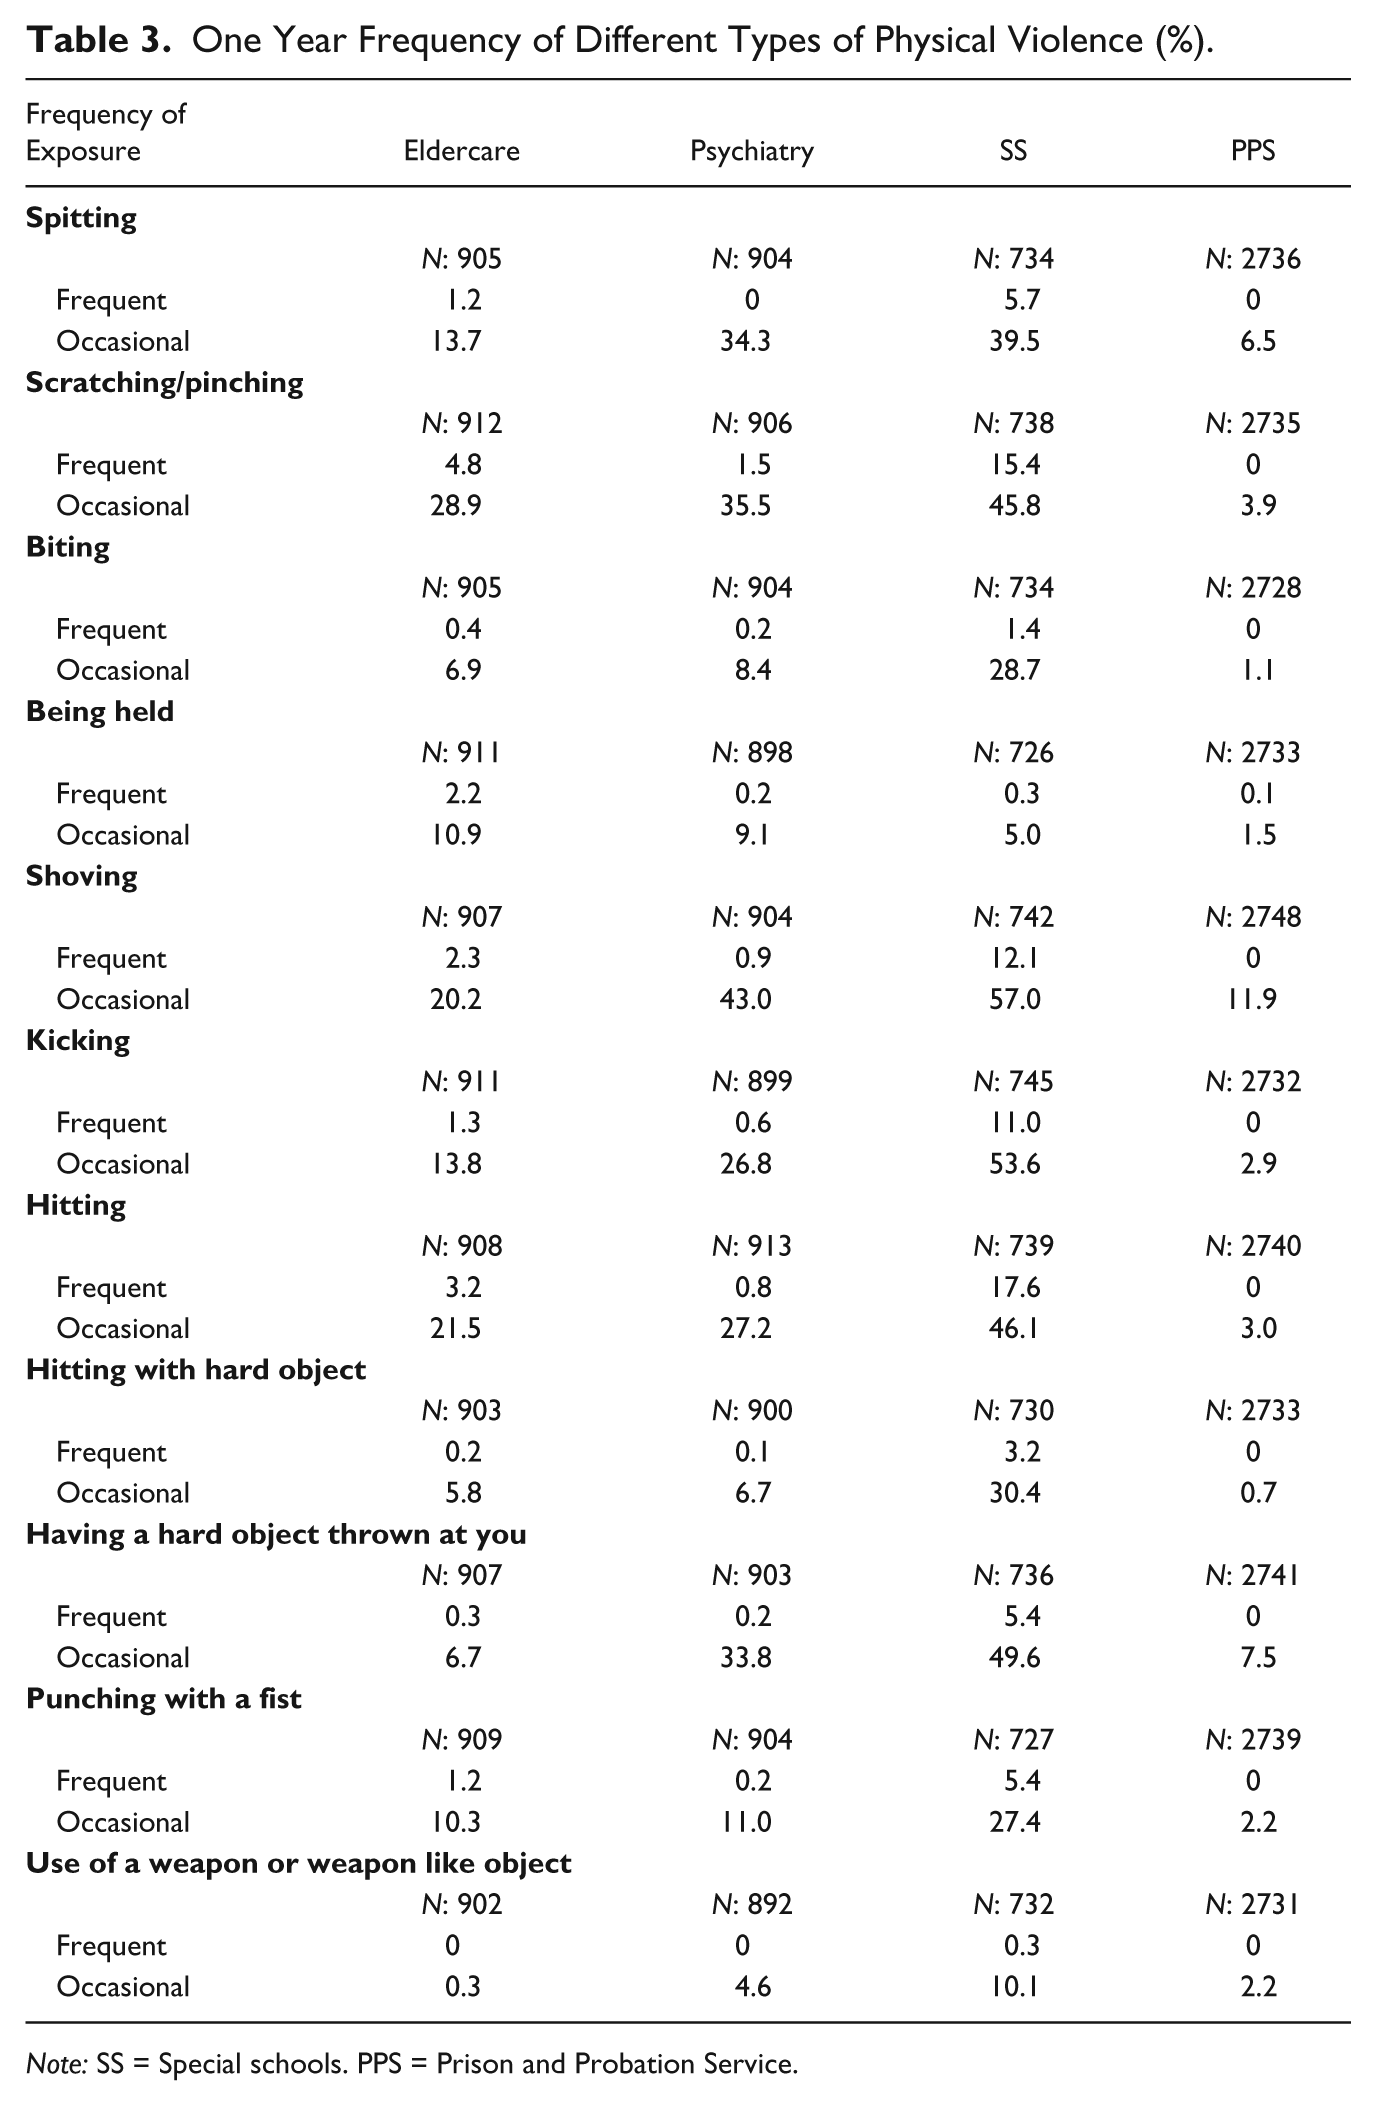
Note: SS = Special schools. PPS = Prison and Probation Service.
To test whether the differences in exposure were statistically significant an oneway-ANOVA was performed. The test showed that psychiatry and SS differed significantly to other areas with respect to exposure to threats, while eldercare and the PPS were not significantly different from each other (Table 4). However, we found statistically significant differences on exposure to physical violence among all areas of human service work.
Differences in Exposure to Threats and Exposure to Physical Violence Among the Four Areas of Human Service Work.
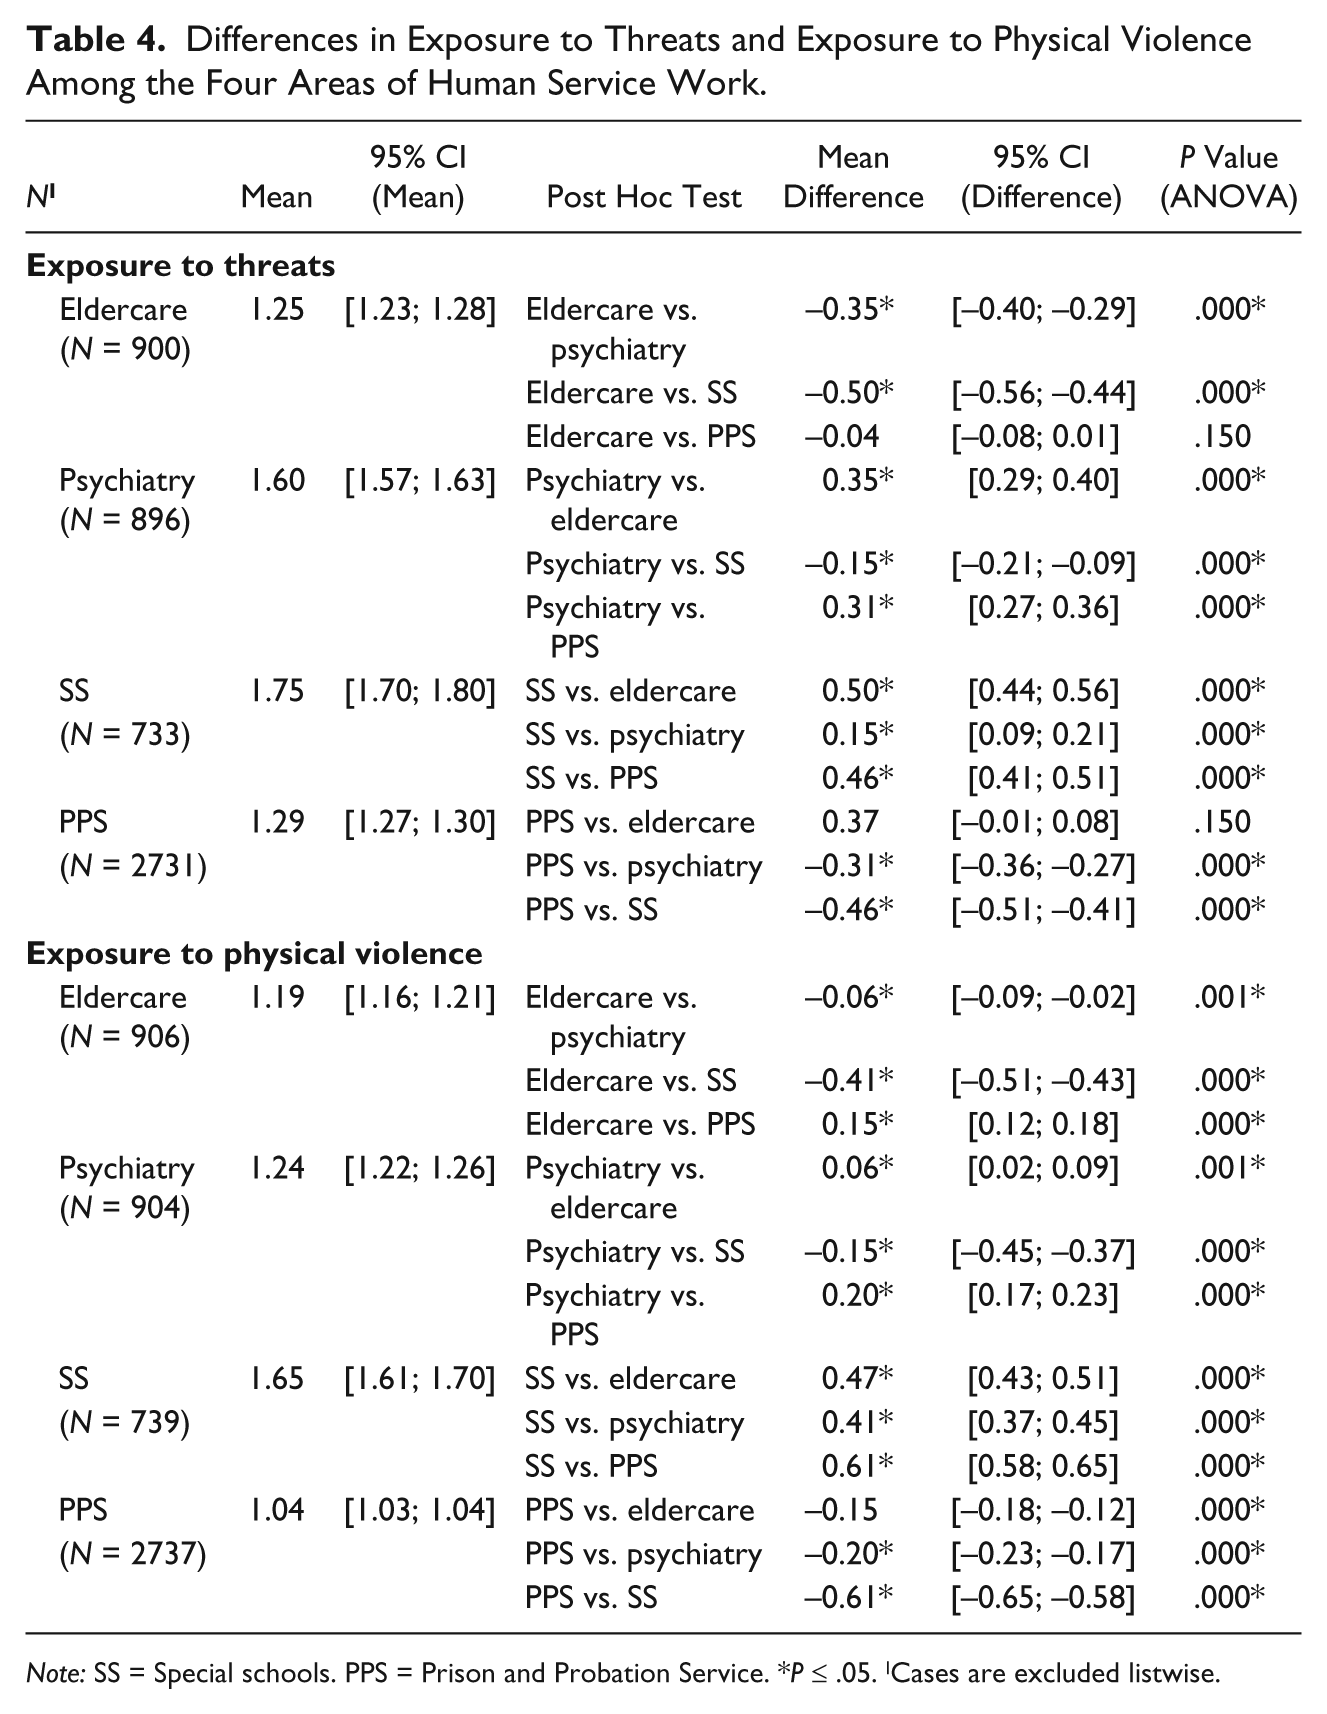
Note: SS = Special schools. PPS = Prison and Probation Service. *P ≤ .05. ICases are excluded listwise.
Perpetrators of Threats and of Physical Violence in the Workplace
In all areas of human service work about 90% of perpetrators of threats and physical violence were clients, with the exception of the PPS where only 73.7% (physical violence) were clients. In particular, SS reported that 99.8% of both threats and physical violence were from pupils (clients). In all four areas of work, threats were more common than physical violence from client’s relatives; 10.1% reported threats from relatives in psychiatry, 8.0% in the PPS, 7.8 % in elder care, and 1.8% in SS. Few were exposed to threats or physical violence from colleagues or superiors (0-3.2%); however, the PPS and the eldercare had more than twice as many threats from colleagues (2.4% and 1.7%) than the other two areas of work. In addition, the PPS had more than four times as many threats from a superior (3.2%) and was the only area that reported physical violence from a superior (0.3%). Only the eldercare and the PPS reported threats or physical violence from subordinates, while psychiatry reported more threats (1.3%) and the PPS more violence (0.7%) from others in comparison to the other areas of work.
Self-Rated Seriousness of the Most Distressing Incident
On a scale of 1 to 10, where 1 was labeled “not serious” and 10 labeled “extremely serious” the mean score was used to compare results from the four areas of work. The most distressing threat in the eldercare (n = 495) was rated 4, in both SS (n = 605) and the PPS (n = 462) it was rated 5, and in psychiatry (n = 766) it was rated 6. The most distressing physical violence was rated 6 in both the PPS (n = 462) and psychiatry (n = 568), while in SS (n = 591) it was rated 5, and in the eldercare (n = 402) rated 4.
Attitudes About Workplace Violence
A comparison of attitudes and the four areas of work showed that the majority of respondents in the eldercare and in psychiatry disagreed with the statement “Threats and violence are a part of the job”, while more disagreed (47%) than agreed (38.8%) in the PPS (Table 5). In contrast, more respondents in SS agreed (45.5%) than disagreed (40%) with the above statement. The majority disagreed with the statement “You get use to it” in the eldercare, psychiatry, and the PPS. In the case of SS, 42.9% agreed and 46.1% disagreed. More than half of the respondents in eldercare and in psychiatry disagreed with the statement “You have to accept the risk”, while more agreed than disagreed in the PPS and SS.
Attitudes About Workplace Violence (%).
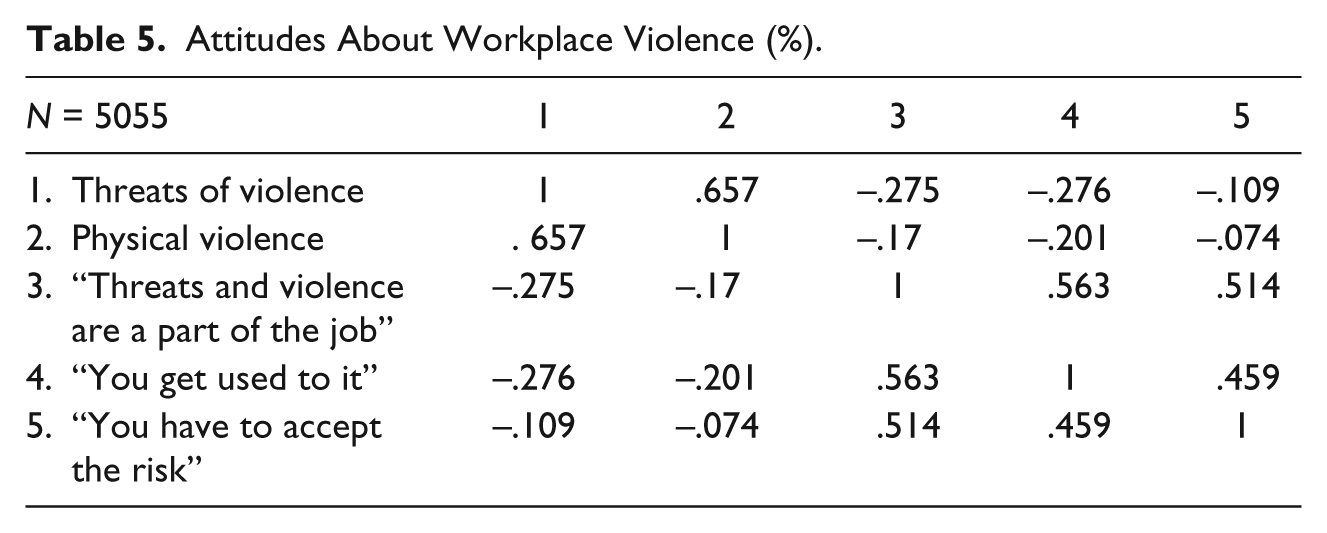
A correlation analysis of the overall association between attitudes and threats and/or violence—using all four areas of work as a combined sample—showed a significant association between the different attitudes and exposure to threats or violence (Table 6). We found exposure to threats to be more strongly associated with these attitudes than exposure to violence. And stronger associations between exposure and “getting used to” and “threats and violence being part of the work” than of “you have to accept the risk”.
Correlation Analysis of Exposure to Threats or Violence and Attitudes Towards Threats or Violence.
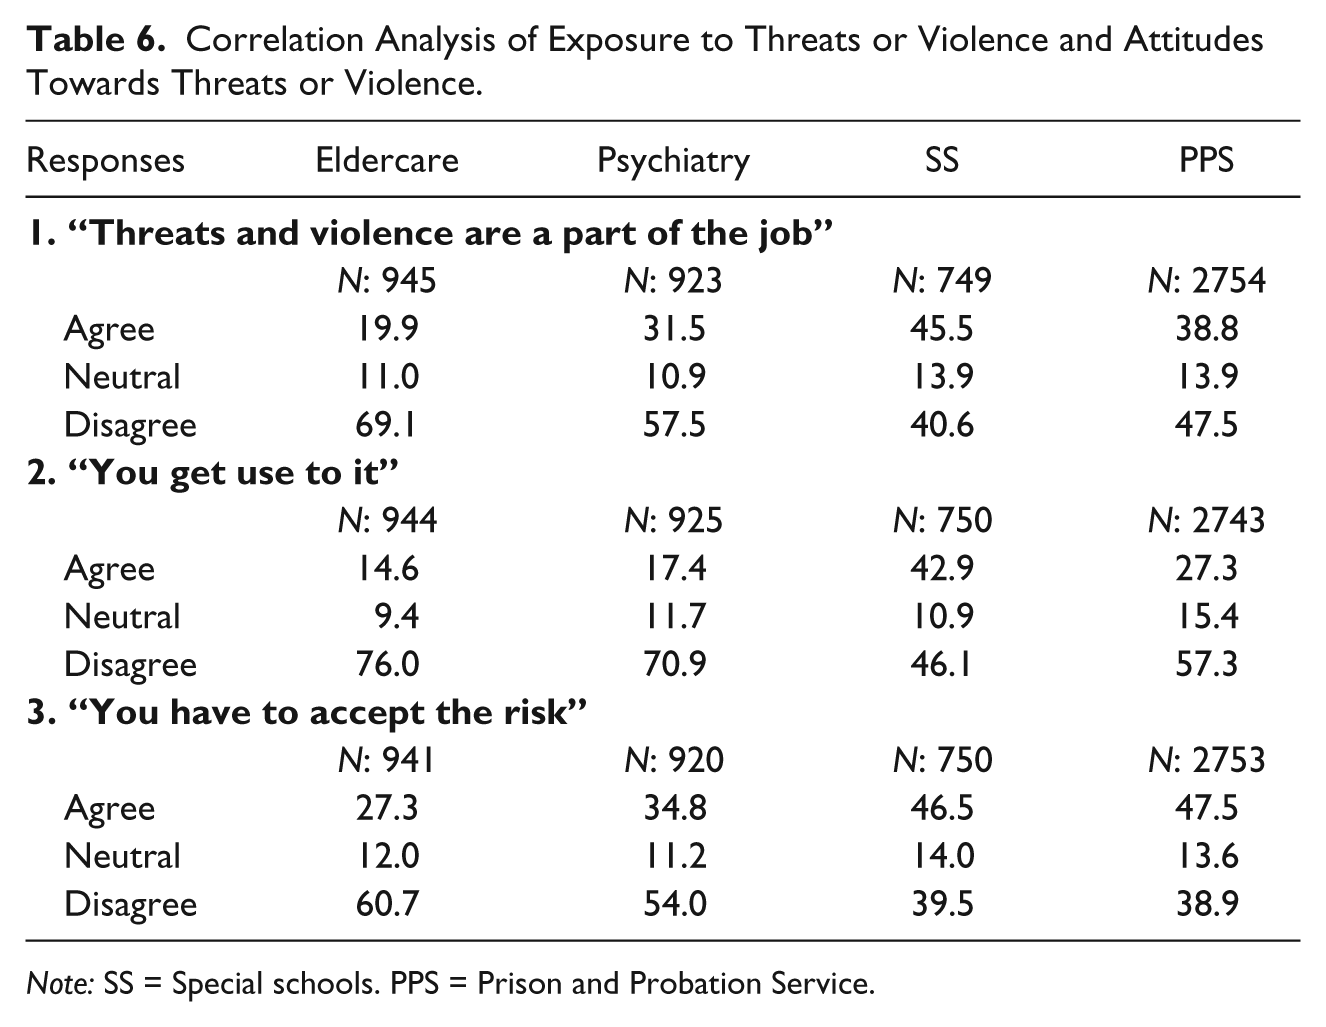
Note: SS = Special schools. PPS = Prison and Probation Service.
Discussion
The results of the present study show that threats and physical violence is prevalent in human service work. Thus, this discussion will focus on whether the frequency of threats and violence, self-rated seriousness, perpetrator and/or attitudes are related to the degree of reporting incidents to the worksite.
Frequency of Threats and/or Physical Violence and Reporting Incidents
Our results showed that frequency is indeed related to reporting, since for example SS had significantly more incidents of both threats and physical violence than other areas of work, while they also reported more incidents. At the opposite end, the eldercare and the PPS had lower frequencies of threats/violence and a higher degree of “no reporting”. This is consistent with findings from Sharipova et al. (2008). An explanation for this general finding could be that more frequent exposure entails an increase of attention and a reduced tolerance toward aggressive incidents.
The present study contributes to the literature by showing that employees in SS are more exposed to threats and physical violence in comparison to other areas of human service work. This finding cannot be readily explained since there are no studies specifically concerned with identifying risk factors and perceptions of threats or physical violence in SS. One possible explanation may be that in comparison to psychiatry, eldercare, and the PPS no campaigns or otherwise focus on work-related threats/violence have been carried out, which implies that prevention has not been prioritized. In addition, it is possible that the relationship with pupils is qualitatively different, because the employees play a part in the child’s upbringing, and as such, may regard themselves as caregivers in a sort of parenting way, and thus the pupil as someone to protect and not to be protected from. In order to improve prevention of threats/violence in SS, further studies are needed to discover the contextual factors related to this work setting.
Furthermore, the result showing that employees in the PPS were the least exposed was somewhat surprising, since criminals are more likely to have a history of violence, which might foster an aggressive environment. One explanation may be that aggressive behavior toward prison staff entails specific sanctions (i.e., prolonged sentence), which may prevent incidents of threats/violence. In addition, most inmates are supposedly of a “sane mind” (in a legal terminology) in comparison with clients in psychiatry, SS, and elderly clients with dementia, who may not be able to understand the consequences of their actions or to resist their impulses. This is also the case when comparing pupils in SS to pupils in other schools.
Self-Rated Seriousness, Reporting, and Perpetrators
In the present study self-rated seriousness was not consistently related to higher reporting of threats or physical violence, which was in contrast to findings by Sharipova et al. (2008). The PPS had a relative high degree of “not reporting”, but they rated the incidents as serious as or more serious than any other area of work. However, in all other areas of work the relationship between reporting and the self-rate of seriousness was consistent with the findings by Sharipova et al. (2008). These results suggest that contextual factors may prevent employees in the PPS from reporting threats and violence despite rating these incidents as relatively serious. An explanation may be found in the concept of safety climate or violence climate, which refers to the employees perceptions of organizational policies, practices, and procedures to prevent aggression in the workplace (Brooks, Staniford, Dollard, & Wiseman, 2010; Kessler, Spector, Chang, & Parr, 2008). Central to this concept is the important role of supervisors, for example by modeling civil behaviors, encouraging employees to report, and taking these reports seriously. Thus, if employees in the PPS regard reporting as futile, because their supervisor does not take the reports seriously, then this could explain why employees do not report even serious incidents. While we need further studies to discover the specific contextual factors for the lack of reporting in the PPS, our results do show that these employees are more exposed to threats and physical violence from superiors suggesting that there is a negative safety or violence climate in the PPS.
Our comparison of self-rated seriousness showed that threats are rated with a similar degree of seriousness as physical violence both within and across areas of work; all incidents fall in between 4 to 6 on the 10-point scale, which could be called the moderate range. This is somewhat surprising since physical violence is often regarded as the more severe trauma, while nonphysical incidents are seen as less likely to be experienced as highly threatening to one’s wellbeing (Snyder et al., 2007). It is possible that respondents view these scales as having qualitatively different endpoints, in which the worst threat does not equal the worst incident with physical violence. Furthermore, contextual factors within each area of work may influence norms and thereby the rating of what is perceived as a more or less serious incident. However, evidence indicates that threats and physical violence are similarly related to long-term sickness absence (Clausen, Hogh, & Borg, 2011), which suggest that threats do indeed entail consequences comparable to physical violence. These results suggest that definitions of workplace violence that require visible bruises are not sufficient to capture the full impact of threats and physical violence in the workplace. Indeed, there is a need for more studies specifically concerned with the impact of threats.
Previous research indicates that reporting is more frequent when the violence is performed by someone other than clients (Sharipova et al., 2008), which our results did not support. The PPS had more incidents with threats and violence performed by someone else than clients, which was not reflected in higher reporting. As mentioned earlier, this may be explained by a negative safety or violence climate in the PPS, where employees may not trust their supervisors to take reports seriously and/or the supervisors themselves are the perpetrators.
Attitudes Toward Threats/Violence and Reporting
The three statements “Threats and violence are a part of the job”, “You get use to it”, and “You have to accept the risk” reflect a form of accept or tolerance of threats/violence, and the results show that employees in the eldercare and in psychiatry expressed similar—relatively low levels of accept, since the majority disagreed with these three statements. Employees in the PPS expressed more accept, while employees in SS were the most tolerant with incidents of threats/violence. This pattern of attitudes does not relate to the frequency of reporting incidents. Interpreting these statements as attitudes of accept or tolerance implies that our results do not confirm Åkerstrøm’s (2002) view that employees in caring occupations downplay or accept patient’s aggressive actions—in contrast to staff in prisons. One possible explanation for these findings is that psychiatry and eldercare have had an increasing focus on violence prevention, which has provided employees with effective tools to reduce incidents of threats/violence, thereby contributing to the belief that incidents need not be accepted since they may be prevented. This has not yet been the case for SS.
The pattern of attitudes did not consistently relate to exposure. For instance SS and PPS expressed similar high accept of workplace threats/violence, although being at opposite ends concerning degree of exposure. Despite these differences between areas of work our correlation analysis showed that the overall tendency is that attitudes and exposure are significantly related. Indeed, threats seem particularly affected by these attitudes in comparison to exposure to violence. Thus, one could hypothesize that a change in attitudes would more strongly influence incidents of threats than of violence. Furthermore, the notion that “you have to accept the risk” seems to be less dependent on exposure, therefore changing this attitude would not affect exposure to the same degree as a change in “threats and violence is part of the job” and “you get used to it”. These hypotheses could be tested in an intervention design, tailored to a specific area of work, which we are in the process of planning.
Strengths and Limitations
A major strength of this study is the presence of four major areas of human service work, where the risk of threats and violence is high. Another strength is the high response rate among employees from especially psychiatry, eldercare, and SS. However, the study also has limitations. One was the relatively lower (but still acceptable) response rate in the PPS, which may be partly due to the use of a web-based questionnaire (van Gelder, Bretveld, & Roeleveld, 2010). Another limitation is the use of questionnaires, where data are dependent upon participant’s subjective self-reporting, which were not confirmed by other measurements, such as interviews. However, we are in the process of conducting interviews, and these results will be published later.
A further limitation is that the total sample is not representative; therefore, it is not possible to generalize findings. Indeed, the PPS was the only area of work where we included all the staff, making this sample more valid in comparison to other areas, where each worksite chose to participate. This variety in the sampling procedure may explain some of the differences found in frequencies, since we do not know if worksites chose to participate, because they were more exposed (wish to raise awareness) or perhaps less exposed (wish to strengthen focus on existing programs). According to (Nielsen & Einarsen, 2008) this type of convenience sampling is valid when the objective is to investigate tendencies and not to generalize to the general public. Therefore, we feel the current study still contributes to our understanding of patterns related to threats and physical violence in human service work. Lastly, the four occupational arenas differ in several ways (staff education, type of client, organizational culture, etc.), so further studies should also focus on specific contextual factors.
Conclusions
This comparative study reveals that there are significant differences in the frequency of workplace violence among different areas of human service work, namely psychiatry, eldercare, SS, and the PPS. In particular, employees in SS were frequently exposed. Areas of work with more exposure also had a higher degree of reporting. However, all areas of work had a significant underreporting of both threats and physical violence, which was not consistently related to self-rated seriousness. Both threats and physical violence were rated within a moderate range of seriousness in all these areas of work. Staffs in SS and in the PPS expressed more accept of workplace threats/violence; when comparing areas of work there were no consistent relationships between attitudes and neither exposure, self-rated seriousness, nor reporting of workplace violence. However, attitudes and exposure were significantly related when analyzing all areas of work as a combined sample. More knowledge is needed to understand the relationship between exposure, work environment, and attitudes about workplace threats and violence.
Workplace threats and violence toward staff in human service work is a widespread phenomenon that requires continued research and strategies aimed at decreasing its scope and consequences. Further studies should focus on the impact of threats, and also more research is needed on threats and violence in SS. Furthermore, studies exploring risk factors in a prospective design are needed in order to improve the prevention of threats and physical violence in the workplace.
Footnotes
Acknowledgements
The authors would like to thank Dorte Raaby Andersen for her help in administrating the survey. We would also like to thank the participating worksites for their involvement in the study.
Declaration of Conflicting Interests
The author(s) declared no potential conflicts of interest with respect to the research, authorship, and/or publication of this article.
Funding
The author(s) disclosed receipt of the following financial support for the research, authorship, and/or publication of this article: This study was funded by The Danish Working Environment Research Fund.