
Abstract
This study quantifies the spatiotemporal risk of child abuse and neglect in Los Angeles at the census tract level over a recent 4-year period, identifies areas of increased risk, and evaluates the role of structural disadvantage in substantiated child maltreatment referrals. Child maltreatment data on 83,379 child maltreatment cases in 1,678 census tracts spanning 2006-2009 were obtained from the Los Angeles County Department of Children and Family Services. Substantiated referral counts were analyzed across census tracts with Bayesian hierarchical spatial models using integrated nested Laplace approximations. Results showed that the unadjusted yearly rate of child abuse and neglect held fairly steady over the study period decreasing by only 2.57%. However, the temporal term in the spatiotemporal model reflected a downward trend beginning in 2007. High rates of abuse and neglect were predicted by several neighborhood-level measures of structural burden. Every 1-unit decrease in the social vulnerability index reduced the risk of child abuse and neglect by 98.3% (95% CrI = 1.869-2.1042) while every 1-unit increase in the Black–White dissimilarity index decreased child abuse and neglect risk by 70.6%. The interaction of these variables demonstrated the protective effect of racial heterogeneity in socially vulnerable neighborhoods. No such effect was found in neighborhoods characterized by low levels of vulnerability. Population-based child abuse and neglect prevention and intervention efforts should be aided by the characteristics of neighborhoods that demonstrate strong spatial patterns even after accounting for the role of race and place.
Keywords
Introduction
In 2012, a nationally estimated 3.2 million youngsters, or 42.7 per 1,000, received a response from a child protective service agency for suspected child abuse and neglect, up 3.5% from 2008. According to official records, approximately one in four maltreatment allegations are substantiated; therefore, an estimated 9.2 children per 1,000 are substantiated for child abuse or neglect nationally (U.S. Department of Health and Human Services, Administration for Children and Families, Administration on Children, Youth, & Families, Children’s Bureau, 2015). However, these figures may be biased for several reasons including some cases of maltreatment go unsubstantiated, some cases are substantiated even in the absence of abuse or neglect and some victims never enter the system at all.
In 2013, there were 482,265 allegations of child abuse and neglect in California alone. Of those cases, 81,381, or 17%, were substantiated by the state welfare system. The majority of all verified maltreatment cases (65%) were due to general neglect, defined as the failure of a parent or guardian to provide adequate food, shelter, medical care, or supervision for the child in the absence of physical injury. These statistics underscore the pervasiveness and complexity of child maltreatment, a public health problem that affects millions of children and costs billions of dollars annually (Courtney, 1998; U.S. Department of Health and Human Services, Administration for Children and Families, Administration on Children, Youth, & Families, Children’s Bureau, 2015).
The ability of communities to properly identify and effectively respond to abuse and neglect depends on a proper assessment of risk factors at multiple levels of child development—individual, family, and community. In recent years, California lawmakers have attempted to better identify child abuse and neglect through legislative reform. The 1974 Child Abuse and Neglect Reporting Act, or “CANRA,” represented an attempt by the California legislature to identify children who are at risk or continuing risk of being deliberately or recklessly injured by a parent or legal guardian. In 2004, reporting practices and procedures were modified through reforms by addressing errors of due process, the nature of investigations, and operational definitions in which determinations of abuse or neglect are made. These included heightening the standard of proof in child maltreatment cases from “some credible evidence” to a “preponderance of the evidence,” as well as modifying existing definitions of “sexual assault,” “abuse or neglect,” “mental suffering,” and “serious emotional damage.” Since 2003, the rate of child maltreatment substantiations in California decreased by 24% from 11.7 to 8.9 per 1,000 children in 2014. Nevertheless, rates continued to vary considerably by county illustrating the importance of both time and space. The rate of child abuse and neglect substantiations in Trinity County, California, for example, ranked in the top 2 in both 2003 and 2013 despite a 25% reduction throughout the decade (California Department of Social Services & University of California at Berkeley, Child Welfare Dynamic Report System, 2014). In contrast, San Mateo County ranked among the lowest for child abuse maltreatment during this period but nevertheless saw a 52% reduction during this decade from 5.4 per 1,000 in 2003 to 2.6 per 1,000 in 2013 (California Department of Social Services & University of California at Berkeley, Child Welfare Dynamic Report System, 2014).
Child abuse and neglect in California and elsewhere are non-random; rather, it evidences a spatially clustered pattern across space and changes throughout time conditional on local context (Klein & Merritt, 2014). It has been shown to be a particularly pernicious problem in densely populated areas characterized by consistently high levels of social fragmentation (Korbin, Coulton, Chard, Platt-Houston, & Su, 1998; Sampson & Wilson, 1995). Based on the influential work of Shaw and McKay (1942, 1969) and Sampson and Groves (1989), a fairly substantial body of research shows that neighborhood structural factors such as low socioeconomic status and racial heterogeneity account for variations in child abuse and neglect allegations and substantiation rates. This literature typically invokes social disorganization theory as the causal mechanism to explain why neighborhoods characterized by concentrated poverty, unemployment, residential mobility, and mostly non-white populations have high rates of allegations and substantiations (Coulton, Korbin, & Su, 1999; Coulton, Korbin, Su, & Chow, 1995; Freisthler, 2004; Kingston, Huizinga, & Elliott, 2009; Klein & Merritt, 2014; Schuck & Widom, 2005). All studies using the lens of social disorganization emphasize the role of neighborhood economic and social conditions as key explanatory variables, which act to disrupt community social organization and undermine collective efficacy. Although these hypothesized links between community structure and childhood victimization oftentimes cannot be tested empirically, ecological studies inspired by the tradition of social disorganization theory have demonstrated robust associations between rates of childhood victimization and a variety of neighborhood structural characteristics (Coulton, Crampton, Irwin, Spilsbury, & Korbin, 2007) including neighborhood poverty (Garbarino, 1997), concentrated affluence (Fromm, 2004), unemployment (Freisthler, Midanik, & Gruenewald, 2004), percentage of female-headed households (Freisthler, 2004), family and community violence (Gelles, 1993; Maguire-Jack & Font, 2014; Martin & Walters, 1982), urbanicity/rurality, residential turnover (Coulton et al., 1995), vacant housing (Deccio, Horner, & Wilson, 1994), immigrant concentration (Freisthler, 2004), spatial relation to other communities, child care burden (Coulton et al., 1999), accessibility of formal child care and early education services (Klein, 2011), racial diversity (Ards, Myers, Malkis Erin, & Zhou, 2003; Bartholet, 2009; Klein & Merritt, 2014), and the presence of local alcohol outlets (Freisthler, 2004; Freisthler, Gruenewald, Remer, Lery, & Needell, 2007; Freisthler, Needell, & Gruenewald, 2005).
Of particular interest is evidence of racial disproportionality in child protection and child welfare both in California and across the nation. Area-based studies have shown that Black children are between 2 and 5 times more likely than White children to receive an investigation for maltreatment (Bowman, Hofer, O’Rourke, & Read, 2009; Crampton & Coulton, 2008; Drake, Lee, & Jonson-Reid, 2009; Rolock & Testa, 2005). Several studies have confirmed that the magnitude of this disparity is unique to the geographic area under consideration (Nilsen, 2007). Sometimes overlooked is that White children are underrepresented in the child welfare system. Several studies explain these racial differences in allegations, substantiations, and foster care placements using neighborhood-level characteristics (Coulton et al., 2007). In their examination of 940 census tracts in California, Freisthler and colleagues (2007) found that with respect to African American children, higher rates of poverty and higher densities of alcohol outlets were linked to higher maltreatment rates, but increases in population, higher percentages of residents who had moved, and a higher concentration of African American residents were linked to lower rates. Drake and Pandey (1996) found that White children living in poor communities are more likely to be reported to Child Protective Services (“CPS”) than Black children living in poor communities, but White children living in non-poor communities are less likely to be reported to CPS than Black children living in non-poor communities (Drake & Pandey, 1996). In a descriptive study examining neighborhood effects on maltreatment rates in Missouri, Drake and colleagues (2009) found that reporting rates were higher for White children living in predominantly Black areas and for Black children living in wealthier predominantly White areas. Examining neighborhood effects on racial differences in foster care populations, Wulczyn and Lery (2007) found that disparity was lower in counties with higher poverty rates. In addition, Wulczyn, Gibbons, Snowden, and Lery (2013) found that racial disproportionality in foster care placement rates narrowed substantially when analyses were restricted to counties with high rates of White poverty, but this was not true for counties with high rates of Black poverty (Wulczyn et al., 2013)
Despite these well-established findings, few socio-ecological studies have considered aspects of neighborhood differentiation other than concentrated disadvantage including ethnic heterogeneity (Sampson, Morenoff, & Gannon-Rowley, 2002). One exception, however, is Klein and Merritt (2014) who used a theoretically grounded measure of racial-ethnic heterogeneity based on Blau’s Diversity Index to associate racial diversity with child abuse allegation rates in Los Angeles County. They found that reports of child maltreatment are higher for all children under the age of 18 living in racially heterogeneous neighborhoods, that is, increasing levels of racial diversity predicted child maltreatment allegations. They further found evidence for a “differential sensitivity” effect whereby maltreatment referral rates were higher for Hispanic and White children living in impoverished areas but not Black children. They concluded that residence in a poor neighborhood matters differently for children of different races/ethnicities. The present study extends their findings in two ways, first, by addressing the effect of neighborhood social vulnerability and racial heterogeneity in child maltreatment substantiations, second, by explicitly testing the moderating effect of neighborhood racial homogeneity across levels of social vulnerability: that is, exploring the protective role that racial heterogeneity has on child maltreatment rates conditioned by neighborhood vulnerability.
Taken together, previous research has begun to unravel the complicated picture of racial bias found in the child welfare system by suggesting that the higher maltreatment and placement rates found among African American children and families may be attributable to their unique residential context. African American families are more likely to live in racially and socioeconomically segregated neighborhoods and/or in neighborhoods where the degree of childhood poverty is high (Drake & Rank, 2009). According to social disorganization theory, however, neighborhood racial and ethnic homogeneity are associated with higher levels of community cohesion due to the presence of shared cultural norms that are (theoretically) undivided by race, racial discrimination, and/or racism. Consequently, racially homogeneous neighborhoods should be better able to enforce community values, including values around appropriate parenting and child safety. Therefore, although the economic characteristics (e.g., income levels, unemployment rates) of neighborhoods are related to child maltreatment rates, social connections between and among people might explain some of the unexplained variance. A recent study of child maltreatment in Hanoi (Emery, Trung, & Wu, 2015) suggests that a causal mechanism undergirding the relationship between racial homogeneity and child maltreatment pertains to different types of collective efficacy that define whether and how individuals intervene. Emery and his colleagues (2015) used a collective efficacy measure (which includes informal social control) that distinguishes between a softer, more protective approach (protective informal social control) and a harder, more punitive approach. In this conceptualization, protective informal social control emphasizes protecting children whereas punitive informal social control emphasizes punishing parents. They found that protective informal social control of child maltreatment was linked to less physical abuse and associated externalizing problems. A possible explanation provided by the authors is that as parents’ estimates of the likelihood of direct intervention by neighbors increase, reports of child abuse and neglect decrease. However, no effect between punitive informal social control and child maltreatment was noted.
The Present Study
The main purpose of this study is to quantify the spatiotemporal risk associated with structural heterogeneity, that is, place, neighborhood-level social vulnerability, and racial heterogeneity in Los Angeles County in the post-legislative reform period of CANRA when reporting practices and procedures were modified. Secondary goals were to identify areas that could benefit from an increased allocation of funds and modifications to the distribution of caseworkers or caseloads; identify characteristics of communities where substantiated cases of child abuse and neglect are significantly disproportionate to what would be expected by random generating processes; and specify aspects of the social environment that both facilitate and prevent the proper surveillance of child abuse across both space and time. More specifically, the following research questions are addressed:
Method
Data
Data for this study were compiled from a variety of sources. The dependent variable consisted of 83,379 child maltreatment cases across 1,678 census tracts spanning 2006-2009 that were obtained from the Advancement Project’s Healthy City website (http://www.healthycity.org). The data were obtained from the Los Angeles County Department of Children and Family Services (DCFS) and made available to the general public. The Los Angeles County DCFS geocodes all child maltreatment substantiations using the Environmental Systems Research Institute’s ArcGIS 9.2 program and the Thomas Brothers Transportation Street Network Line database and then associates the address coordinates with Census tracts in Los Angeles County to calculate the total number of child maltreatment reports within each tract (Klein & Merritt, 2014).
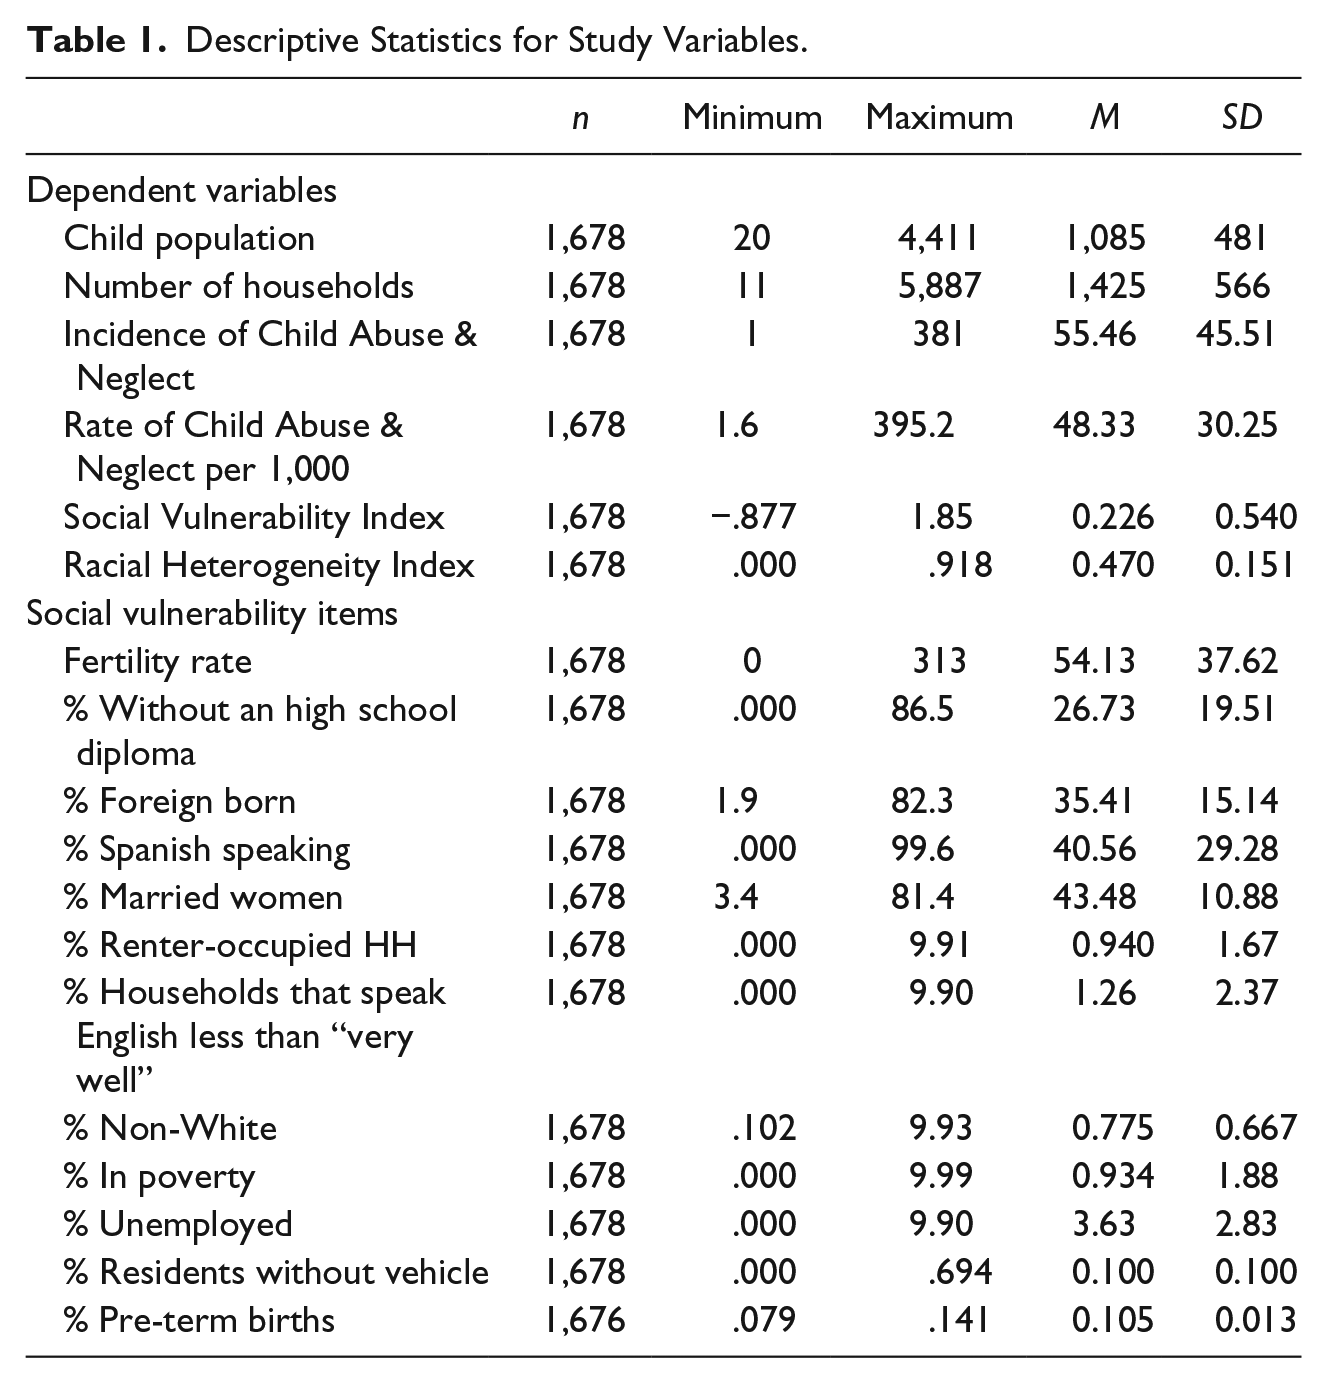
Indicators of social vulnerability for Los Angeles County were downloaded from the Pacific Research Institute (http://www.pacinst.org). The index combines neighborhood vulnerability from a number of different sources into a single, composite indicator based on multiple vulnerability factors identified by previous research (Cutter et al., 2003; see Table 1 for descriptive statistics). Each variable was standardized and then averaged to create a social vulnerability score for each census tract. When necessary, the variables were reverse-coded so that in all cases higher values correspond to greater vulnerability. A categorical variable was created to represent percentiles corresponding to high (i.e., top third), medium, and low (i.e., bottom third) vulnerability tracts.
Descriptive Statistics for Study Variables.
An evenness measure of segregation was used to compare the spatial distribution of Black and White residents in Los Angeles County census tracts. The Black–White (B-W) interaction index is the probability that a minority person shares a unit area with a majority person (Iceland & Weinberg, 2015). It measures the level of exposure between minority group members to majority group members as a minority-weighted average of the majority proportion of the population in each area. As measure of dissimilarity, it quantifies the percentage of a group’s population that would have to change residence for each neighborhood to have the same percentage of that group as the county overall. In this formulation, segregation is smallest when Blacks and Whites are evenly distributed. The index of dissimilarity was calculated at the census tract level for the county using the 2010 Summary File 1 from the U.S. Census using the following formula:

where n = the total number of census tracts, i = 1, . . ., 1,678; ti is the total population of census tract i, pi is the proportion of Black in each census block, P is the proportion of the population that is Black in each census tract, and T is the total population. To perform these calculations, data were aggregated up from the census block level to the census tract using the R statistical package. The index ranges from 0 (complete integration) to 1 (complete segregation).
Population counts (total population, population by race) were downloaded from the American Community Survey website. A census tract map file for Los Angeles County was obtained from the U.S. census and was matched to the yearly census tract counts of child abuse and neglect substantiations. The census tract-level indices along with the social vulnerability and substantiation data were then merged to a Los Angeles county shape file contained in the U.S. census 2010 package available in the R statistical environment. All data were then prepared for the geospatial analysis.
Los Angeles County is comprised of 2054 census tracts; however, the two tracts that make up Catalina Island were omitted because of their spatial discontinuity with “mainland” Los Angeles (Klein & Merritt, 2014). Missing data and outliers (cases where a census tract had a greater than 100% raw child abuse and neglect rate) were removed. After cleaning and matching all the data, there were 1,678 census tracts remaining for the analysis. Standardized incidence ratios were calculated for each census tract. Spatial random effects smooth estimates across neighboring areas using a conditionally autoregressive (CAR) model. Use of these spatial random effects assumes that adjacent areas share similar characteristics (Cliff & Ord, 1973, 1981). A contiguous neighbor-adjacency matrix graph was created for use with the conditional autoregression term in the model using the poly2nb function in the spdep package (Bivand et al., 2005) in R (the R code used in the analysis is available by request). The spatiotemporal design required the data to be in long format such that there was a separate case for each year. This resulted in 6,712 total cases (1,678 × 4).
Statistical Analyses
Initially, Moran’s I was used to test for spatial autocorrelation in child abuse and neglect substantiations, which is a measure used to determine the presence of clustering across census tracts. Moran’s I indicated the presence of residual spatial correlation. On this basis, a more sophisticated model was used to account for the spatial structure of the data. Counts of child abuse and neglect allegations in Los Angeles County census tracts were spatially modeled according to Besag-York-Mollie (BYM) as described by Lawson and Clark (2002) and DiMaggio (2015). The usual model assumes that the census tract counts of child abuse and neglect substantiations are independent, Poisson distributed random variables with parameter

For mapping purposes, smoothed area relative risks (RRs) were calculated using the conditional autoregressive BYM model proposed by (Besag, York, & Mollié, 1991). The BYM model contains observed cases as the dependent variable, an offset variable, and two types of random effect terms: (a) a spatial term and (b) a term capturing unstructured heterogeneity. This spatial term is also called a CAR prior. The log of the yearly census tract child population average was included as an offset variable to adjust for the population of youth at risk. The smoothed RRs for each census tract compared with all of Los Angeles County were calculated as

The model was fit according to the Knorr-Held (1999) criteria (Blangiardo, Cameletti, Baio, & Rue, 2013) and corresponds to a Type 1 interaction. The spatially structured conditional autoregression term accounts for local geographic influence. The space–time interaction is a random effect term added to the linear model and is interpreted as the residual effect after the unstructured, spatially structured and time effects are modeled. The prior distribution,
The modeling strategy proceeded as follows. First, as a baseline measure, a simple random effects (spatially unstructured heterogeneity) model was fit to the data. A convolution model added a spatially structured conditional autoregression term to the spatially unstructured heterogeneity random effect. The convolution model was then extended (a) to include indices for social vulnerability, racial heterogeneity, and an interaction term then (b) to model the space–time interaction. Five different space–time models were assessed, a convolution plus: (a) uncorrelated time, (b) a first-order random walk-correlated time, (c) a first-order random walk-correlated time plus uncorrelated time, (d) a first-order random walk-correlated time plus a space–time interaction, and (e) a first-order random walk-correlated time plus uncorrelated time plus a space–time interaction. The final linear model consisted of an intercept, a vector of social vulnerability, racial heterogeneity and an interaction term as covariates, a spatially unstructured random effect term, a spatially structured CAR term, a first-order random walk-correlated time variable, and an interaction term for time and place. Model selection was based on lowest values of the models’ deviance information criteria (DIC) and number of effective parameters. Poisson, negative binomial and zero-inflated models were all considered, but the Poisson model was retained due to an insignificant improvement in fit.
Integrated nested Laplace approximations (INLA) were used as a tool for Bayesian inference. The INLA package (DiMaggio, 2015; Rue, Martino, & Chopin, 2009; Ruiz-Cárdenas, Krainski, & Rue, 2012) is available in the R statistical environment (R Development Core Team, 2005). INLA’s default specifications were used as the defaults for the model’s hyper-parameters.
Results
Table 1 shows the means, standard deviation, and range for all study variables. Each census tract contained an average of 1,085 children (SD = 481) in 1,425 households. The average number of child abuse substantiations in each tract was 55.46 (SD = 45.5) or 48.3 per 1,000 (SD = 30.3). The average social vulnerability and racial heterogeneity indices were .226 (SD = .540) and .470 (SD = .151), respectively. Table 1 also shows the descriptive statistics for each variable in the social vulnerability index.
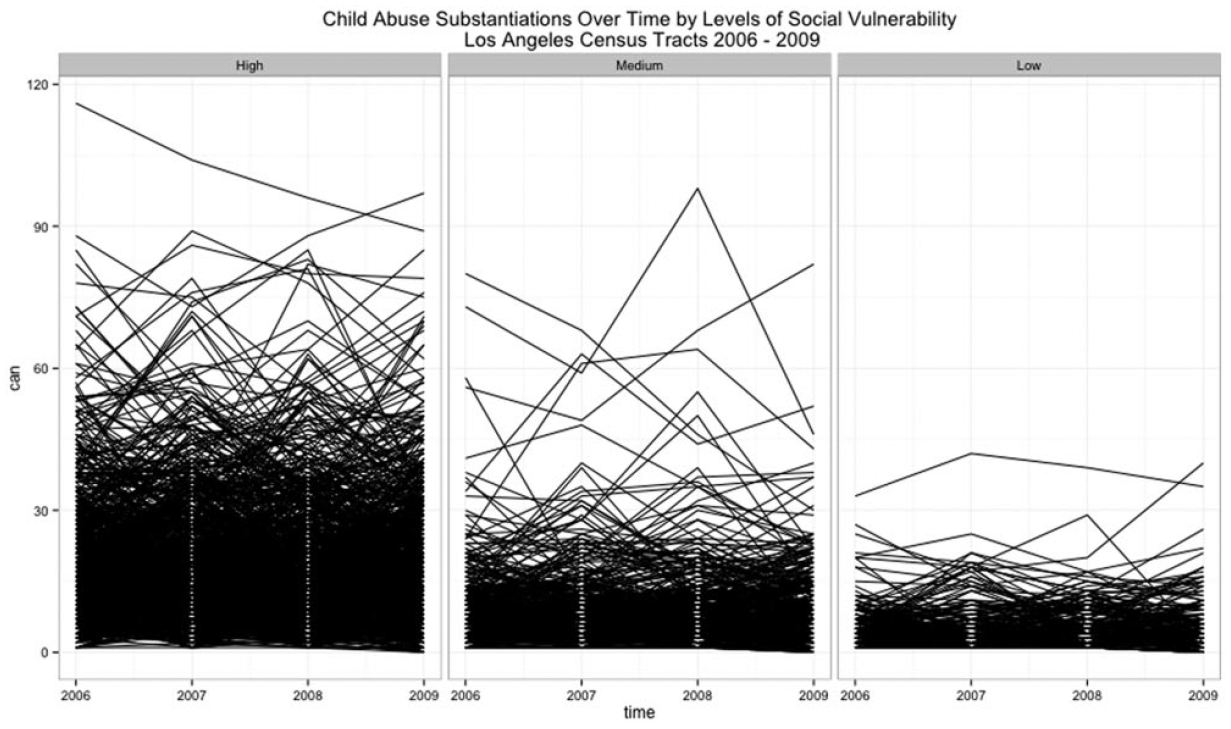
A total of 83,379 substantiated referrals for child abuse and neglect occurred across the 1,678 Los Angeles county census tracts between 2006 and 2009. The population-based rate of substantiations held fairly constant over the 4-year period, decreasing by only 2.2% from 11.31 to 11.06 per 1,000 children. The relationship between child maltreatment and census tract vulnerability is shown in Figures 1 to 4. Figure 1 shows the variability of child abuse and neglect within and across years by level of neighborhood vulnerability. Figure 4 plots a random sample of n = 30 census tracts ordered by rate of substantiations and level of vulnerability. The average rate of substantiations is lower in low-vulnerability tracts, and the variance of the rate increases as vulnerability increases. Census tracts with the lowest level of social vulnerability had a yearly average of 4.3 abuse and neglect substantiations during 2006-2009 as against 10.56 expected on the basis of countywide rates, a standardized incidence ratio (SIR) of .407. The average social vulnerability score in low-vulnerability tracts was −.4635 and the average racial heterogeneity score was .4460. In contrast, census tracts with the highest level of social vulnerability had a yearly average of 19.07 abuse and neglect substantiations during 2006-2009 as against 14.74 expected on the basis of countywide rates, an SIR of 1.29. The average social vulnerability score in low-vulnerability tracts was .6779, and the average racial heterogeneity score was .405.
Child maltreatment substantiation rate across levels of social vulnerability, Los Angeles County, 2006-2009.
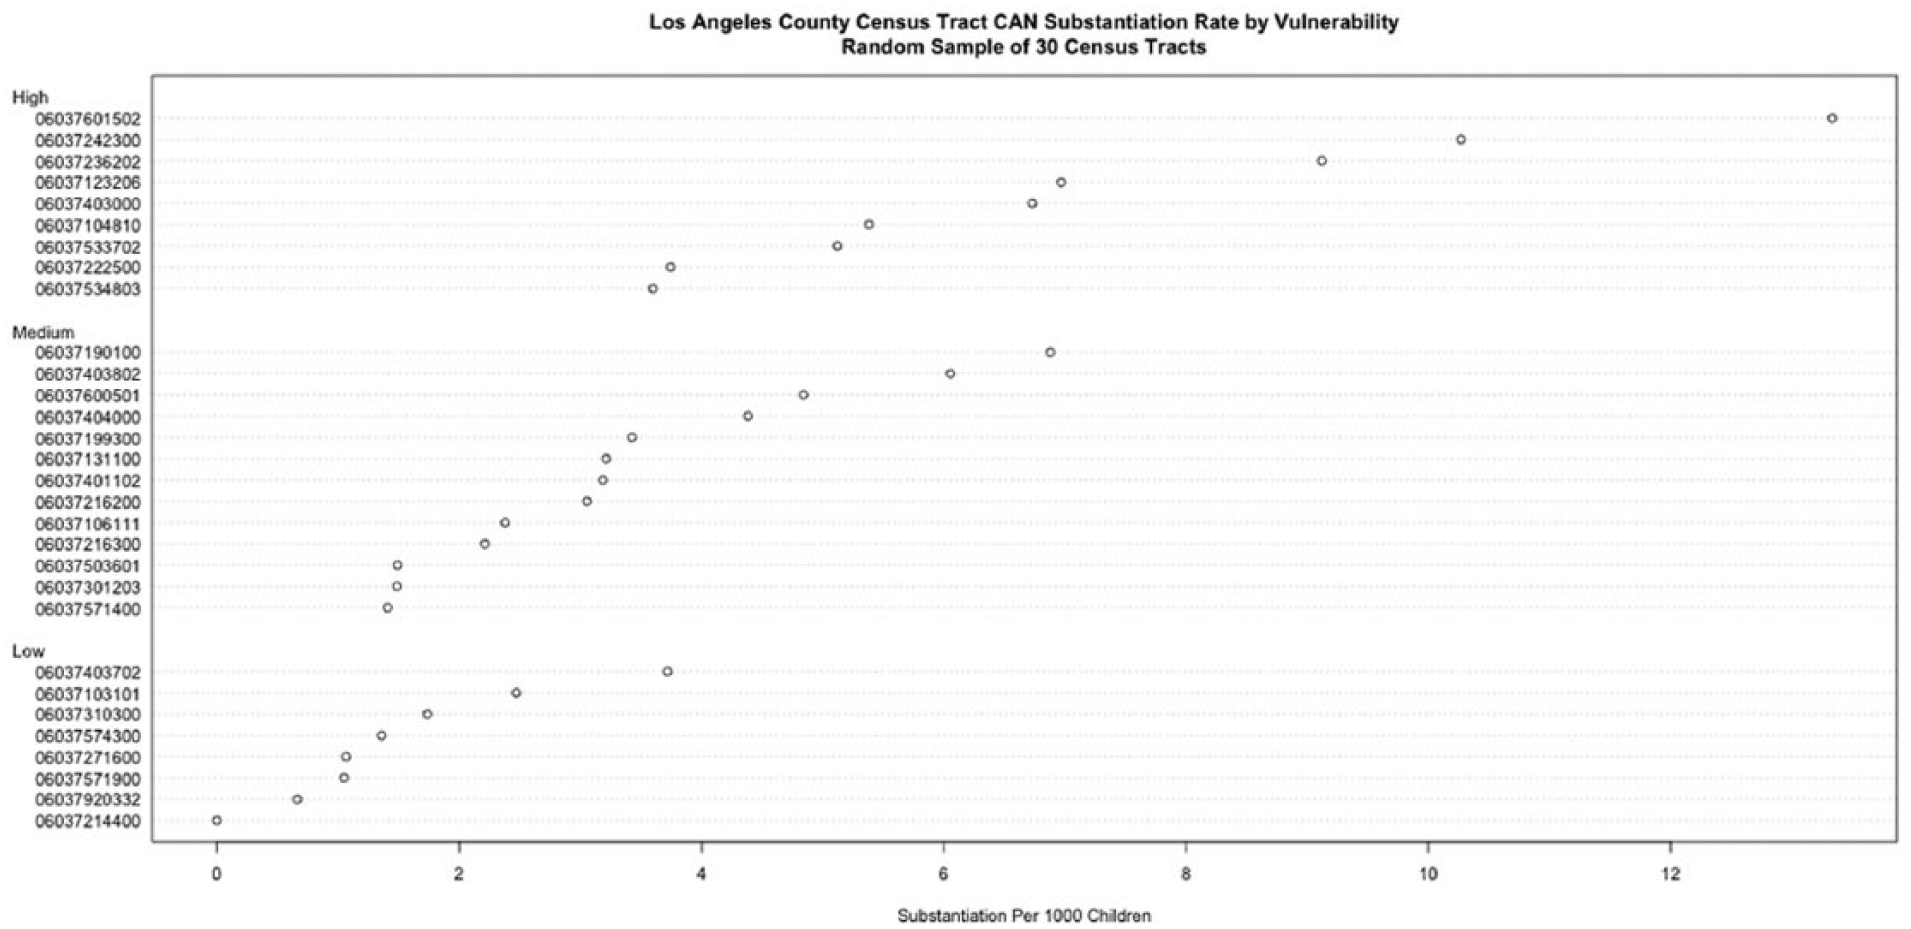
Random sample of n = 30 census tracts and associated level of child maltreatment substantiations. CAN = Child Abuse & Neglect.
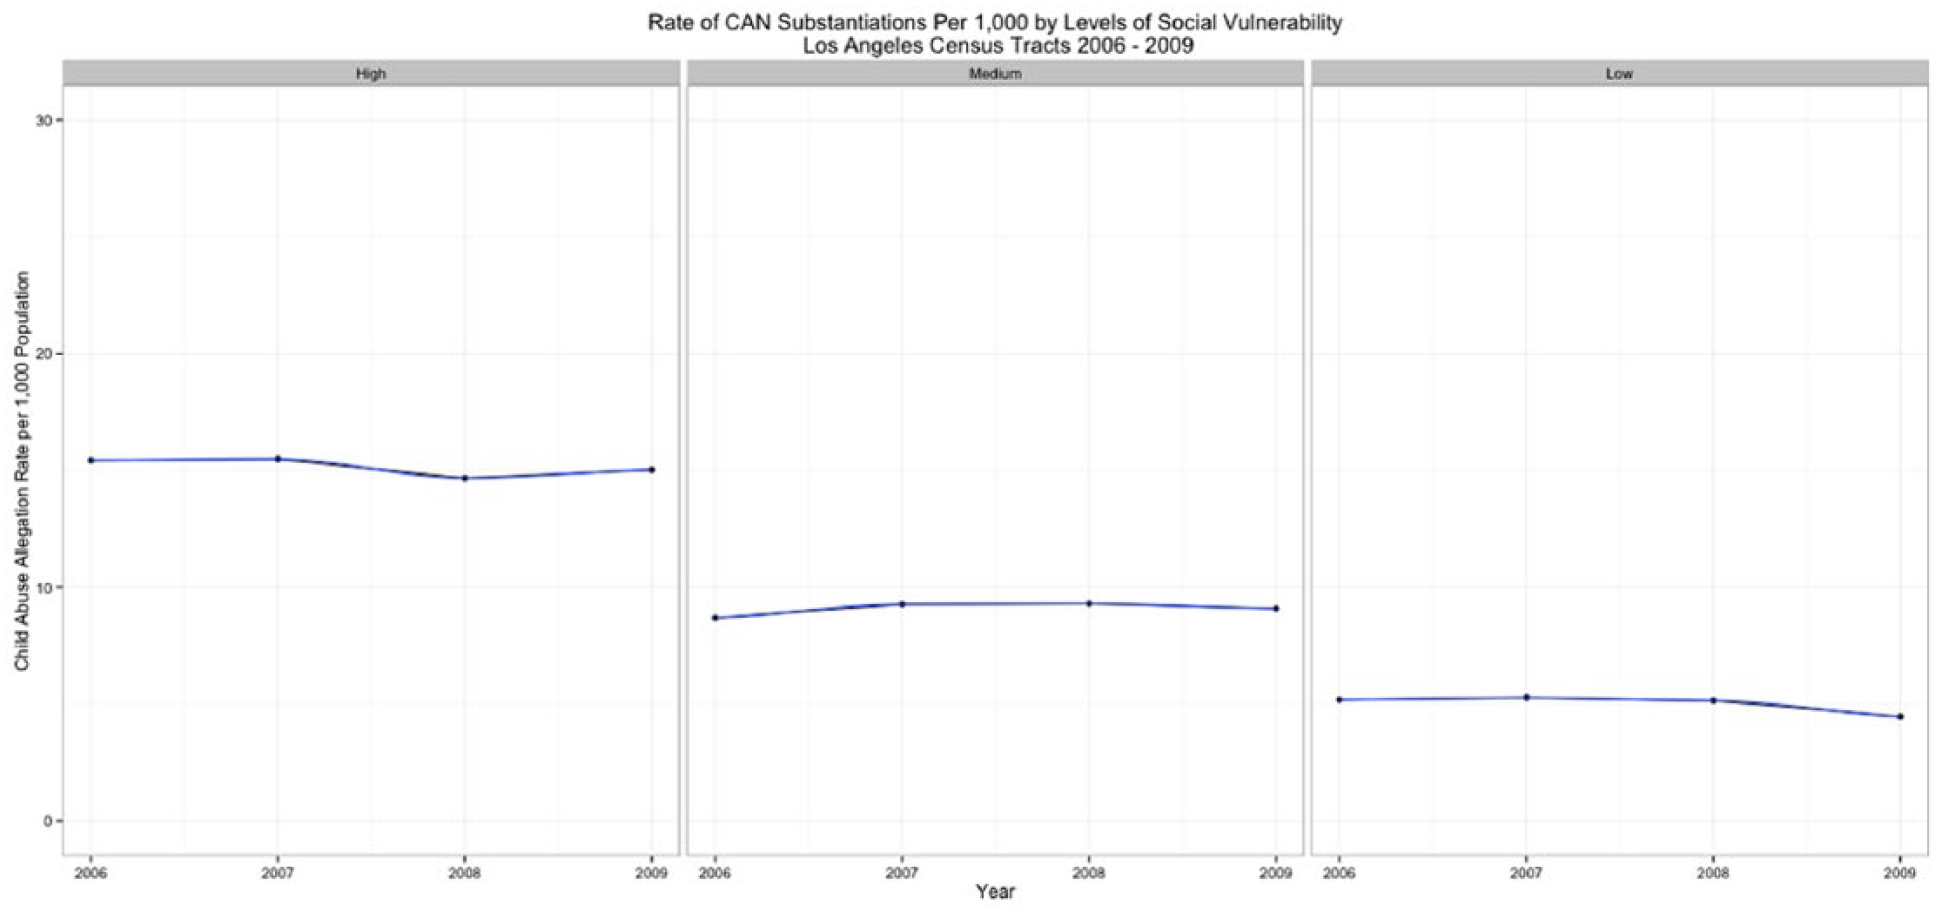
Child abuse and neglect substantiation rate across levels of social vulnerability, Los Angeles County, 2006-2009. CAN = Child Abuse & Neglect.

Standardized incidence ratios and levels of social vulnerability.
Within levels of vulnerability, rates remain fairly constant (Figure 3). However, there is a statistically significant difference across levels with medium- and low-vulnerability tracts having a maltreatment rate that is about 10 (b = −10.18, p < .000) and 6 (b = −6.06, p < .000) children per 1,000 less than high-vulnerability tracts, on average. A box plot of standardized incidence ratios and social vulnerability shows the median standardized incidence ratio is greater than one in highly vulnerable neighborhoods but less than one in neighborhoods characterized by medium and low levels of vulnerability (Figure 4). The box plot also shows a significant amount of variability in substantiations across all levels of vulnerability. All graphs illustrate the positive and statistically significant relationship between rates of child abuse allegations and social vulnerability across neighborhoods at the bivariate level.
Frailty Model (Unstructured Heterogeneity)
The model selection criteria and random effects from the cross-sectional and spatiotemporal models are presented in Tables 2 and 3, respectively. As a baseline against which to measure more informative models, a simple random effects (spatially unstructured heterogeneity model) model was estimated. The DIC for the baseline model is 12,342.27 with 1,552.17 effective parameters (Table 2). The fixed effect for this model consists of only the intercept, which has an associated parameter estimate of −3.353 with a standard deviation of .0183 (95% confidence interval [CI] = [−3.389, −3.317; Table 3).
Model Selection Criteria for Cross-Sectional and Space–Time Models.
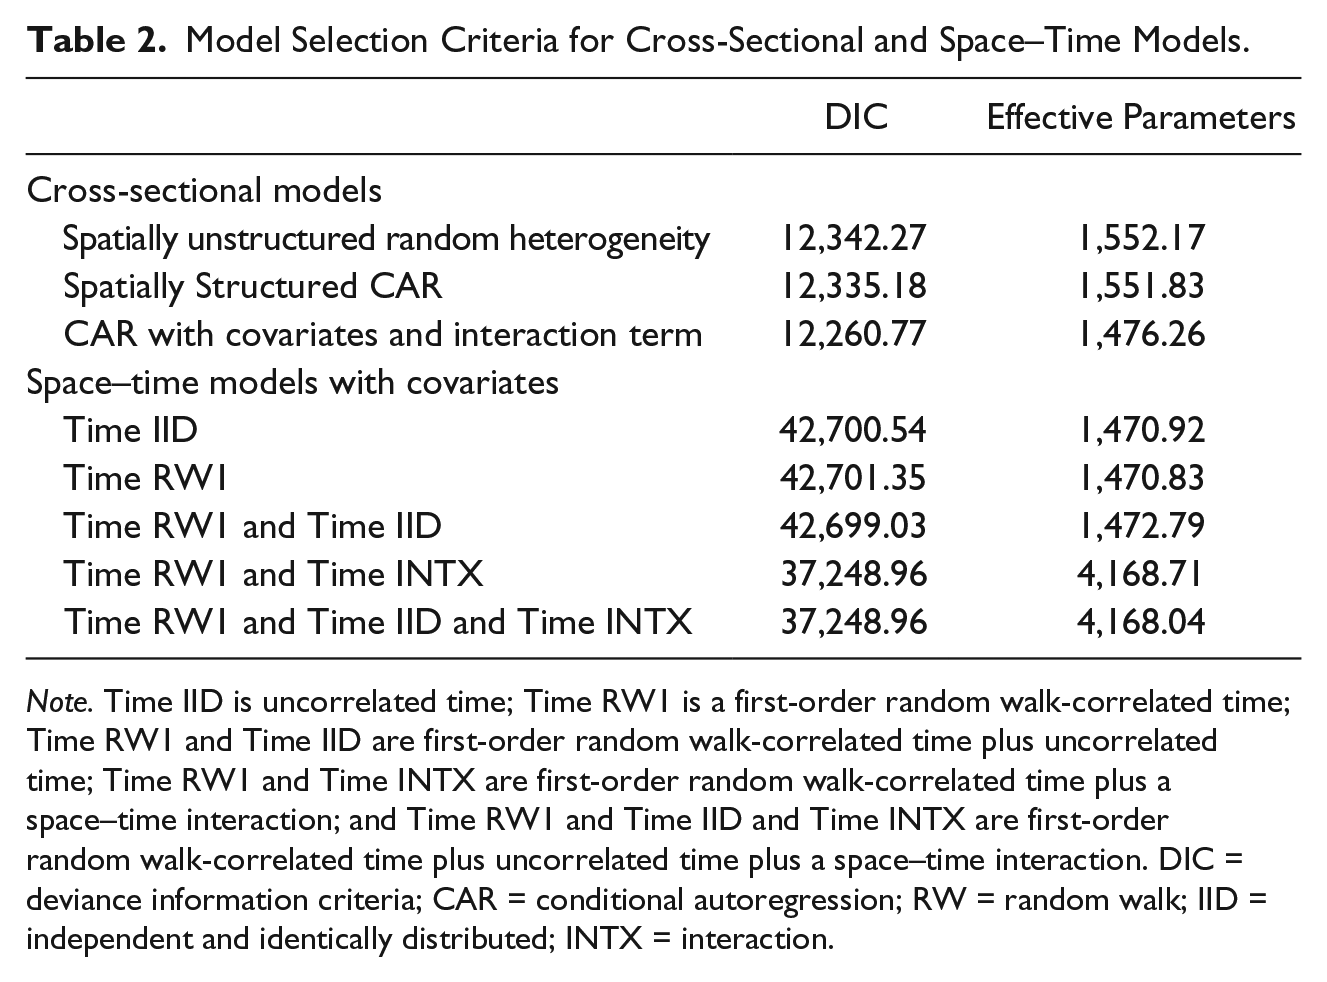
Note. Time IID is uncorrelated time; Time RW1 is a first-order random walk-correlated time; Time RW1 and Time IID are first-order random walk-correlated time plus uncorrelated time; Time RW1 and Time INTX are first-order random walk-correlated time plus a space–time interaction; and Time RW1 and Time IID and Time INTX are first-order random walk-correlated time plus uncorrelated time plus a space–time interaction. DIC = deviance information criteria; CAR = conditional autoregression; RW = random walk; IID = independent and identically distributed; INTX = interaction.
Results of Spatiotemporal Model of Child Abuse Substantiation Risk, Los Angeles County, 2006-2009.
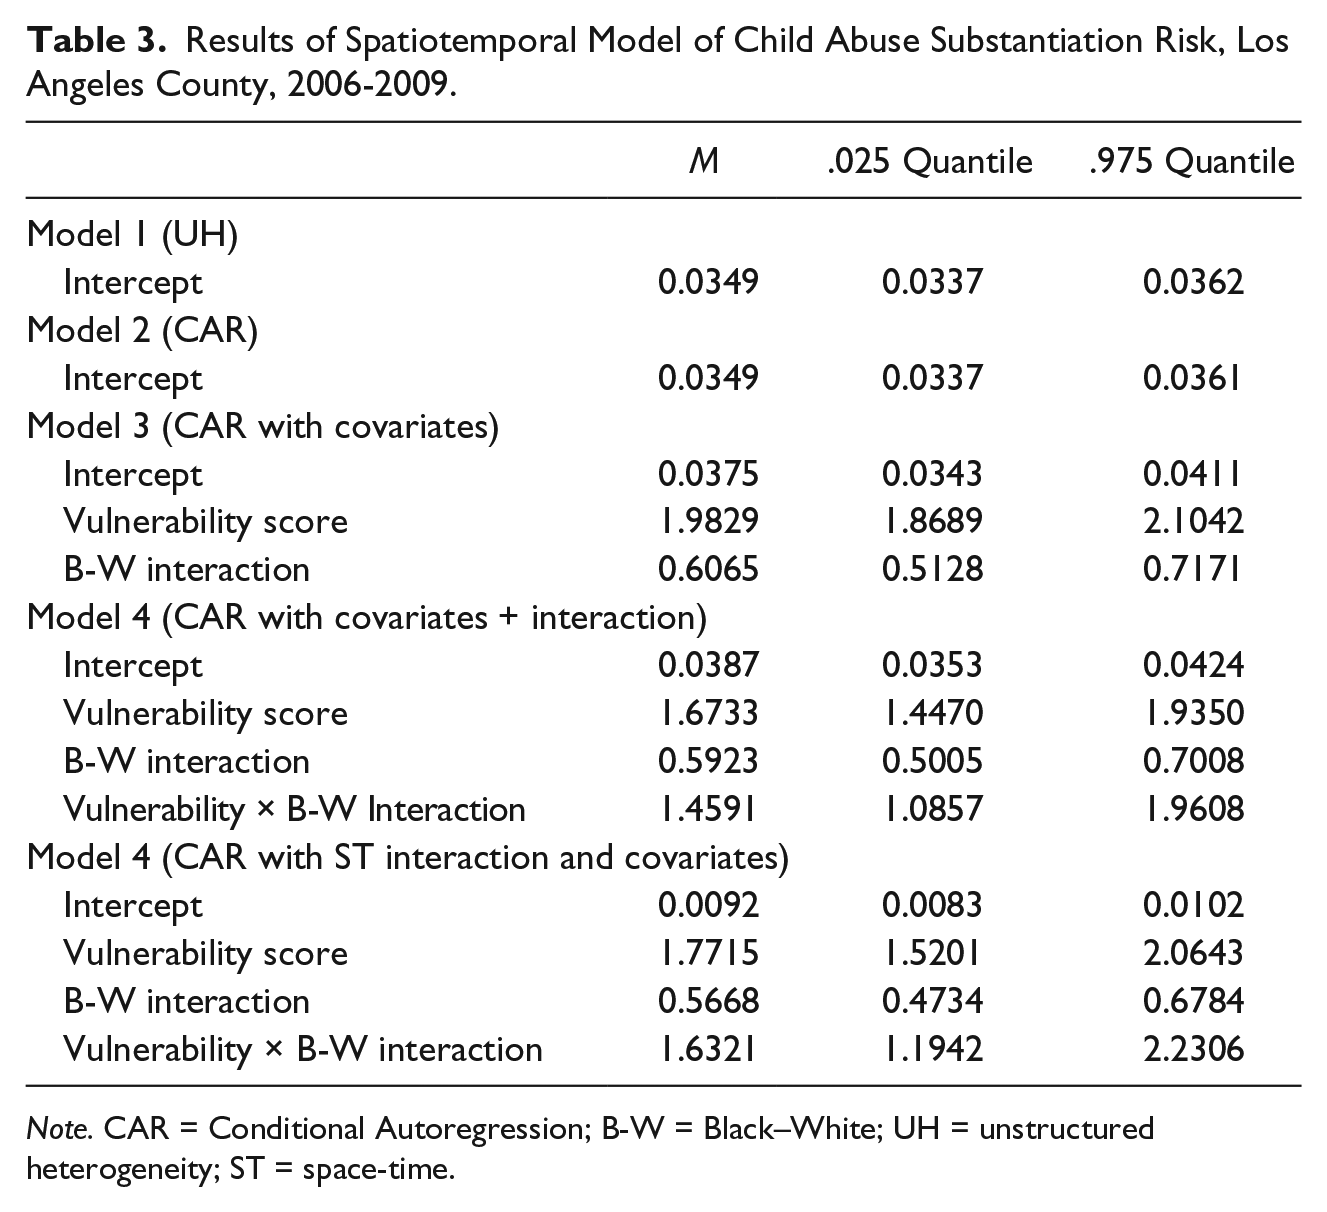
Note. CAR = Conditional Autoregression; B-W = Black–White; UH = unstructured heterogeneity; ST = space-time.
The intercept parameter exponentiates to a mean of .0349 (SD = 1.019; 95% credible interval [CrI] = .0337-.0363), or an overall rate of about nine child abuse substantiations per 1,000 children yearly (95% CrI = 8.41-9.06). The random effect term provides an estimate of the random variation around the intercept mean of the number of child abuse and neglect substantiations in a Los Angeles county census tract on the log scale. A plot of the density distribution for the random effect term was normally distributed and symmetric around zero (not shown but available on request).
Convolution Model
The convolution model adds a spatially structured conditional autoregressive term to the spatially unstructured random effects term. The DIC on the convolution model is 12,335.18 with 1,551.83 effective parameters, which is an improvement on the baseline UH model. There is only one fixed effect in this model, the intercept, again representing the average rate of child abuse and neglect allegations per 1,000 census tract population.
Covariate Models
The final model retained was a first-order random walk-correlated time plus a space–time interaction (Model 4). This model also included the social vulnerability and racial dissimilarity indices and their interaction. The model DIC was the smallest overall (DIC = 12,260.77) with fewer effective parameters (P.EFF = 1,476.26). Holding all other covariates to zero and adjusting for spatial heterogeneity only, every one-unit decrease in the social vulnerability index reduced the risk of child abuse and neglect by 98.3% (Incidence Density Ratio [DR] = 1.7715 [95% CrI = 1.5201-2.0643]). Similarly, for every one-unit increase in the Black–White dissimilarity index, there was a 70.6% decrease in child abuse and neglect risk (IDR = .5668 [95% CrI = .4734-.6784]). In this model, when as the neighborhood becomes increasingly more segregated, child maltreatment risk decreases. Figure 5 shows the predicted rate of child abuse substantiations as social vulnerability scores (Panel A) and racial heterogeneity (Panel B) vary across their respective ranges (i.e., minimum, maximum, M, 25th, 50th, and 75th percentiles). The social vulnerability score has a gradual positive impact on maltreatment rate but begins to increase markedly at the 75th percentile, when variability around the average rate also increases. In contrast, racial heterogeneity has a more constant effect on maltreatment rate. The graph shows that when racial segregation (i.e., homogeneity) and vulnerability are at their max, average maltreatment rate is at its lowest (in Figure 5, Panel B, the maximum value codifies complete segregation). The interaction term indicated that there is a significant interaction effect between social vulnerability and racial heterogeneity (IDR = 1.6321, 95% CrI = 1.194-2.231).

Posterior mean effect (with 95% Credible Interval) of social vulnerability (Panel A) and racial heterogeneity (Panel B) on rate of child maltreatment substantiations per 1,000 in Los Angeles County 2006-2009. CAN = Child Abuse & Neglect.
The coefficient on the interaction term indicates that the effect of segregation is greater in more highly vulnerable contexts (see Figure 6). The best way to interpret Figure 6 is by interpreting the coefficients within levels of vulnerability. Child maltreatment substantiations are significantly higher in segregated (IDR = .64) versus integrated neighborhoods (IDR = .51) in highly vulnerable contexts, whereas in areas of low vulnerability, the IDRs codifying the effect of racial integration (IDR = .38) and segregation (IDR = .35) on child maltreatment substantiations are statistically indistinguishable.
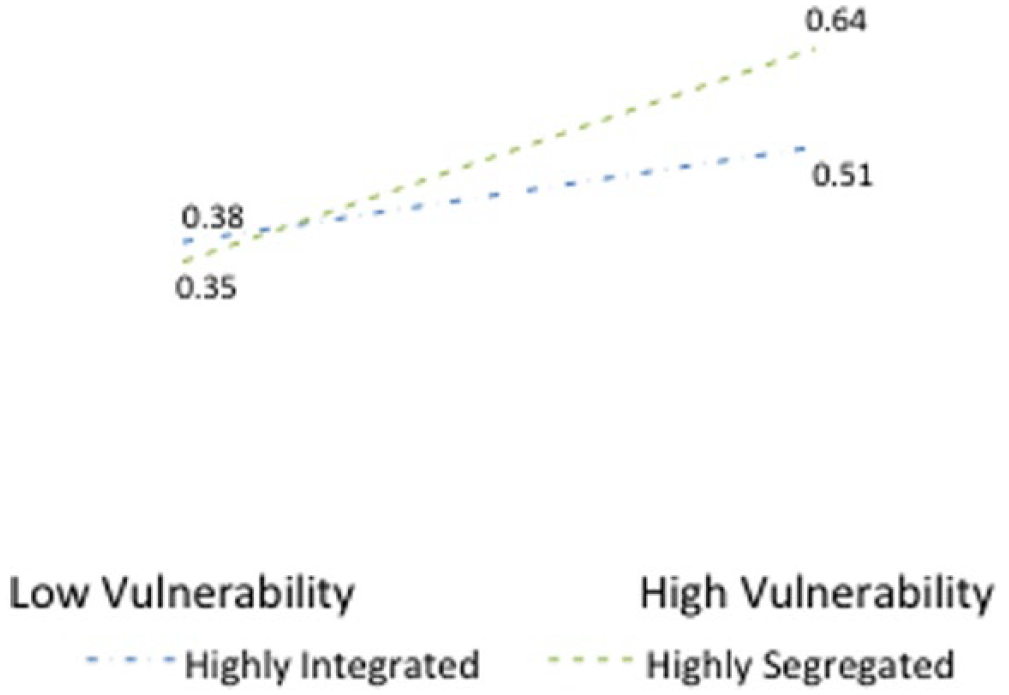
Incidence density ratio of interaction between social vulnerability and racial heterogeneity.
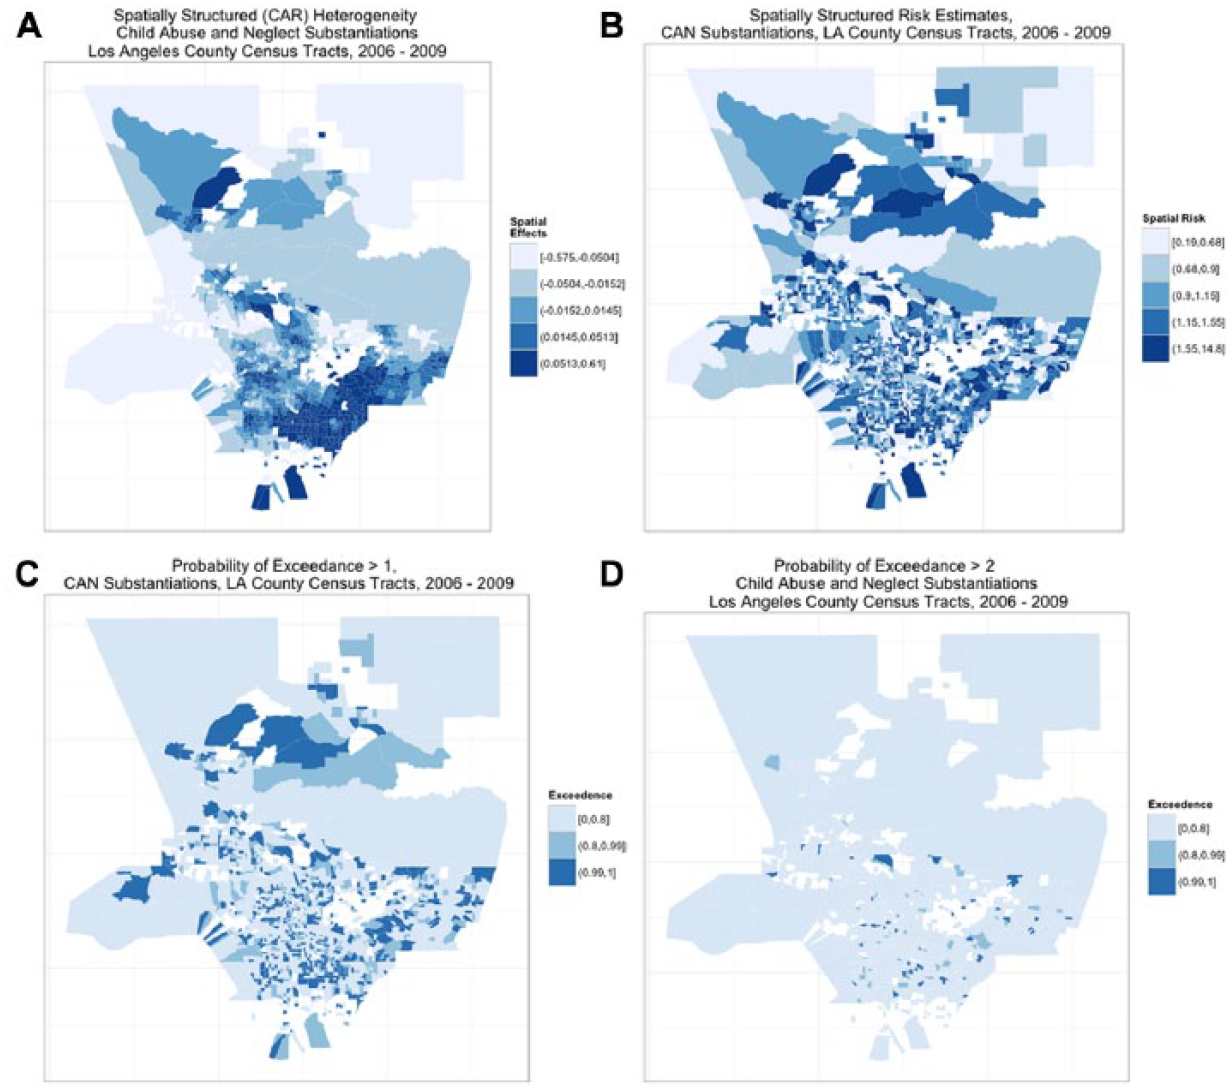
The spatial risk is the residual relative risk of each census tract compared with Los Angeles County controlling for social fragmentation and racial heterogeneity. Figure 7 displays the map of the fitted values, spatial risk, and exceedances probabilities for a relative risk that is greater than 2. Again, examination of the spatially unstructured random effect term demonstrated that it was normally distributed and spatially random. Mapping the spatially structured conditional autoregression term displays areas of spatial patterning and similarity among census tracts. For example, Figure 7, Panel A shows clusters of small areas with relatively high spatial effects, indicating a spatial clustering of risk factors apart from vulnerability and racial heterogeneity. This is particularly true of the southeastern portion of Los Angeles County, an area encompassing 26 sub-neighborhoods (e.g., Compton, Pico Rivera, Bell Gardens, and Norwalk). Panel B shows the spatially structured risk estimates, which identify areas with an increased risk of child abuse and neglect substantiations over the 4-year period. Panels C and D display the posterior probabilities from the model in which the relative risk in a given census track is 1 and 2 times larger than the overall risk for Los Angeles County, respectively. Focusing on the estimates where the probability of exceedance is larger than two, the model suggests that the highest values can be found in the census tracts in the southern portion of Los Angeles County with relative risk estimates between 1.55 and 14.8 and corresponding posterior probabilities greater than .99. Posterior probabilities of 99% and higher can also be found in other portions of southern Los Angeles county. The real scientific interest lies in the residual geographic variability that remains once social vulnerability and racial heterogeneity are controlled. The main message is that there is variation in child maltreatment substantiations that remains above and beyond census tract vulnerability and racial composition but not much. Overall, the spatially structured conditional autoregression term explained 11.7% of the total spatial heterogeneity.
The temporal trend for the 4-year time span, holding the covariates and spatial risk constant, shows a constant and flat rate that declines very little over the period (Figure 8). The corresponding map of exceedances probabilities for the space–time interaction term is presented in Figure 9 for each year. The space–time interaction identifies a small number of areas characterized by a magnitude of risk that is about twice that of Los Angeles County overall after the fixed covariate effects, unstructured, spatially structured, and time random effects are held constant.
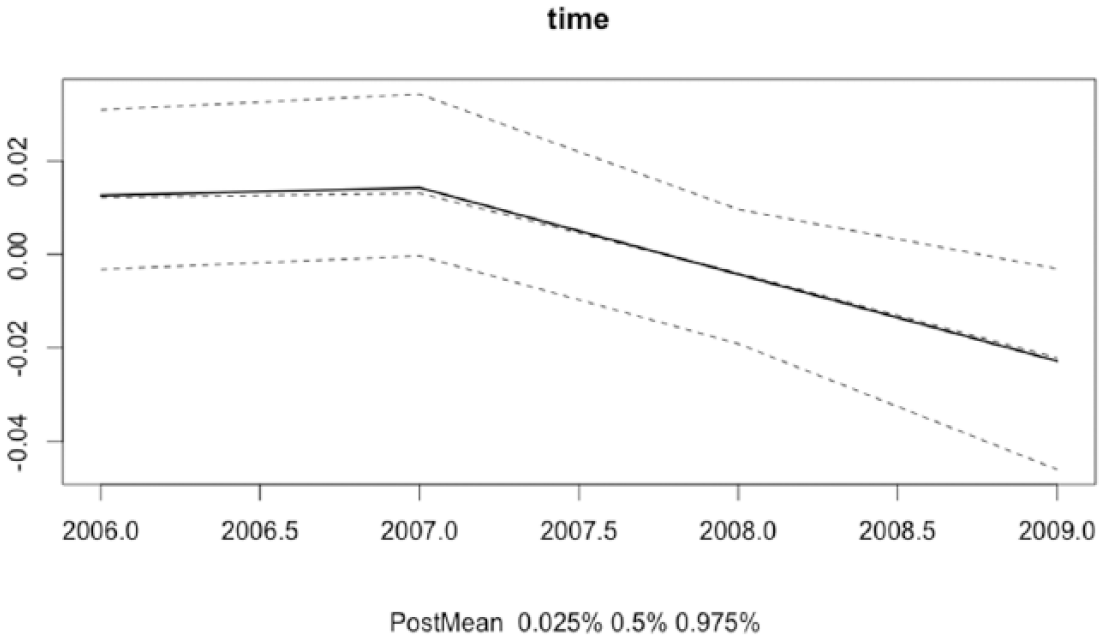
Temporal trend term (M, median, and 95% CrI), spatiotemporal model of child abuse substantiation risk, Los Angeles County census tracts, 2006-2009.
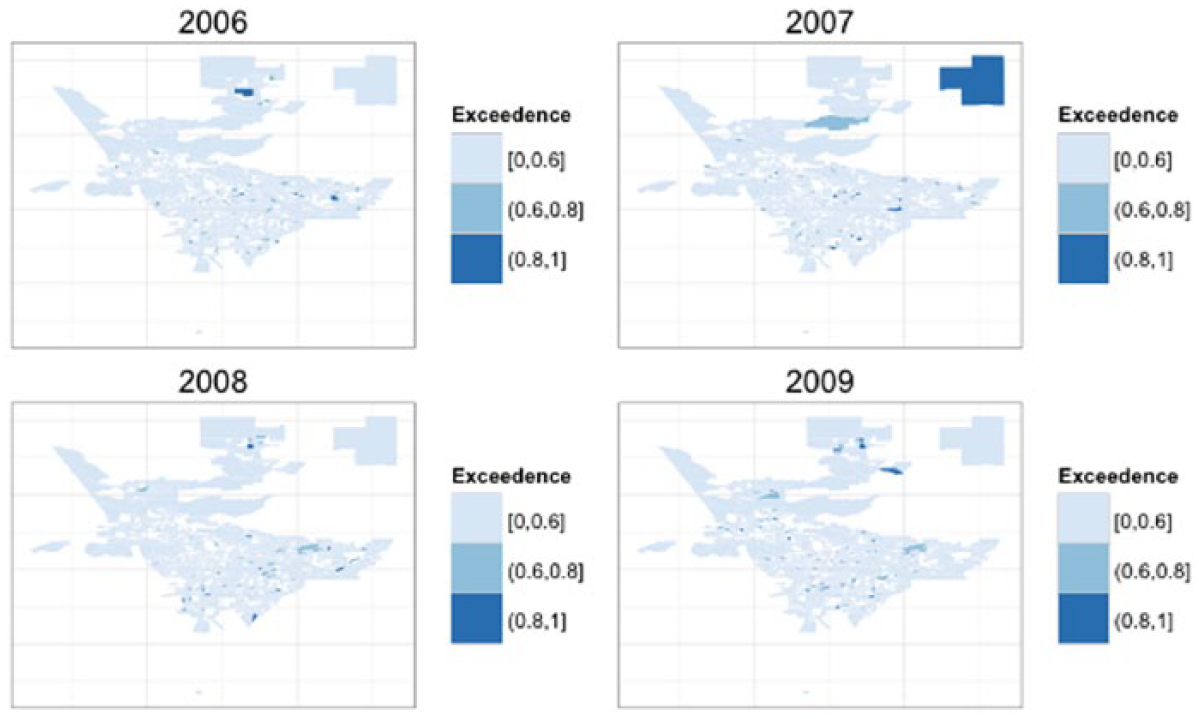
Probability of incidence density ratios > 2, space–time interaction term, spatiotemporal model of child abuse, and neglect substantiation risk, Los Angeles County census tracts, 2006-2009.
Discussion
The results of this study add to this growing body of literature exploring the role of place for understanding child maltreatment substantiations. Bayesian hierarchical methods, which are increasingly gaining popularity as a statistical tool for disease mapping in epidemiological studies, have not until now been utilized to examine incidents of child maltreatment across time and space. Studies using more sophisticated methodological approaches that account for spatial and temporal autocorrelation are particularly important in light of Colton et al.’s comprehensive review of neighborhood influences of child maltreatment in which they found that most research in this area has failed to account for spatial processes (Coulton et al., 2007). The failure to do so has theoretical and empirical implications in that it hinders a comprehensive understanding of the contextual factors influencing child abuse and neglect while producing biased estimates of neighborhood effect sizes.
The current study quantifies the spatial risk of child abuse and neglect at the census tract level while controlling for structural heterogeneity, social vulnerability, and racial segregation. Holding temporal trends constant, the hierarchical spatial analysis revealed that neighborhood spatial structure accounts for about 12% of the variability in child maltreatment substantiations. Previous research has reported effect sizes for place ranging from 2% to 5% (Coulton et al., 1999; Molnar et al., 2003). The difference between the current study and previous studies is probably attributable to varying operational definitions of maltreatment, different units of analysis across studies, and the failure to account for spatial autocorrelation and temporal trends. The temporal time trend indicated a slight downward trend in substantiation rates after 2007, holding other factors constant. Combining time and place allowed for identification of areas for which the observed incidence density ratio or substantiation risk was greater than that for the county as a whole. Exceedance probabilities showed that once social vulnerability and racial segregation were accounted for, the majority of census tracts had maltreatment rates that were consistent with Los Angeles county overall.
Prior empirical studies have uncovered a strong positive relationship between poverty and child maltreatment (Heller, Larrieu, D’Imperio & Boris, 1999; Coulton et al., 2007). In Bartholet’s (2009) analysis of data from the National Incidence Study (NIS), for example, children from families with annual incomes less than US$15,000 were 22 times more likely to experience harm (Bartholet, 2009). Higher rates of maltreatment were also found for children from low socioeconomic backgrounds. The present study is in accordance with this previous research but also extends the well-recognized association by using a comprehensive measure of neighborhood social vulnerability to explore the effect of poverty more broadly. Consistent with other research, the data indicate that maltreatment incidence is not simply a function of the presence of absence of acute poverty but rather is related to affluence in a more linear fashion (Drake & Pandey, 1996). In other words, child maltreatment is higher in highly vulnerable areas compared with medium-vulnerability areas, which is in turn have higher incidence of maltreatment than low-vulnerability areas. Nevertheless, a large amount of variation remained once social vulnerability was accounted for suggesting that the relationship is only partly causal (Drake & Pandey, 1996). This suggests that individual- and family-level dynamics characteristic of abuse or neglect in both the immediate as well as the more distal contexts that include this behavior are critical components of prevention and intervention. This, in turn, forces us to confront the reciprocal interactions between individuals, families, and neighborhoods that predict substantiated child maltreatment above and beyond neighborhood vulnerability alone. A large body of research in this area, for example, has shown that community distress has an adverse impact on parenting behaviors. Moreover, the joint contribution of family and neighborhood characteristics can have a powerful impact on child victimization rates suggesting that child maltreatment is not independent but rather varies systematically across both primary contexts and more distal but still significant environments. Empirical research has established that a number of social problems tend to come bundled together including crime, delinquency, social disorder, low birthweight, infant mortality, school dropout, and child maltreatment (Sampson et al., 2002). For example, children who suffer from neighborhood trauma have been shown to be more likely to be exposed to other forms of violence in the home. Serious efforts to prevent child abuse and neglect must begin to explore the aspects of communities that make them more or less vulnerable to violence in general and to understand how the distribution of resources differentially favors the reporting of child abuse and neglect. Evidence for this lies with the fact that the majority of child maltreatment substantiations result from an inability among parents and guardians to support the basic needs of their children. Because this is labeled “neglect,” it seems reasonable to conclude that neglect is a phenomenon that is more likely in high (but not low) vulnerability areas, implying that the relationship between maltreatment and poverty is really a tautology.
In addition, although qualities of individuals and families that assist them in achieving economic success cited by Drake and Pandey (1996; for example, good psychological adjustment, propensity toward interpersonal conflict) may protect against the occurrence of some forms of abuse, it is more difficult to see how these same qualities protect children from all forms of abuse (e.g., sexual abuse). Indeed, sexual abuse substantiation rates appear to be invariant to neighborhood poverty levels (Drake & Pandey, 1996). This forces us to question, therefore, the relative salience of concentrated disadvantage versus the positive influence of neighborhood affluence for understanding child maltreatment, a phenomenon that has largely been overlooked but not new. Brooks-Gunn, Duncan, Klebanov, and Sealand (1993), for example, argued that the positive influence of concentrated socioeconomic resources, rather than the presence of low-income neighbors, is more useful for understanding adolescent outcomes (Brooks-Gunn et al., 1993; Sampson et al., 2002). If true, effective prevention and intervention of child maltreatment depends critically on understanding those aspects of individuals, families, and communities that discourage recognizing and reporting child maltreatment. Quite possibly, in socially advantaged neighborhoods, child abuse and neglect remain undetected because residents are less interested in recognizing or reporting it or it may be more likely to be ignored, overlooked, and misconstrued. This is in accordance with a recent study suggesting that neighborhoods willing to control crimes in public spaces (i.e., neighborhoods characterized by low levels of social vulnerability) may have a traditional more “hands off” approach to family violence (Emery, Jolly, & Wu, 2010).
The current study extends the well-recognized association between social and economic deprivation by statistically testing for the existence of a differential “racial heterogeneity” moderation effect across levels of census tract social vulnerability. The data showed that highly vulnerable neighborhoods present a risk to children but that the risk is higher in areas characterized by high levels of racial heterogeneity. In other words, racial homogeneity offers a degree of protection against risk of substantiated maltreatment allegations in highly vulnerable neighborhoods. No such protective effect was observed in low-vulnerability neighborhoods. It is interesting to juxtapose these results with questions regarding the overrepresentation of Black children in the welfare system. Three explanations that have been invoked for explaining the disparity are consistent with the current investigation. First, multiple risk factors increase the likelihood that Black parents will maltreat their children (Cappelleri, Eckenrode, & Powers, 1993; Gil, 1970; Jason, Andereck, Marks, & Tyler, 1982; Lauderdale, Valiunas, & Anderson, 1980; Spearly & Lauderdale, 1983). Second, the causal role of structural disadvantage with race being merely consequent of socially vulnerable conditions (Gelles, 1982; Pelton, 1978). The third explanation focuses on the role of institutional racism and in particular empirical studies showing that Blacks and Whites are treated differently at various stages of the decision-making process and that once poverty and risk factors are controlled, Black children are less likely to be maltreated than their White counterparts (Hill, 2004). The institutional racism explanation has been attributed to the devaluing of the culture and functioning of Black families such that guarding and protecting them are not priorities. Although more research is needed to sort out these various competing explanations, it is possible that in racially heterogeneous neighborhoods, Black culture is devalued and deprioritized to a greater extent than when the neighborhood is racially homogeneous.
This vision of the differential value and perceived function of the Black family and the corresponding impact for child maltreatment is consistent with the assumptions of social disorganization theory, which articulates a vision of shared community norms and collective efficacy in areas that are not characterized by racial stratification. The moderating role of racial heterogeneity found in high-vulnerability areas may reflect the importance of considering different measures of informal social control that depend on the racial composition of the neighborhood. For example, informal social control may be more punitive in highly vulnerable neighborhoods characterized by high levels of segregation, but in racially homogeneous neighborhoods, the emphasis may have more to do with protecting children through strong non-casual relationships between neighbors (Emery et al., 2015). Previous studies have shown that neighborhoods and their residents can be stigmatized due to signs of social disorder and high proportions of people of color. In racially segregated contexts, child maltreatment allegations are more likely to be based on cultural differences that determine how child maltreatment is defined, recognized, and reported (Coulton et al., 2007). As such, differences in community-level norms and standards are reified in the reporting process. This study opens the possibility that social stigma is more of an issue in vulnerable neighborhoods characterized by racial heterogeneity translating to higher substantiation rates.
To the extent that collective efficacy exists, the findings suggest that community norms and standards are more similar in low-vulnerability neighborhoods irrespective of racial heterogeneity, whereas in highly vulnerable racially segregated neighborhoods, the ability to create strong social bonds and maintain collective efficacy tends to be undermined. A potential explanation supported by previous research is that shared norms are not conditioned by racial context in low-vulnerability neighborhoods, but in high-vulnerability neighborhoods, both race and place matter. This is supported by the work of Korbin et al. (1998), who found that in poor, disinvested areas, the existence of factors favoring community social organization creates a neighborhood that can be “remarkably supportive of children” and community members more supportive and connected around parenting practices (Korbin et al., 1998). It is also consistent with the large body of research cited above suggesting that residence in poor neighborhoods matters more for children of different races and/or ethnicities (Drake & Pandey, 1996; Freisthler et al., 2007; Klein & Merritt, 2014; Wulczyn et al., 2013).
Like many others, the present study confirms the independent role of local context for influencing both child maltreatment rates and individual- and family-level behaviors. The findings associated with the current study are informed by previous research, but clearly more work must be done to situate individual-level factors in the community context. Without more data, particularly at the individual level, the myriad of different possibilities regarding the relative contributions of each are impossible to sort out. The stress and trauma associated with living in impoverished neighborhoods due to higher rates of incarceration, community violence, and unmet basic needs may manifest itself through higher levels of actual abuse and neglect, and more alleged incidents, affecting individuals and their families. However, it is important to keep in mind that individual- and community-based stress and trauma affect low- and medium-vulnerability areas in addition to high-vulnerability areas. The impact, however, is not the same due to differential access to and distribution of resources. Future research might investigate the direct and indirect relationship between trauma, social vulnerability, and child maltreatment by exploring, for example, the mediating role of neighborhood-level stress and trauma on the relationship between social vulnerability and child maltreatment in different settings (e.g., urban vs. rural).
Limitations
There are a number of limitations that affect the types of conclusions that can be drawn from these aggregate-level measures. First, despite its contributions, ecological-based studies such as the present investigation are limited because area-level characteristics cannot be reliably projected onto individuals in communities (the ecological fallacy). In addition, census tracts may be imperfect operational definitions of neighborhoods (Sampson et al., 2002). Second, many studies assume that child maltreatment substantiations and victimizations are the same. They are not. Therefore, the current study is limited by an inability to know whether actual instances of abuse or neglect took place, that is, whether there is a real “victim.” Given the inadequacies of social service agencies’ awareness of potential maltreatment, in which an abuse or neglect can be made by any person for any reason, some bias in the data most certainly exists. It is also impossible to sort out the causal mechanisms or social processes describing the institutional dimensions explaining the role of neighborhoods to describe how change occurs (Sampson et al., 2002). To move us closer to understanding the causal processes corresponding to the complexity of child maltreatment across multiple levels of analysis, innovative methodological approaches must incorporate lower level units of analysis that feature individual- and family-level data measured over time. Therefore, the failure to disaggregate these data according to abuse and neglect may qualify these results. Future studies should consider type of abuse separately, something that was not done in the current study. Also, the actual race of the maltreated child was unknown, which is a factor that would add significantly to the current findings. Although this study was longitudinal and not subject to the limitations of cross-sectional studies, the results are only generalizable to Los Angeles County, which may be unique in the way child maltreatment substantiations are handled.
Implications for Understanding Diversity in Child Maltreatment
Prevention and intervention of child maltreatment must focus on identifying child abuse and neglect in low-vulnerability neighborhoods, where it may be going undetected. This, however, requires a more nuanced approach than simply identifying and targeting high-risk or socially vulnerable census tracts for the purpose of providing additional resources. It requires understanding how racial heterogeneity undermines the competing goals of community norms, particularly around parenting practices. In turn, serious efforts to minimize harm to children will require a focus on neighborhood characteristics, including but not limited to, strengthening relationships among neighbors as well as approaches that encourage practicing more protective rather than punitive forms of informal and formal social control (with the caveat that neither is necessarily better). It also requires understanding how community norms impede efforts at identifying abuse in areas of high vulnerability irrespective of race.
Footnotes
Declaration of Conflicting Interests
The author(s) declared no potential conflicts of interest with respect to the research, authorship, and/or publication of this article.
Funding
The author(s) received no financial support for the research, authorship, and/or publication of this article.