
Abstract
Research shows that nonoffending mothers are frequently held at fault for child sexual abuse (CSA), by both society and professionals, with contradictory explanations for the fault. For example, the same maternal characteristic can be used to assign blame or alleviate blame (i.e., single mothers have been held more at fault for their child’s CSA and less at fault). The purpose of this study was to assess a theoretically based model that could account for these different reasons. We tested the stereotype content model (SCM), which examines the content of stereotypes toward target groups, by focusing on perceptions of that group’s levels of warmth and competence. We sampled 136 undergraduate participants who read a vignette describing CSA, and completed the SCM with the mother of the victim as the target, and measures of mother fault. Our results showed that participants fell into three SCM groups of mother fault: (a) Moderate Contemptuous Prejudice (i.e., low competence, low warmth); (b) Admiration (i.e., moderate competence, high warmth); and (c) Very Contemptuous Prejudice (i.e., very low competence, very low warmth). Each cluster also held unique emotions toward the mother, as predicted by the SCM. Results further showed that assigned levels of fault were significant, but that fault did not vary by SCM group, lending support to the ideas that the SCM can be applied to this group and that different participants assign fault for different reasons.
Mothers tend to be held at fault for child sexual abuse (CSA), even when they are not perpetrators of that abuse (i.e., nonoffending mothers; Toews, Cummings, & Zagrodney, 2019; Zagrodney & Cummings, 2016; Davies & Krane, 1996; Dietz & Craft, 1980; Fong & Walsh-Bowers, 1998; Ford, Schindler, & Medway, 2001; Harding, Zinzow, Burns, & Jackson, 2010; Joyce, 2007; Reidy & Hochstadt, 1993). Mothers of sexually abused children have been perceived as colluding in CSA or failing to protect their children (Davies & Krane, 1996) and experience blame from the abused child, family, as well as the legal system (Fong & Walsh-Bowers, 1998). Fault for CSA is even attributed to nonoffending mothers by professionals who work with such families (Fong & Walsh-Bowers, 1998; Reidy & Hochstadt, 1993). For example, Reidy and Hochstadt (1993) reported that 70% to 80% of mental health professionals attributed some responsibility to the mother for both father–daughter incest and sexual abuse by a neighbor. Similar findings were reported by Joyce (2007) using a sample of clinical social workers. More specifically, various behaviors and characteristics of the mother are related to the level of fault assigned to her following CSA (Toews et al., 2019; Zagrodney & Cummings, 2020, 2017), such as the mother’s extracurricular activities (e.g., shopping, spending time with friends), reputation, relationship between child and perpetrator (e.g., mother’s boyfriend versus biological father), and amount of time spent with the child (Toews et al., 2019; Zagrodney & Cummings, 2016, 2020).
Such blame has substantial negative implications for mothers and children affected by CSA. For example, mother blame is associated with lowered chances of the abuse being reported to police or child protective services (Lovett, 2004), less social and mental health services received (Jackson & Mannix, 2004; Joyce, 2007; Plummer & Eastin, 2007), and child removal from the home by child protective services (Leonard, 2013). Moreover, mother blaming serves to perpetuate the myth of the “perfect mother,” and can lead to internalization of unrealistic expectations that leads to self-blame (Jackson & Mannix, 2004).
Since it has been established that mothers are held at fault for CSA, researchers in this area have attempted to move beyond this question (whether or not mothers are held at fault for CSA) to identify the reasons mothers are held at fault (i.e., justifications for attributions). Multiple justifications have been reported including the mother’s relationship with the perpetrator (Zagrodney & Cummings, 2016), perceptions of the mother not appropriately vetting child care providers (Toews et al., 2019), and intimacy of the mother–child relationship (Toews et al., 2019). Some participant justifications include the expectation that mothers should “just know” who CSA perpetrators are even without explicit knowledge regarding perpetrator risk (Zagrodney & Cummings, 2020).
However, this previous body of research suffers from limitations. First, although attempts to understand attributions for mother fault are admirable, no coherent or explanatory theory has emerged thus far from previous studies. Rather, researchers and professionals working with families affected by CSA are instead left with an ever-increasing list of variables that potentially explain mother fault. Lack of theory substantially limits our ability to predict mother blame or design interventions to decrease mother blame or assist mothers of CSA victims to cope with such blame.
Second, previous results have been contradictory, both within samples of participants (or even within the same participant) and from study to study. For example, Zagrodney & Cummings (2020) found that participants utilized mother’s trust in the CSA perpetrator as both a justification for increased and decreased fault attributions: Some participants felt mothers are free from blame in situations with a known perpetrator because they should be able to trust their loved ones with their children’s well-being; however, other participants felt mothers should be blamed because of the trust they placed in someone who turned out to be a CSA perpetrator. Within that study, some participants even provided explanations that both assigned and alleviated mother blame for CSA, within the exact same open-ended response. Some specific variables have been shown to predict both increases and decreases in fault attributions, such as being a single mother (Toews et al., 2019). Still other variables have been shown to have different associations with mother fault attributions depending upon method of assessment (i.e., quantitative or qualitative methods). For example, having low social support and being stressed/overwhelmed have been shown to increase mother fault if assessed quantitatively, but to decrease fault if assessed qualitatively (Toews et al., 2019) whereas characteristics such as having a life beyond one’s child and having a history of CSA victimization are shown to be unrelated to blame when measured quantitatively, but to decrease blame when assessed qualitatively.
In summary, predictors of mother fault have been inconsistent. Overall, different participants appear to hold mothers at fault for CSA for different reasons. Instead of providing clarification for why mothers are held at fault, recent research has only served to further muddy our understanding of CSA fault attributions by generating an increasingly lengthy list of predictor variables. As mentioned, this confusion hinders both research progress and the ability to translate research findings into usable strategies for families affected by CSA. Thus, the purpose of this study was to examine a potential explanatory framework that could be applied to mother fault for CSA to make sense of the many variables shown to impact mother fault, the inconsistencies in fault justifications, and the fact that different participants use different reasons to justify attributions of fault. That framework was the Stereotype Content Model (SCM).
SCM
Traditionally, the term stereotype implies the presence of antipathy toward a social group (i.e., an outgroup, or group that one does not belong to; Allport, 1954; Crosby, Bromley, & Saxe, 1980; Sigall & Page, 1971). The authors’ purpose in developing the SCM was to create an explanatory model of stereotypes and associated prejudiced behaviors that could explain differences in stereotypes based on type of subgroup. Whereas previous theories of stereotype focused on process, Fiske, Cuddy, Glick, and Xu (2002b) argued that stereotype content matters. That is, the SCM provides a more nuanced understanding of why stereotypes are held, by examining the specific content of those stereotypes, rather than simply acknowledging blanket antipathy toward an outgroup. Using the SCM, stereotypes against outgroups can be mapped onto the levels of perceived warmth (i.e., high/low) and competence (i.e., high/low) that subgroup members are seen as possessing (Cuddy, Fiske, & Glick, 2008; Fiske, Cuddy, & Glick, 2007; Fiske and colleagues, 2002b). As explained in Fiske and colleagues (2002b), labels of high or low competence are based on perceptions of group power and status, with powerful and high status groups being perceived as more competent and powerless and low status groups being perceived as less competent. Labels of high or low warmth are based on perceptions of competition, with outgroups being perceived as relatively warm if they do not compete with others and less warm if they do. Overall, the SCM posits nearly universal principles of societal stereotypes and their relation to social structure (Cuddy et al., 2009). It has received substantial empirical support (e.g., Fiske, 1998, p. 380; Fiske, Cuddy, & Glick, 2002a; Fiske, et al., 2002b; Fiske, Xu, Cuddy, & Glick, 1999; Glick & Fiske, 1999, 2001) and these dimensions have been shown to account for 82% of the variance in impressions of individuals (Wojciszke, Bazinska, & Jaworski, 1998).
Together, these dimensions create a four-quadrant stereotype grid (i.e., high warmth/low competence, low warmth/high competence, low warmth/low competence, and high warmth/high competence). Furthermore, each quadrant elicits specific affective reactions to members of groups placed in that stereotype content category (Cuddy, Fiske, & Glick, 2004, 2007; Fiske et al., 2002a; Fiske et al., 2002b). Groups perceived as low competence but high warmth (i.e., “paternalistic prejudice”) elicit pity and sympathy, groups perceived as low competence and low warmth (i.e., “contemptuous prejudice”) elicit disgust and resentment, and groups perceived as high competence but low warmth (i.e., “envious prejudice”) elicit envy and jealousy. The combination of high warmth and high competence tends to be reserved for ingroup members and close allies and elicits pride and admiration (Fiske et al., 2002b). Research utilizing the SCM has assigned quadrant “locations” to a number of outgroups including “poor whites” and “welfare recipients” (low competence/low warmth), the “elderly” (low competence/high warmth), and the “rich” (high competence/low warmth).
Expectations and Stereotypes of Mothers
In general, stereotypes surrounding varying groups of mothers are vast. Although the conceptualization of a mother has changed over time, there are still collective societal values in a mother that are greatly valued and expected (Clevenger, 2016). As a result, society tends to judge certain mothers as adhering or not adhering to these values, depending on the values the mothers personally hold and their children’s mental and physical health. Furthermore, there appears to be an expectation of appropriate motherhood behavior that mothers are frequently regarded as having not lived up to (Azzopardi, 2015).
Studies on stereotypes about mothers indicate that marital (Ganong & Coleman, 2005), occupational (Etaugh & Nekolny, 1990; Okimoto & Heilman, 2012), and socioeconomic status (Dodson & Schmalzbauer, 2005) are prominent social categories by which mothers are stereotyped. With regards to mothers and occupational status, working mothers are viewed as less dedicated to their families than nonworking mothers (Etaugh & Nekolny, 1990) and as less effective parents (Okimoto & Heilman, 2012). There are also various negative stereotypes surrounding impoverished or low-socioeconomic status mothers, including beliefs that they are on drugs, lazy, and that they do not have it together (Dodson & Schmalzbauer, 2005). Stereotypes surrounding married mothers tend to be quite positive, with people viewing them as protective, forgiving, warm, caring, and excellent parents; whereas stepmothers, divorced mothers, and never-married mothers are frequently ascribed various negative stereotypes (Ganong & Coleman, 2005).
Although stereotypes of mothers in general have been well studied, there is only one instance where the SCM specifically has been applied to study stereotypes of mothers. Cuddy et al. (2004) investigated people’s perceptions of working women who became mothers. Their results showed that in the workplace, female employees who are also mothers are viewed as less competent, but more warm, than female employees who do not have children (or men, whether fathers or not; Cuddy et al., 2004). However, the SCM has been found to be highly applicable to understanding stereotypes of women more broadly. This model suggests that most, if not all, female subtypes fall into two mixed-valence clusters of stereotypes; women are either respected or liked, but not both (Cuddy et al., 2004; Eckes, 2002; Fiske et al., 2002b; Fiske et al., 1999). Examples of admired groups of women (high warmth/high competence) include “society ladies” and “confident-types,” while those receiving contemptuous prejudice (low warmth/low competence) include “chicks,” “trendy women,” “bourgeois,” and “naïve” types (Fiske, 2012). “Housewives,” “secretaries,” and “wallflowers” have received paternalistic prejudice (low competence/high warmth), whereas “feminists,” “career women,” “intellectuals,” “vamps,” “punks,” and “hippies” have received envious prejudice (high competence/low warmth; Fiske, 2012). Given the SCM’s success at characterizing stereotypes of women but the limited research on its applicability to understanding mothering stereotypes, further investigation into this area is warranted.
Application of the SCM to Mothers of CSA Victims
As previously discussed, research on mother fault has established that various behaviors and characteristics of the mother are related to the level of fault attributed to her after CSA. However, also as previously discussed, this research lacks a coherent explanatory theory of fault attributions and has produced contradictory results. Overall, this research indicates that although participants do hold mothers at fault for CSA, they might be holding mothers at fault for different reasons, which could explain the contradictory findings in this area. Similarly, stereotypes within the SCM explain how prejudiced views are applied to different groups based on unique combinations of high/low perceived warmth and competence—explaining why different people hold stereotypes against different groups. Given these contradictory previous findings and these characteristics of the SCM, we hypothesized that the SCM might be an appropriate lens through which to examine mothers of CSA victims and that, moreover, it might provide a more explanatory theoretical model of why mothers are held at fault for CSA. That is, utilizing the SCM as a framework from which to examine blame and associated constructions might elucidate different reasons that individuals blame mothers for CSA.
Study Aims
To our knowledge, the SCM has never been applied to this subgroup of mothers. Our study is also unique in that rather than sorting specific subgroups (e.g., “feminists,” “housewives,” “the elderly,” “welfare recipients”) into the SCM grid we sorted groups of participants into the stereotype quadrants, in an attempt to explain how different individuals might view mothers of CSA victims, given that previous research indicates fault is assigned using multiple justifications.
Aim 1: Participants’ SCM Clusters
Our first aim was to assess how participants categorized nonoffending mothers of CSA victims in terms of stereotype content, expecting different combinations of warmth and competence to emerge from our data. Given the limitations and contradictory nature of previous research in this area, we made no specific hypotheses regarding which prejudice categories (i.e., paternalistic, contemptuous, envious, and admiration) would be represented in our sample.
Aim 2: Emotions, Status, and Competition
Our second aim was to examine emotional responses within those groups of participants to assess if our participants’ emotions toward the mother, beliefs about status of the mother (i.e., education level and economic success), and feelings of competition with the mother (i.e., she will receive special breaks or take resources away from others) were consistent with SCM predictions, lending further credibility to our application of the SCM. Consistent with SCM theory, we expected that any participants in the low warmth, low competence cluster would project contemptuous emotions toward the mother described in our vignette (e.g., anger, resentment) as well as low status/competition; any in the high warmth, high competence cluster would project admiration (e.g., pride, respect) and high status/no competition; any in the low warmth, high competence cluster would project feeling of envy (e.g., competitive, jealous) and high status/competition; and any in the high warmth, low competence cluster would project feelings of paternalism (e.g., pity, sympathy) and low status/low competition.
Aim 3: SCM Clusters and Mother Fault
Our last aim was to examine the potential relations between participants’ location on the SCM and their levels of mother fault for CSA. We expected that participants would, in general, assign significant levels of fault to the mothers. However, consistent with our expectations that the SCM is an appropriate theoretical lens for this research, we predicted mothers would be held at fault for different reasons (i.e., stereotype content) and thus no significant differences were anticipated between clusters on mother fault.
Method
Participants
136 undergraduate participants with a mean age of 20.42 (SD = 3.13) participated in this study. Our sample comprised 97 females (71%), 38 males (28%), and one individual who did not report gender. The sample was primarily Caucasian (n = 98), and included Asian (n = 14), Aboriginal (n = 7), African American (n = 6), and Hispanic (n = 3) participants. Most individuals reported that they were not parents (n = 130), while six reported that they were parents.
Measures
Demographic form
Participants completed a short demographic form, which asked the participants’ age, gender, ethnicity, and if they were a parent.
Sexual abuse vignette
An adaptation of the CSA vignette used by Waterman and Foss-Goodman (1984) was given to participants (see appendix). This adaptation has been found, in previous studies, to provide sufficient prompting for participant responses in both quantitative and qualitative contexts (Toews et al., 2019; Zagrodney & Cummings, 2016). The vignette describes the sexual abuse of a child, Mary, by her 35-year-old uncle, while her mother is “out.” Participants were provided with this vignette to review to have a target (i.e., Mary’s mother) in mind for the questionnaires.
Mother fault questionnaire
After reading the vignette, participants responded to four items regarding mother fault for the CSA (Back & Lips, 1998; Zagrodney & Cummings, 2016) using Mary’s mother (i.e., the vignette) as the target. Two of the items included: (a) blame (i.e., “How much blame do you place on the mother for the sexual abuse of the child?”) and (b) responsibility (i.e., “How much responsibility do you place on the mother for the sexual abuse of the child?”). Participants answered the blame and responsibility items on a 4-point scale, ranging from 0 (none at all) to 3 (complete). Next, participants rated (c) the cause of the abuse (i.e., “I feel the mother caused the sexual abuse of the child”), and (d) prevention (i.e., “I feel the mother could have prevented the sexual abuse of the child”). Participants responded to the cause and prevention items on a 4-point scale, ranging from 0 (disagree strongly) to 3 (completely agree). Cronbach’s alpha for our sample was .85. Consistent with previous studies (e.g., Toews et al., 2019; Zagrodney & Cummings, 2016), we examined each subscale as predictors in our analyses but also analyzed the overall mother fault score, which is calculated by summing all items.
SCM
Participants also completed the SCM questionnaire (Fiske et al., 2002b), using Mary’s mother as the target. We used Fiske and colleagues’ short version of the competence and warmth subscales. Participants first answered four questions, two which assessed the dimension of competence (i.e., “As viewed by society, how competent are members of this group?,” and “As viewed by society how confident are members of this group?”) and two which assessed the dimension of warmth (i.e., As viewed by society, how warm are members of this group?,” and “As viewed by society, how sincere are members of this group?”). These questions were answered on a 5-point scale ranging from 1 (not at all), to 5 (extremely). To determine the reliability of both of these two-item scales, we utilized Spearman–Brown’s coefficient (Eisinga, Grotenhuis, & Pelzer, 2013), and found that our warmth (ρ = .87) and competence scales (ρ = .61), had adequate reliability.
The SCM includes additional questions about emotions that coincide with the different stereotype content dimensions. These questions were answered on the same 5-point scale as above. Consistent with Fiske and colleagues (2002b) we chose the six emotions that they hypothesized would differentiate clusters: contempt, disgust, anger, resentment, pride, and admiration. In addition, Fiske and colleagues (2002b) hypothesized that stereotypes toward cluster groups might also be differentiated by beliefs in the status and feelings of competition toward the target group. We thus included the SCM questions related to views of the economic success and education level of the mother (i.e., status), as well as their belief that the mother would get special breaks, or take resources away from the participant (i.e., competition).
Procedure
We first received institutional review board (IRB) approval to conduct this study. Participants were recruited online (after being warned of the potentially upsetting discussion of CSA, as requested by our IRB) then completed the study via a secure website. Once participants signed up for the study, they were shown a consent form; free and informed consent was implied if they chose to advance to the study questionnaires. Following this, participants completed the demographic form. They then read the CSA vignette, and then completed the SCM and mother fault questionnaire. Participants were then provided with a debriefing form and awarded course credit for their participation.
Results
Aim 1: Participants’ SCM Clusters
The SCM uses cluster analysis to group participants into locations on the SCM grid (e.g., Cuddy et al., 2008; Cuddy et al., 2009; Fiske, et al., 2002b; Lee & Fiske, 2006) based on their ratings of the levels of warmth (i.e., combination of sincerity and warmth measures) and competence (i.e., combination of confidence and competence measures) of the mother. Cluster analysis is a reduction method of statistical analysis for multivariate data which organizes individuals with similar profiles, perspectives, or responses into homogeneous groups or clusters (Cai, Le-Khac, & Kechadi, 2012; Haynes, 2014; Leonard & Droege, 2008; Thatcher, Savage, & Simpson, 2012; Yim & Ramdeen, 2015). Clusters were reached by combining Ward’s hierarchical clustering using a squared Euclidean distance measure and a k-means clustering method using the number of clusters first identified via Ward’s method.
Ward’s (1963) method, a variance agglomerative method, was employed to determine the best fitting number of clusters. It minimizes within-cluster variance to ensure that the participants allocated to each cluster are similar to one another, but distinct from the other cluster groups (Sarstedt & Mooi, 2014; Ward, 1963). More specifically, the use of this method minimizes the sum of squared distances of points from the cluster center (Tan, Steinbach, Karpatne, & Kumar, 2006) and is recommended as the default approach for hierarchical cluster analyses when a data set does not include any outliers and equally sized clusters are expected (Mooi & Sarstedt, 2011), as with our data. The squared Euclidean distance measure was used as it allows for the interpretation of dissimilarities as physical distances, and is the most commonly used method in combination with Ward’s method (Everitt, Landau, Leese, & Stahl, 2011; Nandi, Fa, & Abu-Jamous, 2015).
After conducting this hierarchical clustering analysis, the agglomeration schedule, scree plot, and dendrogram outputs were all used to determine the number of clusters (Yim & Ramdeen, 2015). Based on the percent change in the agglomeration coefficients, the first noticeable increase in coefficients occurred between stages 132 and 133. For this reason, we chose to stop clustering after stage 132. The scree plot also showed a large increase in coefficients after stage 132. Furthermore, because there is no formal stopping rule for hierarchical cluster analysis, a cutoff must be determined from the dendrogram to signify when the clustering process should be stopped (Bratchell, 1989; Yim & Ramdeen, 2015). To do this, we first identified a constant height cutoff value of the clusters (where the height of the clusters was similar across the dendrogram; approximately 4.5), and then cut the dendrogram branches at this height. Using this constant height cutoff indicated a three-cluster solution. To ensure that this solution provided the best fit, we then incorporated information from both the agglomeration schedule and the dendrogram. From the agglomeration schedule we also determined that it would be best to stop the cluster analysis after the 132nd stage, thereby eliminating the last two stages (Stages 133 and 134). This decision was reflected in the dendrogram, where the last two vertical lines (representing the last two stages in the agglomeration schedule) were cut from the cluster solution.
Theoretically, these three clusters also made sense when compared to the next cutoff. Specifically, when we ran the analyses with a four-cluster solution, the fourth cluster was not significantly different from the third cluster on the competence measure. In addition, the warmth and competence center values attributed to this fourth cluster remained around the mid-point, or value of “three,” thus not falling into any of the specific prejudice quadrants identified by Fiske et al. (2002). That is, this cluster would not allow for adequate interpretation or theoretical conclusions to be drawn. In summary, three clusters were determined to be the best solution for our data.
Next, a nonhierarchical k-means cluster analysis with the parallel threshold method (Green, Carmone, & Smith, 2011) and three-cluster solution was conducted. The k-means algorithm is based on within-cluster variation as a measure to form homogeneous clusters (Sarstedt & Mooi, 2014) and aims to segment the data in a way that the within-cluster variation is minimized (Sarstedt & Mooi, 2014). Convergence (i.e., no change in the cluster affiliations) was achieved after three iterations. Totally, 51% of participants were in the first cluster, 27% were in the second cluster, and 22% were in the third cluster. For the first cluster, the cluster center value for competence was 2.78 (SD = .49), and for warmth was 2.95 (SD = .45). For the second cluster, the cluster center value for competence was 3.36 (SD = .44) and for warmth was 4.18 (SD = .46). For the third cluster, the cluster center value for competence was 1.68 (SD = .43) and for warmth it was 2.07 (SD = .54). These first and third clusters fall within the “contemptuous prejudice” quadrant of the SCM (Fiske et al., 2002b) and were labeled Moderate Contemptuous Prejudice and Very Contemptuous Prejudice, respectively, for ease of discussion. The second cluster fell within the “admiration” quadrant of the SCM (Fiske et al., 2002b) and Admiration was assigned to this cluster for ease of discussion. The distance between the centers of Cluster 1 and Cluster 2 was 1.35, between Cluster 1 and Cluster 3 was 1.41, and between Cluster 2 and Cluster 3 was 2.70. Please see Figure 1 for a visual depiction of cluster membership.

Visual depiction of cluster centers of warmth and competence.
Last, we ran a one-way analysis of variance (ANOVA) to confirm if the cluster centers of warmth and competence significantly differed between clusters. Results showed significant differences between clusters on warmth, F(2, 132) = 169.92, p < .0001, and competence, F(2, 133) = 109.83, p < .0001. Post hoc comparisons using Tukey’s B indicated that there were significant differences between all clusters on measures of both warmth and competence (means and standard deviations reported above).
Aim 2: Emotions, Status, and Competition
To address our second aim, we examined the individual emotions elicited for each cluster to assess the consistency between our resulting clusters and emotional responses toward the target (i.e., mothers of CSA victims) as predicted by the SCM. Consistent with Fiske and colleagues (2002b), we considered mean emotion ratings of three and above to be strong/high, and those below two to be low. As shown in Table 1, both the contemptuous prejudice clusters responded to the mother with strong feelings of anger and disgust.
Means and Standard Deviations of Cluster Differences in Stereotype Content Model Ratings.

A one-way multivariate analysis of variance (MANOVA) was conducted to determine if the three clusters differed on six prejudice variables (contempt, disgust, anger, resentment, pride, and admiration), and four status/competition variables (education, economic success, special breaks, and taking resources away) which Fiske and colleagues (2002b) identified as being particularly relevant for differentiating clusters. Box’s M test was statistically significant suggesting that the assumption of equality of variance–covariances was violated, F = 1.60, p < .001. For this reason, Pillai’s Trace was reported. Pillai’s Trace was statistically significant, V = .523, F (20, 240) = 4.25, p < .000, which suggests that between the three clusters, there is an overall difference on the 10 variables.
The test of between subjects effects indicated significant differences between clusters on feelings of admiration, F(2, 131) = 7.37, p < .001, η2 =.102; disgust, F(2, 130) = 10.83, p < .001, η2 = .143; anger, F(2, 130) = 11.01, p < .001, η2 = .145; and pride, F(1, 130) = 8.82, p < .001, η2 = .12. There were also significant differences between clusters on the status variables of belief in the education level of the mother, F(2, 131) = 38.78, p < .001, η2 = .378 and in her economic success, F(2, 131) = 31.42, p < .001, η2 = .329, but no significant difference on the competition variables of special breaks and taking of resources. Post hoc tests were conducted to determine where these differences were. To protect against Type 1 error, we used a traditional Bonferroni procedure. Levene’s test of equality of variances was statistically significant for the admiration and pride, and special breaks variables, indicating that the assumption of equality of variances was violated, thus, Dunnet’s T3 was interpreted for these three variables. Specifically, there were significant differences between the Admiration cluster and the Very Contemptuous cluster in belief in the education level of the mother (p < .001) and in her economic success (p < .001), feelings of admiration (p < .001), feelings of disgust (p < .001), anger (p < .001), and pride (p < .001). There were also significant differences between the Admiration cluster and the Moderate Contemptuous cluster in belief in the education level of the mother (p < .001) and in her economic success (p < .001), as well as differences between feelings of disgust (p = .017) and anger (p =.042). Last, we found significant differences between the Moderate Contemptuous cluster and the Very Contemptuous cluster in belief in the education level of the mother (p < .001) and in her economic success (p < .001), as well as feelings of disgust (p = .046), anger (p = .010), and pride (p < .001).
Aim 3: SCM Clusters and Mother Fault
First, one-sample t tests were conducted to determine if participants (regardless of cluster) assigned statistically significant levels of mother fault (i.e., if levels of assigned fault were significantly different from zero). Significant levels of blame, t(134) = 23.20, p ⩽ .001; responsibility, t(134) = 25.38, p ⩽ .001; cause, t(135) = 25.21, p ⩽ .001; prevention, t(134) = 28.90, p ⩽ .001; and total mother fault, t(135) = 30.45, p ⩽ .001, were found. (See Table 2 for variable means and standard deviations).
Cluster Means and Standard Deviations on Mother Fault Subscales and Total Score.
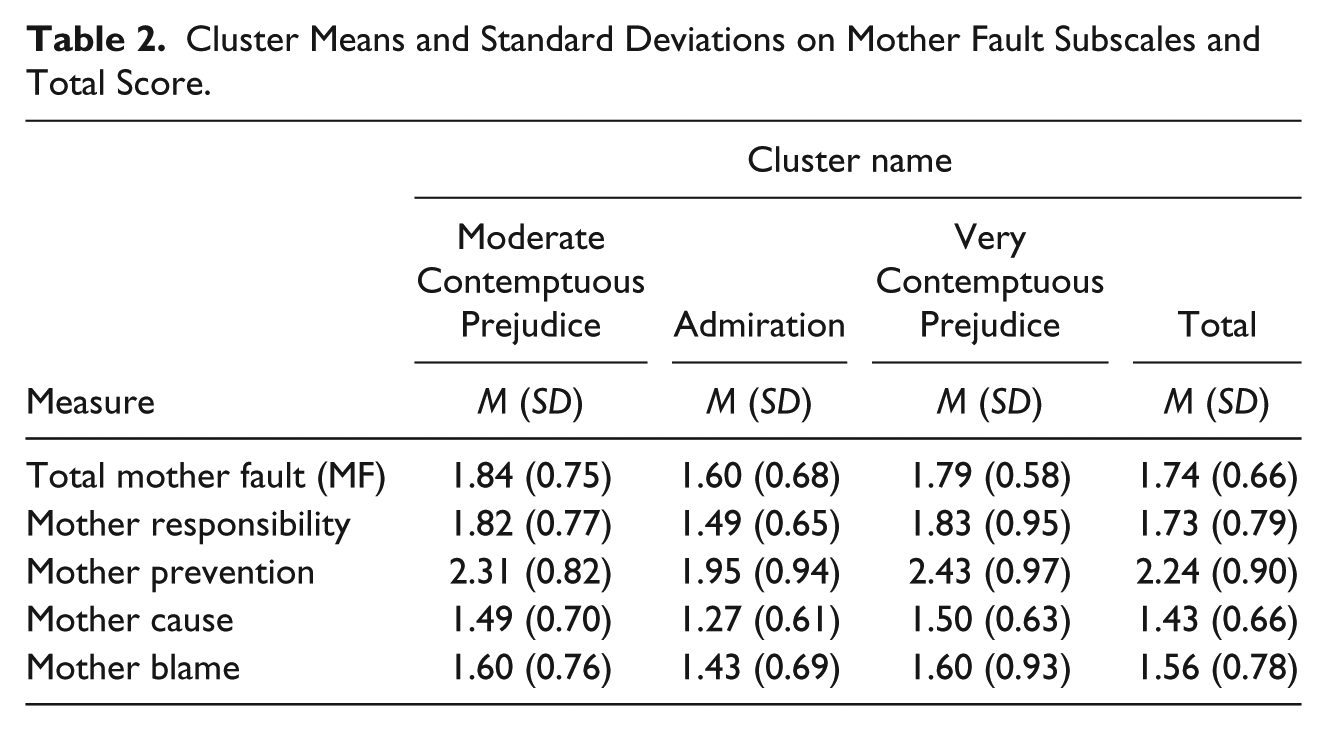
Next, a one-way MANOVA was conducted to determine if the three clusters differed on the four mother fault variables (responsibility, blame, cause, and prevention). Box’s M test was statistically nonsignificant suggesting that the assumption of equality of variance–covariances was not violated, F = 1.16, p = .276. Pillai’s Trace was not statistically significant, V = .062, F (8, 260) = 1.043, p =.404. As no multivariate effect was identified, further testing was not performed. A one-way ANOVA was then performed on the mother fault scale, which combines the four aforementioned variables. This was also nonsignificant, F(2, 133) = 2.63, p = .076.
Discussion
The purpose of this study was, overall, to examine the appropriateness of using the SCM as a theoretical framework for fault assigned to nonoffending mothers of CSA victims. Previous research has found that participants assign such fault for a plethora of reasons, but this area lacks a coherent theoretical model to explain and predict mother fault. We believed the SCM might be one such model. Specifically, we expected participants to fall into multiple clusters on the warmth/competence grid postulated by the SCM and for these clusters to be differentiated by their ratings of emotion, status, and competition assigned to the nonoffending mother. We expected no differences between clusters in terms of mother fault, consistent with previous research indicating that fault is assigned for a wide variety of reasons. Generally, our hypotheses were supported: participants were sorted into multiple clusters that were differentiated on ratings of emotion, status, and competition. No differences in levels of mother fault between clusters were noted. We discuss our results here by aim and conclude by discussing the implications of our results, strengths, and limitations of our study, and important areas for further research.
Aim 1: Cluster Sorting of Participants
We found that participants’ responses were sorted into three distinct clusters that varied as to the stereotypes they held toward mothers of CSA victims. Our results showed that two clusters of participants rated the mother as low on warmth and low on competence (Moderate Contemptuous Prejudice and Very Contemptuous Prejudice, respectively). The third cluster of participants rated the mother as having high warmth and moderate competence (Admiration).
These results suggest that feelings toward mothers of CSA victims are nuanced; within a sample, as hypothesized, people will differ in the stereotypes that they attribute to this subgroup of mothers and thus fall into different locations of the SCM. The majority of our sample (i.e., 73% of participants) fell within the Contemptuous prejudice group. This high rate of negative prejudice toward mothers was expected, given previous mother fault research, which shows that others are blamed for CSA due to perceptions the mothers did not spend enough time with their child (i.e., low warmth), perceptions that she did not meet her child’s needs (i.e., low competence as a mother; Toews et al., 2019), and general hostility toward mothers of CSA victims (Jackson & Mannix, 2004). Research also shows that university students hold negative attitudes toward mothers when they are seen as not committed to their parental role (e.g., when employed; Bridges & Etaugh, 1995), which might help to explain what is driving this high rate of negativity toward mothers of CSA victims. However, research into this area is limited, and it is still unclear whether mothers are generally rated negatively, or whether it is this addition of CSA (or other variables such as employment status) that might account for the negative perceptions. This is an important area for future research, which is discussed in the implications section. In addition, given that participants in some previous research did not harbor negative feelings toward the mother and rather saw the abuse as something out of her control (Zagrodney & Cummings, 2020), it makes sense that some participants’ views placed them within the Admiration cluster.
Interestingly, no participants were sorted into what Fiske and colleagues refer to as “mixed-clusters” such as Paternalistic Prejudice (high warmth/low competence) or Envious Prejudice (low warmth/high competence). This lack of mixed clusters is interesting in light of Fiske and colleauges’ (2002b) findings that most, if not all, female subtypes fall into mixed clusters of stereotypes (Cuddy et al., 2004; Eckes, 2002; Fiske et al., 2002b; Fiske et al., 1999) and in the only previous study applying the SCM to mothers, participants viewed working mothers with Envious Prejudice (low warmth/high competence; Cuddy et al., 2004). It was also surprising that no participants fell into the Envious Prejudice category (low warmth/high competence). However, previous research has shown that participants are likely to assign fault to mothers who are outside the home when CSA occurs, even if they are gone due to reasons that could be viewed as highly competent, such as attending work or running errands that directly benefit the family (e.g., getting groceries). It is possible that CSA precludes being seen as competent. That is, perhaps mothers of CSA victims are automatically seen as incompetent because CSA has occurred.
Aim 2: Differences in Emotions Between Clusters
As hypothesized by the SCM, our results support the idea that certain stereotypic emotions or feelings that the mother elicits in participants can help to understand how participants might conceptualize the mother. In line with Fiske and colleagues (2002b), both the contemptuous prejudice clusters displayed feelings of anger and disgust toward the mother. As would be predicted by their quadrant locations, the Very Contemptuous Prejudice cluster did rate their anger and disgust reactions and significantly stronger as compared to the Moderate Contemptuous Prejudice cluster. Theoretically, Fiske and colleagues (2002b) note that anger may be directed toward those with negative outcomes that people perceive as avoidable (Zucker & Weiner, 1993). Previous research on mother fault for CSA supports this explanation: Participants in studies examining attributions for mother fault report multiple ways mothers could have avoided CSA including staying home with their child, not trusting certain care providers, always taking the child with them (precluding the need for child care), and limiting personal activities (Toews et al., 2019).
Participants in the Admiration cluster perceived the mother as more well educated and economically successful (i.e., high status) than both contemptuous prejudice groups. Interesting differences emerged between the two contemptuous prejudice clusters on these variables, considering that they fell within the same SCM quadrant. That is, the Moderate Contemptuous prejudice cluster rated the mother as more well educated and economically successful than the Very Contemptuous Cluster, but both clusters rated the mother as low using Fiske and colleagues’ (2002b) cutoff of three. It is important to note that all of these results are as predicted by the SCM, lending further credence to the application of the SCM to mothers of CSA victims as a target subgroup.
Aim 3: Clusters and Mother Fault
Consistent with our hypothesis, cluster was neither a significant predictor of the four mother fault variables (i.e., responsibility, blame, cause, and prevention) nor the overall total mother fault score, despite the fact that participants overall did assign statistically significant levels of all five forms of fault to the mother. Together, these findings lend support for the notion that mother fault is assigned for a range of reasons and that the SCM is a useful framework for understanding these ratings (i.e., by clustering participants into different stereotype content quadrants). Despite the discrepancy between the cluster’s ratings of the mother’s competence and warmth, all three clusters attributed statistically similar levels of fault toward the mother, as well as showed similar beliefs in changes in blame, and ratings of mother characteristics, again indicating the nuanced nature of mother fault attributions.
Implications
Applied
Investigating the stereotypes attributed to mothers of CSA victims is important for a variety of reasons. First, understanding the stereotype content and emotional responses toward different groups is incredibly important for elucidating what people think about others, as opposed to how and why they think these things (Operanio & Fiske, 2001). In addition, Weiner (1980) noted that “attributions guide our feelings, but emotional reactions provide the motor and direction for behavior” (p. 186). Thus, the emotions and reactions that we identified in this study could provide crucial insight into what is driving people’s behaviors toward these mothers. Furthermore, previous research shows mother blame occurs in the social and judicial spheres (Davies & Krane, 1996; Dietz & Craft, 1980; Fong & Walsh-Bowers, 1998; Ford et al., 2001; Harding et al., 2010; Reidy & Hochstadt, 1993). Investigating the stereotypes surrounding this subgroup of women can have various implications for assisting professional groups in assessing their biases, and working toward more inclusive, and less-discriminatory responses to these mothers and their children. That is, understanding in more detail the content that these stereotypes consist of (i.e., warmth, competence, and associated emotions and views on success), and that they can consist of different components for different people, can help us to understand what underpins stereotypes and the assignment of fault and better intervene to decrease it. Once something is understood through a theoretical framework, it is then possible to hypothesize about how to change what is, to what should be (Bunch, 1983). Finally, our results suggest that when CSA occurs, mothers might automatically be viewed as incompetent. However, it is unclear whether this belief in their incompetence is because their child was sexually abused, or whether people just generally have a negative evaluation of mothers. It would be beneficial if researchers further investigated this area, perhaps through the use of vignettes, to tease apart the influence of CSA on these negative evaluations of mothers. This belief in the incompetence of mothers could help to explain rates of removals of sexually abused children from their families, and the general hostile treatment of mothers by many professionals (Jackson & Mannix, 2004).
Strengths/Limitations
This is the first study of our knowledge to apply the SCM toward mothers of sexually abused children. This provides a crucial step toward understanding how stereotypes and emotions might influence individuals’ attributions of mother fault. It can be particularly helpful at understanding why, at the broad level, participants have been shown to assign mother fault whereas closer examination reveals contradictory explanations for that fault. The use of cluster analysis in an initial, exploratory investigation of this subgroup of women allowed for the nuanced nature of stereotype content to appear.
However, some limitations of this study must also be noted. For one, the vignette used in our study was purposefully vague regarding a number of variables that could have influenced mother fault including the victim’s age, the mother’s marital status, the role of any potential father figures, and details regarding the mother’s whereabouts. We chose this vagueness to attempt to reduce as many confounds as possible. However, many of these variables have been shown to influence mother fault (Back & Lips, 1998; Zagrodney & Cummings, 2016, 2020). For example, greater responsibility has been assigned to nonoffending parents when the child victim was younger (Back & Lips, 1998), single mothers are sometimes held at fault more than married mothers (or sometimes this relation is reversed; Toews et al., 2019), and nonbiological father perpetrators have been shown to result in more fault assigned to the nonoffending mother (Zagrodney & Cummings, 2016). Including such details in the vignette to assess how they influence such attributions is an important next step for this area of research.
Second, the SCM has been critiqued as being unable to theoretically explain the large amount of shared variance among the competence and warmth dimensions (Sayans-Jiménez, Cuadrado, Rojas, & Barrada, 2017). Thus, other models have been proposed to access the specific content of each dimension (as opposed to the content shared among dimensions; Sayans-Jiménez et al., 2017). Utilizing these models in future research would thus be beneficial to further our understanding of mother fault and CSA. In addition, our sample was primarily Caucasian, female, and in university, so our sample was limited in diversity and inclusiveness. However, there is some research that suggests that there are strengths to using a university student sample. Using university student samples provides an opportunity for enhanced research validity because of the homogeneity of the sample (Peterson & Merunka, 2014). In addition, studying undergraduate students provides us with crucial insight into the attitudes that these future professionals hold. In the 2013-2014 school year, there were 522,795 undergraduate students enrolled in social and behavioral sciences, law, and health related fields across Canada (Statistics Canada, 2015). These individuals are the future lawyers, psychologists, and doctors that will be interacting with vulnerable populations, such as families affected by CSA. Overall, investigating undergraduate students with the understanding that they are the future services providers for this population is an added strength.
Diversity
It is also important to note that the lack of diversity in our study can also be considered a limitation. For example, because our study was comprised of very few parents, our sample’s homogeneity might not overcome the fact that primarily nonparents make up the sample, and thus might rate mother fault very differently than parents. For example, according to defensive-attribution theory (Shaver, 1970), individuals who perceive themselves as personally similar, compared to personally dissimilar, to the mother, might assign less responsibility to that individual. In addition, given the homogeneous ethnic makeup of our sample, we must recognize that both stereotypes (Choi, Nisbett, & Norenzayan, 1999; Cuddy et al., 2009; Glick et al., 2000; Norenzayan, Choi, & Nisbett, 2002) and mother blame (Alaggia, 2002; Koniak-Griffin, Logsdon, Hines-Martin, & Turner, 2006; Walls & Wong-Wylie, 2007) are culturally bound and culturally constructed phenomena and thus our findings might not appropriately generalize across cultures. For these reasons, our results should be interpreted cautiously and further research should be conducted into mother blame and SCM perceptions in more diverse samples.
Future Directions
A number of recommendations for future research directions arise from our study. First, it will be important for additional research to attempt to replicate these findings to further assess the validity of the SCM as a model of mother fault. Consistent with previous research, participants assigned significant levels of fault to the mother in the vignette although those overall levels of fault were low. Surprisingly, this included participants who were located in the Admiration cluster. These low but significant ratings and fault assigned from a group who considers the mother competent, warm, and high status indicate that further research is still required to understand why fault is assigned in scenarios where participants identify with the mother (i.e., are in the Admiration cluster). It is likely that qualitative methods would best assess these nuanced results. Third, research is slowly moving toward investigating the contribution of fathers in the child care sphere, including some examination of father fault for CSA (Zagrodney & Cummings, 2021), thus future research would benefit from considering the stereotype content of fathers of CSA victims. Finally, research should endeavor toward more breadth of sampling, such as community, professional, parent, and ethnically diverse samples, to further understand the stereotypes attributed to this subgroup of mothers.
Conclusion
The results of this study showed that stereotypes held toward mothers of CSA victims are nuanced, as hypothesized; our sample diverged into three categories of beliefs surrounding the mother’s warmth and competence, but still assigned fault to mothers for the CSA of her child. Each cluster held specific beliefs and emotions about the mother, many which differ significantly between clusters. This provides important initial insight into the beliefs that may be driving people’s blame and behaviors toward these mothers (e.g., a priori beliefs about education and competence), indicating that the SCM is a theoretical model that can account for previous contradictory findings.
Footnotes
Appendix
Declaration of Conflicting Interests
The author(s) declared no potential conflicts of interest with respect to the research, authorship, and/or publication of this article.
Funding
The author(s) disclosed receipt of the following financial support for the research, authorship, and/or publication of this article: This project was supported by a Saskatchewan Health Research Foundation Establishment Grant and Social Science & Humanities Research Council Insight Development Grant, both awarded to Jorden A. Cummings.