



Abstract
Within a lifetime, one in four women and more than one in 10 men will experience intimate partner violence (IPV). Researchers have begun to examine physical and social neighborhood risk factors of IPV, often using cross-sectional data. Most studies focus on risk or promotive factors. Often, neighborhood factors are studied through the lens of social disorganization theory, which focuses on how a neighborhood slips into a violent and crime-ridden place. Busy streets theory provides an alternative perspective, focusing on how building up community assets and resources may help create a safe and vibrant neighborhood. A conceptual approach that utilizes risk and promotive neighborhood variables may help develop new conceptual frameworks for understanding how context may decrease risk for, or moderate, the negative consequences of IPV. Using five waves of data from a 24-year longitudinal study, we employ multilevel linear regression models to examine the trajectory of IPV experiences in relation to positive perceptions of neighborhood, neighborhood cohesion, and informal social control in individuals aged 28 to 33 years. We control for the neighborhood and individual-level risk factors of alcohol consumption, drug use, observed neighborhood violence, and demographic factors of age, race, sex, and socioeconomic status. We found that positive perceptions of neighborhood, alcohol consumption, drug use, economic need, and observed neighborhood violence are associated with IPV. Levels of IPV risk were relatively constant within individuals across waves, but varied significantly between individuals. The measure of positive perceptions of neighborhood is derived from busy streets theory, which may be a useful conceptual framework for understanding how neighborhoods may contribute to positive social contexts that can protect residents from IPV experiences, and potentially other violent behavior. Additional research examining promotive social neighborhood features derived from busy streets theory may help expand our understanding of contextual factors that affect IPV.
Overview
One in four women and one in 10 men will experience intimate partner violence (IPV) at least once during their lifetime (Breiding et al., 2014), resulting in a greater risk of other negative health outcomes, including physical injury, poorer sexual health, and negative psychological outcomes (Capaldi et al., 2012). For decades, the field of IPV focused on individual-level factors, finding variables such as low socioeconomic status or higher alcohol use to be associated with IPV victimization risk. In addition, most of the existing IPV research is cross sectional, which limits our understanding about how changes over time in risk exposure may influence IPV consequences (Capaldi et al., 2012). Researchers are starting to focus more attention on trajectories of IPV, and understanding the complex interplay between individual factors and other levels of the socioecological model (Bronfenbrenner, 1994), such as relationship (i.e., partner/perpetrator factors) and community-level (neighborhood) factors (Beyer et al., 2015).
Researchers have found negative physical neighborhood features such as blight, and social features such as poverty level to be associated with greater levels of violence (Branas et al., 2018; Heinze et al., 2018), including IPV (Caetano et al., 2010; Cunradi et al., 2000; Dekeseredy et al., 2003; Frye, 2007; Jain et al., 2010; Pickover et al., 2018; Wright & Skubak Tillyer, 2017). However, this work is limited in that it largely explores neighborhood factors through the lens of social disorganization theory, which postulates that physical indications of crime (such as a broken window) left untreated can lead to more crime within the community (Sampson et al., 1997). Although social disorganization theory is useful for understanding neighborhood risk factors, multiple researchers have suggested that it does not fully capture the complexity of neighborhood contextual factors (Beyer et al., 2015; Pinchevsky & Wright, 2012). Busy streets theory provides an approach to understanding positive neighborhood factors that promote safety and positive social interactions (Aiyer et al., 2015). Busy streets theory emphasizes positive contextual factors that promote neighborhood safety, social cohesion, trust in neighbors, and positive perceptions of one’s neighborhood. As neighborhood factors may explain more variation in IPV experiences than any one individual factor, it is important to understand both potential risk (e.g., poverty) and promotive (e.g., social cohesion) neighborhood factors when trying to understand individual experiences of IPV.
Our study of neighborhood factors associated with IPV risk fills two critical gaps in the research literature on this topic. First, we consider the neighborhood through social disorganization theory and busy streets theory, including both promotive and risk factors within our analyses. This approach incorporates positive factors that may help victims overcome the noxious effects of IPV. This is especially useful because it may inform both primary and secondary prevention efforts designed to build resources instead of solely focusing on reducing risk factors. Second, our study is longitudinal. We investigate individual and perceived neighborhood factors and experiences of adult IPV victimization across five waves of data. This allows us to examine how the trajectory of IPV experience differs across time for adults aged 28 to 33 years. By examining differing trajectories and neighborhood experiences relative to IPV, we can better understand the potential promotive and risk factors relative to IPV experiences in this specific age range.
Background
Neighborhood-Level Factors
Researchers have postulated that IPV is a complex phenomenon, influenced by individual, situational, and contextual (sociocultural) factors (Heise, 1998). To better understand the complexity of factors that influence IPV experiences, in recent years researchers have begun to examine other levels of the ecological model, including neighborhood and community-level factors (Beyer et al., 2015). Researchers have found positive associations between social disorder, witnessing community violence, census-track poverty level, and experiences of IPV (Benson et al., 2003; Cunradi et al., 2000; Dekeseredy et al., 2003; Raghavan et al., 2006, 2009; Stueve & O’Donnell, 2008). One limitation to the existing literature is that many studies have been cross sectional (Beyer et al., 2015). Another growing concern is that most of the existing studies are guided by social disorganization theory (Beyer et al., 2015; Voith, 2019), which focuses on negative physical environment factors (e.g., broken windows, blight, abandoned houses) associated with harmful social risks including crime and violence (Sampson et al., 1997). Yet, the absence of risk factors, such as those that define social disorganization theory, is not equivalent to the presence of positive (or promotive) neighborhood factors, such as neighborhood cohesion, residents’ monitoring behavior, or positive attitudes about neighbors.
Several researchers have reported on individual promotive neighborhood factors and violence (IPV or more general violence) outcomes. Browning (2002) found that stronger neighbor ties were related to less IPV victimization in their study of women. Obasaju et al. (2009) examined social cohesion and IPV victimization in a sample of African American women with a history of child abuse who had children aged 8 to 12 years who sought treatment at a public hospital. They found neighborhood cohesion reduced the positive association between childhood emotional abuse and adult physical IPV (Obasaju et al., 2009). These findings support other researchers who have found collective efficacy to be inversely associated with individual- and neighborhood-level violent behavior (Frye, 2007; Sampson & Jeffrey, 2004). Researchers have also postulated that social cohesion/trust and informal social control influence perceived quality of interpersonal relationships within neighborhoods (Browning, 2002; Dekeseredy et al., 2003; Frye, 2007; Obasaju et al., 2009). One theory that encompasses these neighborhood promotive factors is busy streets theory, which has at this point not been applied to IPV research.
Examining IPV risk through the lens of busy streets theory focuses attention on promotive neighborhood factors and community empowerment (Aiyer et al., 2015; Zimmerman, 2000) that may expand our understanding of how neighborhoods may influence IPV risk. Examining neighborhood attitudes, social cohesion/trust, informal social control and risk factors such as observed neighborhood violence with experiences of IPV would help us understand how risk and promotive factors relate to each other for predicting experiences of IPV. This is a useful direction for IPV research because it can help inform prevention strategies that enhance promotive factors instead of focusing solely on reducing risk when tends to be driven by fixing what is wrong versus improving factors that may help protect against IPV risk and promotive factors can coexist, and likely influence IPV and other behaviors in different ways, but few researchers have examined them concurrently.
Individual-Level Factors
Over the past 30 years, researchers in the field of IPV have learned a lot about individual-level risk factors for IPV victimization. The wealth of research on individual IPV-risk factors has yielded a set of known risk factors, including individual and/or partner alcohol consumption, individual drug use, and relationship status (Capaldi et al., 2012; Devries et al., 2014; Nowotny & Graves, 2013). These individual-level known risk factors are thus important to control for in the study of IPV. Demographic factors including gender, race, and socioeconomic status have been utilized as controls, although some researchers are beginning to examine demographic factors as predictor variables (Capaldi et al., 2012). In particular, the trajectory of IPV experiences across age and developmental stages has been of growing interest to researchers because of fluidity of the human experience (W. L. Johnson et al., 2015).
Age is another important individual-level variable to account for. In neighborhood-focused analyses, researchers often utilize a wide age range. Yet, researchers have found age to be associated with differential social constructions and beliefs about the acceptability of IPV (Simon et al., 2001) and rate of IPV disclosure to formal or informal supports such as neighbors (Barrett & St. Pierre, 2011; Yoshioka et al., 2003). When used as a control, several researchers have found age to be inversely associated with aggression toward a partner and use of violence in marital conflict (Kim et al., 2008; Rodriguez et al., 2001). Yet, in their study of adult experiences of IPV, Rodriguez et al. (2001) found that the average age of reporting violence during arguments was 33 years, suggesting this might be a critical period to examine. Few researchers have examined the consistency or fluidity of the experience of IPV across a given set of years. For example, a person may consistently experience IPV each year, or they might experience it one year but the next one they do not. In an examination of the age–IPV curve from age 13 to 28 years, researchers found that contrary to the age–crime curve (where crime decreases as individuals grow older), women reported increased IPV perpetration across time despite their involvement in other antisocial behaviors decreasing, when controlling for other known risk factors including alcohol, drug use, delinquency, and depressive symptoms (W. L. Johnson et al., 2015). Despite the general assumption that IPV peaks in early adulthood, additional empirical prospective longitudinal investigation is needed to better understand age and IPV trends. In addition, researchers who have focused on IPV experience across age have largely focused on individual-level factors, and thus little is known about other contextual factors that may affect IPV experiences across age or developmental stages.
We aim to fill an existing research gap by examining IPV experiences of men and women in their late 20s through early 30s in relation to the potential promotive neighborhood factors of neighborhood attitudes, neighborhood cohesion/trust, and informal social control over four waves of a 20-year longitudinal study. We study the association of perceived positive neighborhood with IPV experiences over time relative to known factors associated with IPV, including age (Banyard et al., 2006; McCloskey & Lichter, 2003), gender, race (Boivin et al., 2012; Connolly et al., 2010; Foshee et al., 2001, 2010), socioeconomic status (Capaldi et al., 2012), relationship status (Cunradi et al., 2002), alcohol consumption (Capaldi et al., 2012; Devries et al., 2014), drug use (Capaldi et al., 2012), and observed violence. We also examine whether risk of IPV changes over the five waves of data collection when participants are 28 to 33 years old. We hypothesize that risk of IPV experiences may vary across time within person, and that higher levels of promotive neighborhood factors will be associated with fewer experiences of IPV.
Method
Data
This study utilizes a set of data from the Flint Adolescent Study (FAS), a 16-wave longitudinal study that began following ninth-grade youth (Wave 1: 1994; Wave 16: 2018; http://prc.sph.umich.edu/projects/flint-adolescent-study/). The initial sample (n = 850) was composed of adolescents who were considered at high-risk of dropping out of school before attaining their high school diploma. The study sample was drawn from public high school attending adolescents who had less education (defined as a grade point average of 3.0 or less), were identified by the school as not having any diagnosed emotional or developmental impairments, and who self-identified as African American, White, or biracial (African American and White). The proportion of African American, White, and biracial students at Wave 1 was representative of the Flint High Schools in the fall of 1994. Data were collected through in-person interviews followed by self-administered paper and pencil questionnaires on sensitive information including substance use and intimate partner violence. Interviews were conducted by trained interviewers and initially occurred in the school setting and later in the home or a private setting in a community organization.
Sample
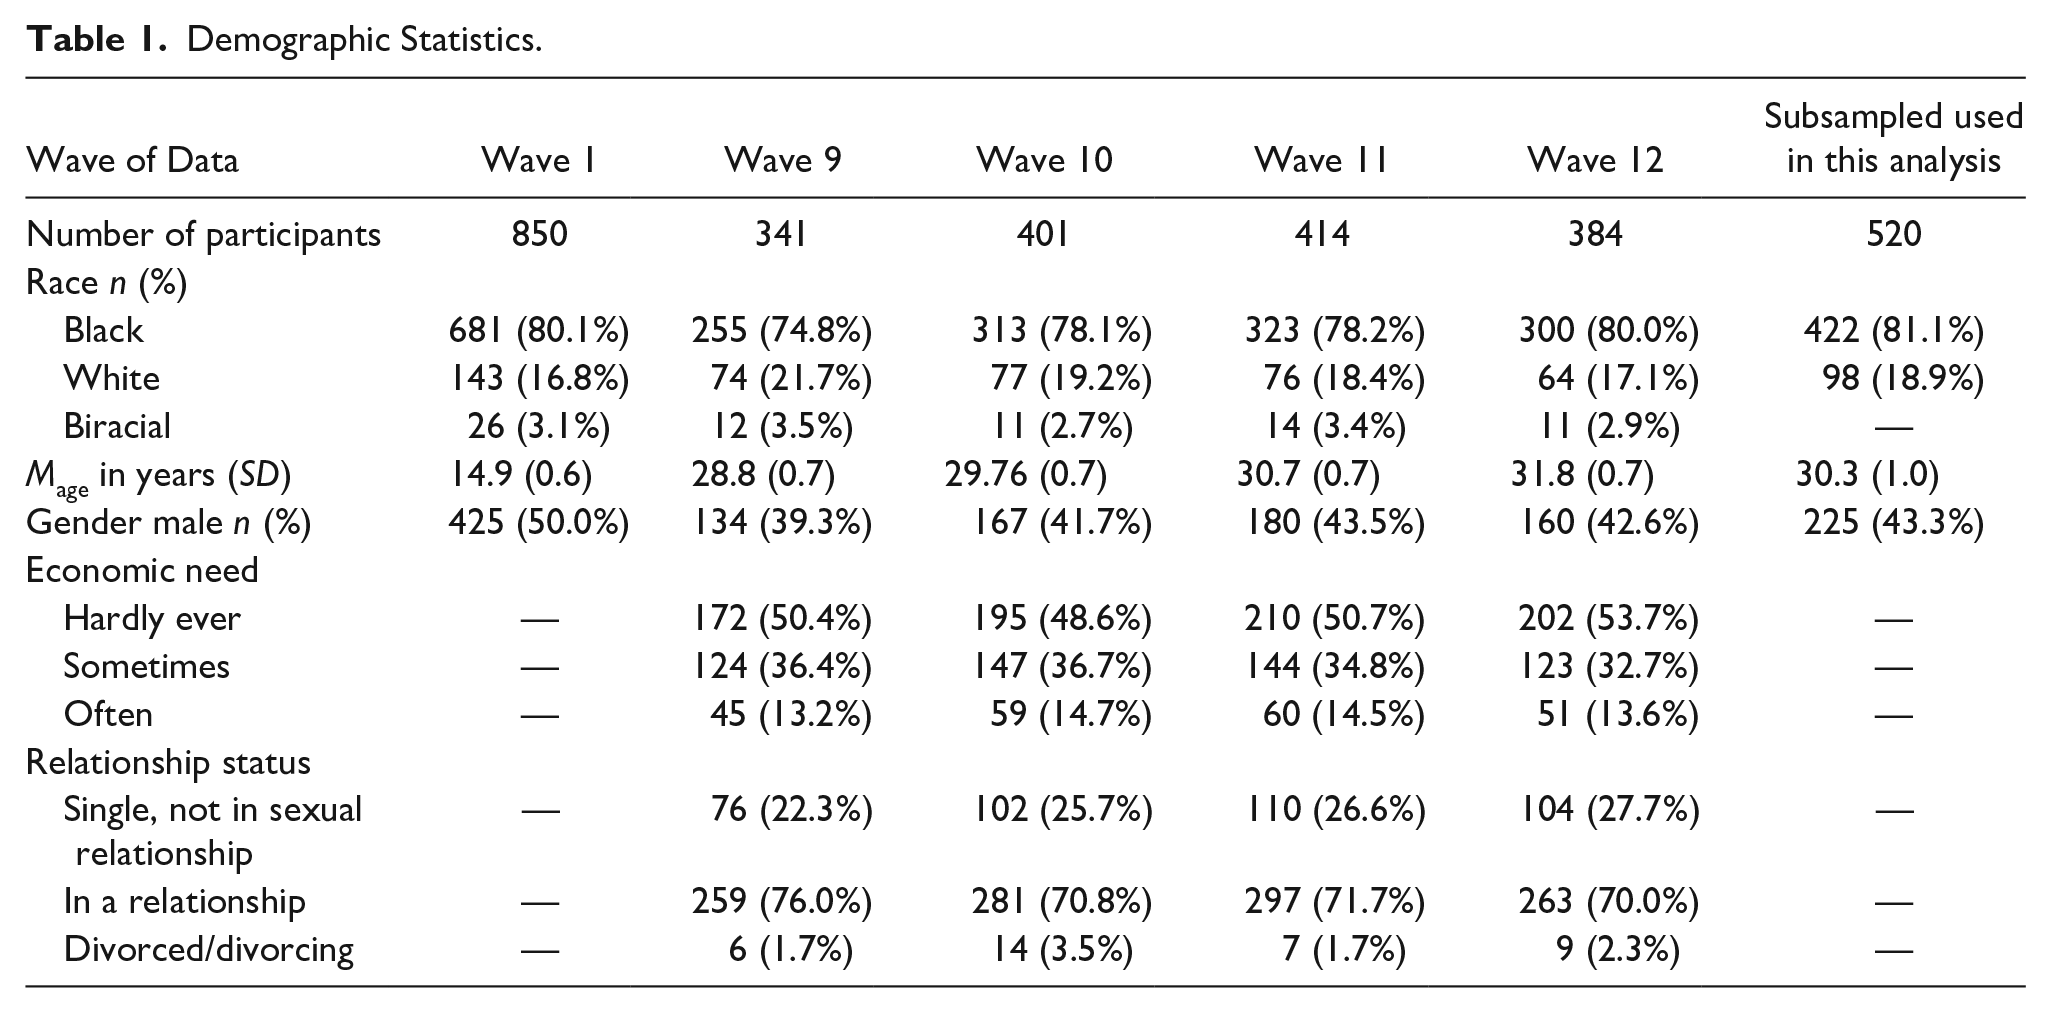
Of the 850 individuals who participated in Wave 1, 50% were female, and 80% identified as African American. Table 1 provides demographic characteristics of the sample across all five waves included in the study. We utilize demographic data from Wave 1 and concurrent perceived neighborhood, drug and alcohol, and intimate partner violence data from Waves 9 to 12, when participants were 28 to 33 years old. We focus on Waves 9 to 12 as these waves were the first set in which data on IPV was collected, and they represent 4 consecutive years (2004–2008). A total of 543 individuals participated across Waves 9 to 12. These individuals demonstrated similar demographic characteristics as the full sample. Of the 543, 17 were excluded from the analysis as they did not identify as Black or White (e.g., they identified as biracial). Of the 526 remaining, 520 (98.9%) had data for all variables used in analysis. Three participants had missing data for a demographic variable, and three participants had missing data for one neighborhood variable. These six observations were dropped from all analyses. Of the 520 participants included in the final model, 16.9% (n = 88) participated in one wave of data collection, 21.2% (n = 110) participated in two waves, 25.0% (n = 130) participated in three waves, and 36.9% (n = 192) participated in all four waves of data collection.
Demographic Statistics.
All procedures were reviewed and approved by the Institutional Review Board at the University of Michigan.
Measures
Dependent variable: Intimate partner violence
We measured IPV with five binary (yes/no) items of experiences of physical, verbal, and sexual violence by any sexual partner in the past year. An exploratory factor analysis indicated moderate fit for a one factor solution (Hu & Bentler, 1999) (root mean square error of approximation [RMSEA] = 0.073, confidence interval [CI] = [0.065, 0.090]; comparative fit index [CFI] = 0.959, and Tucker–Lewis index [TLI] = 0.953), and a multiple indicator multiple cause (MIMIC) model yielded no differential function by sex. Therefore, individual items were summed ranging from 0 to 5. Thus, a value of 1.0 would indicate an a participant experienced one type of IPV in the past year.
Neighborhood factors
Positive perceptions of neighborhood
Positive neighborhood perception was measured with seven items asking about the relationships between neighbors and the respondent’s feelings about the safety of their neighborhood (Buckner, 1988). Four items asked about positive attributes, such as “I like living in my neighborhood” and “I believe my neighbors would help me in an emergency.” Three items asked about risk attributes, such as “I am afraid of the violence in my neighborhood” and “I worry that someone in my neighborhood will physical hurt me.” Participants indicated their level of agreement on a 4-point Likert-type scale (1 = strongly disagree; 4 = strongly agree). Items on risk were reverse scored. An average response for all items was created for each wave. The alpha coefficient for each wave ranged from .754 to .817, while intra-class correlation (IIC) ranged from .338 to .426.
Perceived neighbor social cohesion/trust
Neighbor social cohesion/trust was measured by six items asking respondents about neighbor relationships (Sampson et al., 1997). Four items were about positive neighborhood factors, such as “this is a close-knit neighborhood,” and “people around here are willing to help their neighbors.” Two items asked about negative relationship factors, including “people in this neighborhood generally don’t get along with each other” and “people in this neighborhood do not share the same values.” Participants responded their level of agreement on a 4-point Likert-type scale (1 = strongly disagree; 4 = strongly agree). The two negatively worded items were reverse scored. The average of the items per wave was calculated. The alpha coefficient for each wave ranged from .738 to .791, while IIC ranged from .287 to .351.
Perceived informal social control
Perceived informal social control was evaluated with five items asking if neighbors would say something if they observed a given risky activity was occurring. Participants indicated how likely they thought it was that people in your neighborhood would do something about a given item. Example items include: “some children who were spray painting graffiti on a building,” and “organizing to try to do something about a problem in their neighborhood.” Items used a 5-point Likert-type scale (1 = very unlikely; 5 = very likely) how. The average response across items was calculated for each wave of data collection, and ranged from 0 to 5. The alpha coefficient across waves ranged from .885 to .903, while IIC ranged from .607 to .650.
Covariates
Alcohol use
The measure of alcohol use was drawn from the longitudinal study on the behaviors, attitudes, and values of American adolescents, Monitoring the Future Study (L. D. Johnson et al., 2003). Participants indicated the frequency they used alcohol in the prior 30 days (0 = no times, 1 = 1–2 times, 2 = 3–5 times, 3 = 6–9 times, 4 = 10–19 times, 5 = 20–39 times, 6 = 40+ times).
Drug use
The measure of drug use was also drawn from the Monitoring the Future Study (L. D. Johnson et al., 2003). Participants indicated the frequency they used marijuana, and prescription drugs that were not prescribed to them in the prior 30 days (0 = no times, 1 = 1–2 times, 2 = 3–5 times, 3 = 6–9 times, 4 = 10–19 times, 5 = 20–39 times, 6 = 40+ times). A mean score of these two items was calculated for each wave, ranging from 0 to 6.
Observed violence
Observed violence included two items that assessed observations of violent behavior in their neighborhood. The participants reported the number of times they had “seen someone commit a violent crime where a person was hurt,” and “seen someone get shot, stabbed or beaten up” in the last 12 months (Richters & Saltzman, 1990). Participants responded the frequency on a scale range from 0 (0 times) to 4 (4 or more times). A mean score of these two items was calculated for each wave and was entered as a covariate in the analyses.
Relationship status
Relationship status was evaluated at Waves 9 to 12 by asking a series of questions regarding if the respondent was in a relationship, and if so what kind it was. For each wave, we included a three-category relationship status variable in our analysis: (a) single (not in a formal relationship), (b) in a relationship or married, and (c) divorced/divorcing. For individuals who indicated at one wave or more that they were single or divorced/divorcing, most indicated having no experience of IPV in the prior year, although a few (n_w9 = 5; n_w10 = 14; n_w11=13; n_w12=11) individuals indicated some level of IPV experience within the past year.
Demographic variables
The demographic variables of age, sex, race, and economic need were also entered as covariates. Participant age was calculated from the date of interview and the birthdate the participant provided in Wave 1. Sex was assessed at Wave 1 as biological sex (male or female). Self-identified race was assessed at Wave 1 either as African American, White, or mixed race. Given the small count of mixed race (n = 17; 3% of sample), analyses were restricted to individuals who identified as Black or White, and a dummy variable reflecting if the participant was Black was used in analyses. Economic status was evaluated based on participant’s economic need. 1 This was evaluated at Waves 9 to 12 (and thus was a time-varying covariate) with an item that asked about how often the participant felt that they had trouble securing basic needs (1 = hardly ever, 2 = sometimes, 3 = often).
Analysis
A longitudinal, multilevel mixed-effects linear regression model was utilized with random intercept and slope testing. This type of analysis allows for both fixed and random effects, which is useful to account for hierarchical structure of the data. This type of analysis approach is useful for several reasons. First, by examining random effects, we can see if risk changes across time within an individual, and if the change across time is different across individuals. This allows us to answer the question of whether the experience of IPV is fluid or constant within individuals. Multilevel models are also useful when utilizing longitudinal data where participation across waves varies, to be able to utilize data from participants who consistently participate in data collection (e.g., have data for all waves), and for participants who are missing from one or more waves. Thus, we can account for the clustering of data within a given person, but can utilize data from individuals who have missed one or more waves of data collection.
Model building was iterative and additive, meaning the first model presented (Model 0) is the most basic while the final model is the most complex. First, we test for random intercept relative to individual (person; Model 0). This tells us if the rate of IPV experiences is different across individuals. Next, we test for changes in intercept and slope over time (wave; Model 1). This tells us whether the rate of IPV changes over time. We compare the base model to the nested Models (0 and 1) using a likelihood ratio test (McNeish & Matta, 2018). Once we determined random effects variables, we added in fixed effect variables, starting with covariates and demographics (Model 2), then we individually examine the independent variables of interest, positive perceptions of neighborhood, neighborhood cohesion and informal social control (Models 3–5). Model 6 includes all neighborhood, covariate, and demographic factors. For model testing that did not examine nested versus nonnested (i.e., Models 3–6), we used Akaike information criterion (AIC) and Bayesian information criterion (BIC) statistics to evaluate fit. The model selection rule of thumb for AIC/BIC is to compare the difference in values between models for AIC/BIC respectively. A change of less than two points suggests no substantial difference between the models, 2 to 10 points suggesting a moderate superiority of the model with the smaller value, and greater than 10 suggesting excellent support for the model with the smaller value (Burnham & Anderson, 2004).
Results
Table 2 provides the mean, standard deviation, and range for all study variables. About 70% (n = 365) of participants reported no incidences of IPV in any wave of data collection, 22.3% (n = 116) reported IPV experiences in one wave of data collection, 5.2% (n = 27) reported IPV across two waves of data, and 2.31% (n = 12) reported IPV across three waves; no respondents reported IPV experiences across all four waves. Participants on average reported positive feelings about their neighborhood, and felt that neighbors would get involved if they witnessed issues in the neighborhood, such as kids spray painting graffiti. Participants reported more negative feelings about neighborhood cohesion.
Summary Statistics.

Note. IPV = intimate partner violence.
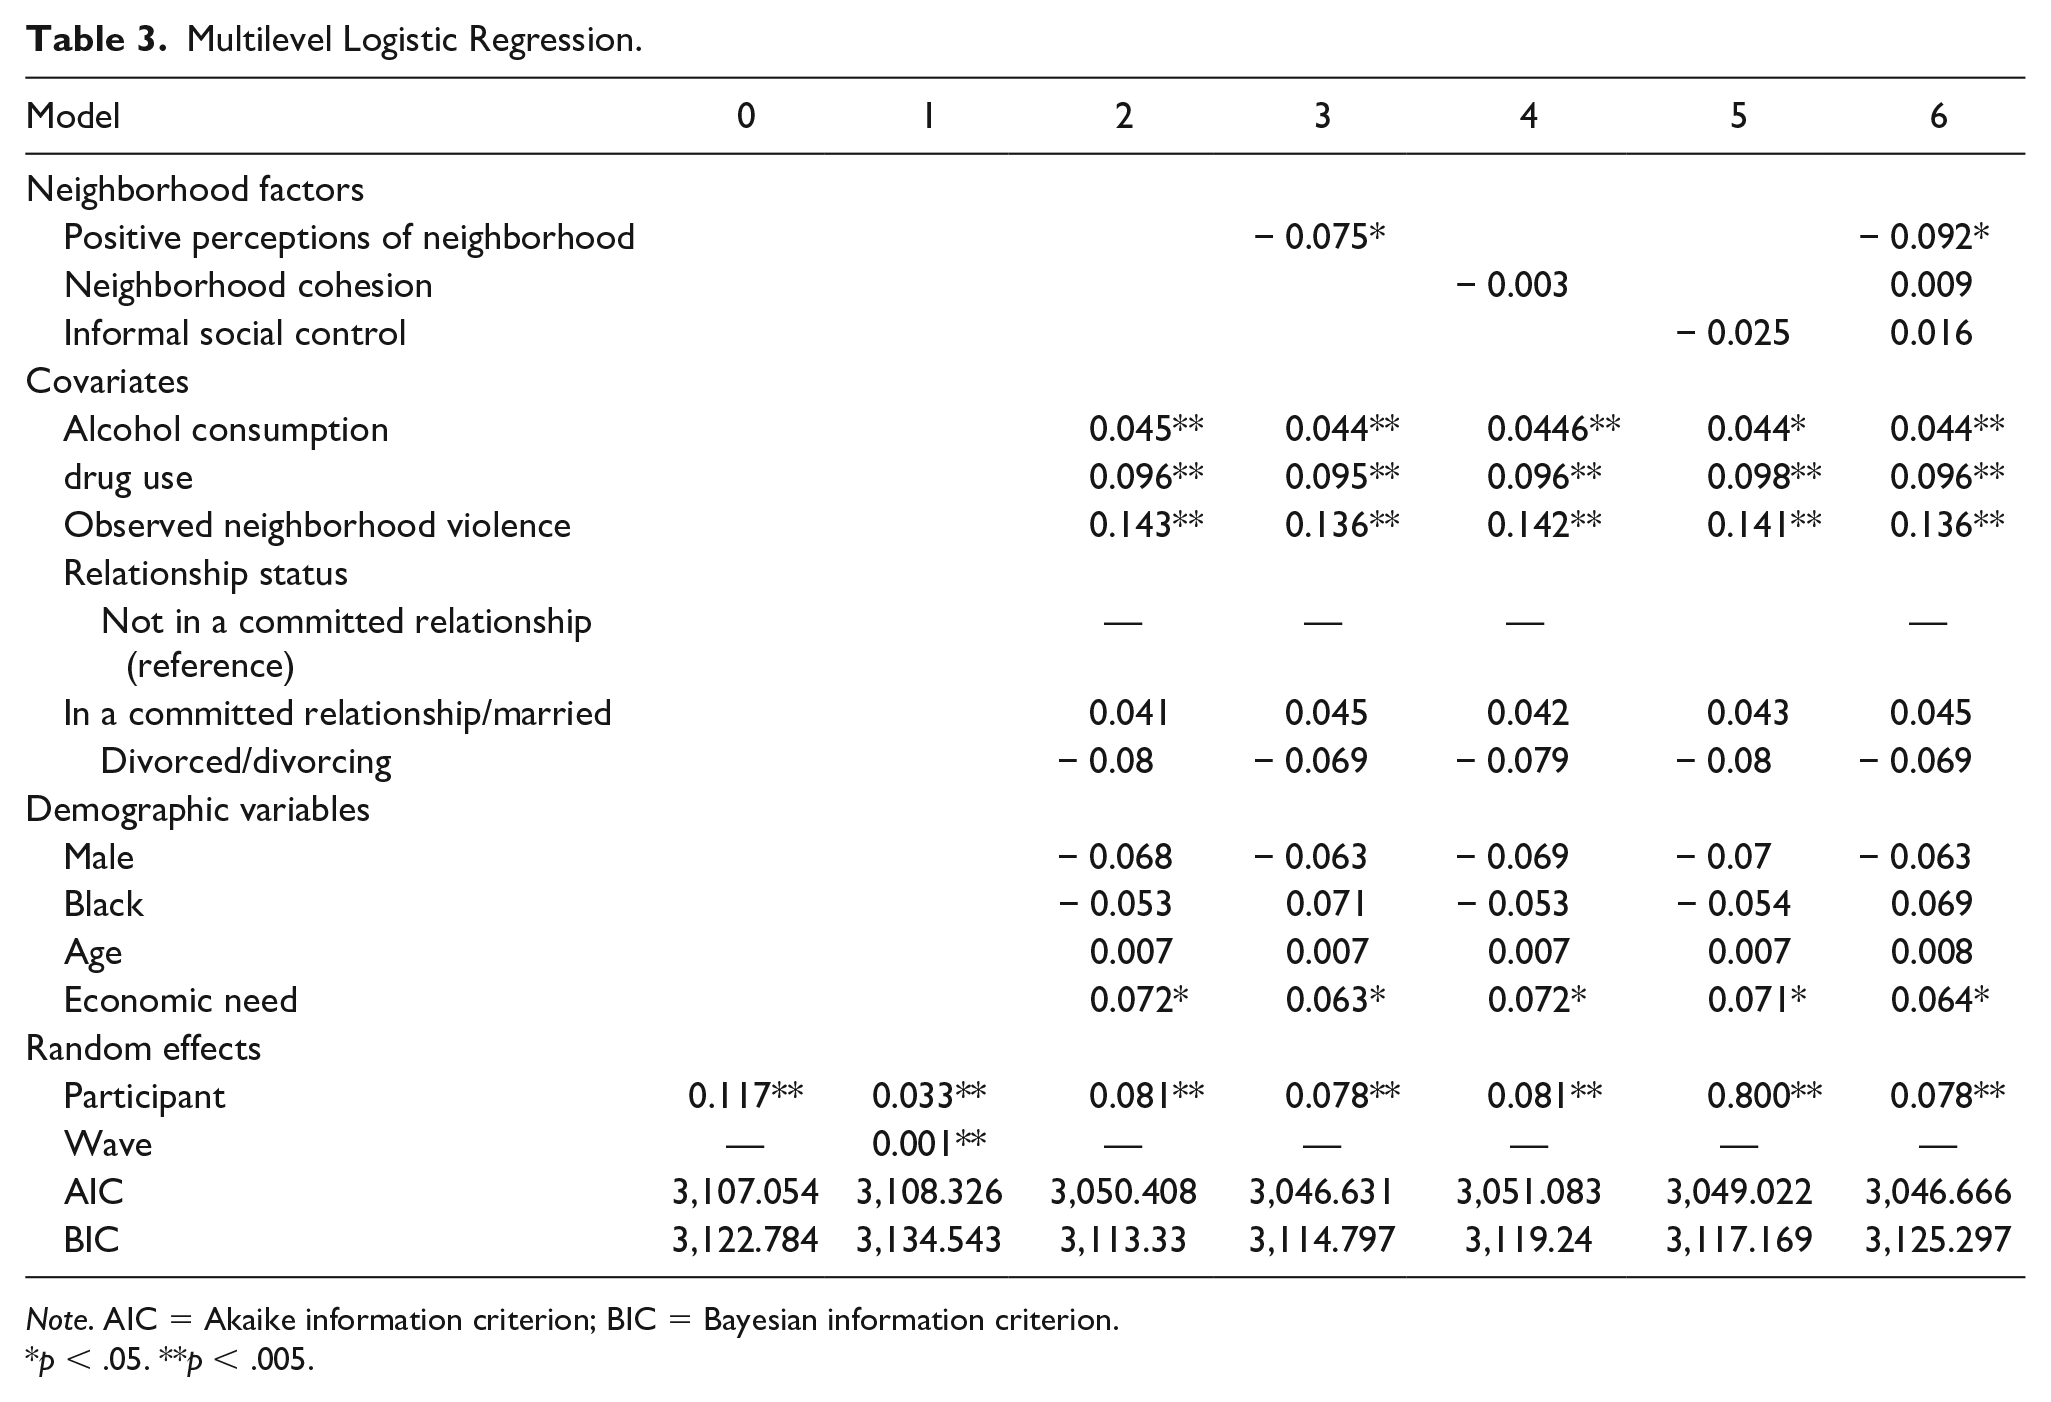
Model 0: The base model (Model 0) examined if the intercept varied across respondents relative to experiences of IPV (Table 3). We found that the mean experience of IPV across four waves varied by individual (b = 0.117, SE = 0.021, p < .001).
Model 1: Model 1 examined time (wave) as a random effect. First, time (wave) was examined as a fixed effect (not in Table 3). Wave as a fixed-effect was nonsignificant (b = −0.024, SE = 0.0169, p = .155). Next, we examined if individual trajectories of IPV vary between individuals. The random effects for IPV intercept and slope were significant (bperson = 0.033, SE = 0.102; bwave = 0.001, SE = 0.001; p < .001), but the coefficient for variance of time was near zero, suggesting very little between person variability in IPV change over time. These findings mean that individual’s trajectory stays relatively stable, and the slope of trajectory is similar across individuals—the difference is where they start (e.g., the intercept coefficient). The likelihood-ratio test after estimation indicated that the nested model (Model 1) did not fit significantly better than the nonnested model (Model 0; χ2=2.73, df = 2, p = .256). The AIC fit statistics indicate Model 1 fits comparably with Model 0, the BIC suggest Model 1 is a worse fit (AIC1 = 3,108.326, BIC1 = 3,134.543; AIC0 = 3,107.054, BIC0 = 3,122.784). Despite the significant random effect for slope, the fit of Model 1 did not improve as compared with Model 0, thus we excluded the time random and fixed effects in subsequent models.
Model 2: Model 2 introduced fixed-effect covariate and demographic factors of alcohol consumption, drug use, neighborhood violence observations, relationship status, economic need, sex, race, and age. In this model, consumption of alcohol, drug use, violence observations, economic need, were positive and significantly associated with experiences of IPV (p < .05). The variables relationship status, sex, age, and race were not associated with IPV. The fit statistics for Model 2 were superior to Model 1 and Model 0 (AIC2 = 3,050.408, BIC2 = 3,113.33).
Model 3: Model 3 added the first independent variable of interest, positive perceptions of neighborhood, which was inversely and significantly related to IPV experiences (b = −0.075, SE = 0.031, p = .016). Model fit was moderately improved for AIC, and comparable when considering BIC to Model 2 (AIC3 = 3,046.631, BIC3 = 3,114.797). Alcohol consumption, drug use, violence observations, and economic need remained positively associated with IPV (p < .05).
Model 4: Model 4 examined the second independent variable of interest, neighborhood cohesion, which was not significantly associated with IPV (b = −0.003, SE=0.016; p = .853). The covariate and demographic statistics did not significantly change. The fit for Model 4 was slightly worse as compared with Model 3 (AIC4 = 3,051.083, BIC4 = 3,119.24).
Model 5: The fifth model considered the third independent variable of interest, informal social control. This variable was not associated with IPV (b = −0.025, SE=0.037, p=.500). All other variables did not change from the previous model. The fit for Model 5 was slightly better than that of Model 4 (AIC5 = 3,049.022, BIC5 = 3,117.169), but worse than Model 3.
Model 6: The final model examined all three neighborhood factors together. This model found that positive perceptions of neighborhood remained significant and inversely associated with IPV experiences (b = −0.092, SE = 0.036, p = .012), and neighborhood cohesion (b = .009, SE = .043, p = .834) and informal social control (b = .016, SE = .018, p = .389) were not significantly associated. As seen in prior models, alcohol consumption, drug use, observed neighborhood violence, and economic were positively associated with IPV experiences (p < .05). Model 6 AIC fit statistics (3,046.666) were better than Models 4 and 5, but comparable with Model 3; BIC fit statistics (3,125.297) were better than Models 4 and 5, but slightly worse than Model 3.
Multilevel Logistic Regression.
Note. AIC = Akaike information criterion; BIC = Bayesian information criterion.
p < .05. **p < .005.
Given the statistical findings and desire for parsimony, Model 3 was selected as the final model.
Discussion
Our findings partially support our busy streets hypothesis that higher reports of positive neighborhood factors would be associated with lower levels of IPV experience over time. We found positive perceptions of neighborhood were inversely related to IPV experiences in male and female adults aged 28 to 32 years. Notably, these effects were found controlling for known risk factors of IPV, including consumption of alcohol, drug use, observed neighborhood violence, economic need, age, race, gender, and relationship status. These findings hold consistent when all neighborhood factors are considered independently and together in a single model. Thus, our results partially support busy streets theory even though we did not find effects for social cohesion and informal social control. It is possible that because the original study was not designed for IPV research that our measures of social cohesion and informal social control did not adequately capture aspects of these constructs most pertinent for IPV. The items in these measures focused on general social factors that may not be pertinent to IPV and were derived from social disorganization theory so may have focused on responses to more general neighborhood violence factors (Sampson et al., 1997).
The findings of this study contribute to our understanding of IPV by supporting the importance of contextual factors, such as neighborhood factors. Researchers have found positive associations between negative physical and social risk factors such as higher rates of property blight and neighborhood poverty and violent or anti-social behavior (Branas et al., 2018; Garvin et al., 2013; Heinze et al., 2018; Sampson et al., 1997). Our findings that neighborhood violence is negatively associated with IPV add evidence toward the trend that neighborhood risk factors are associated with individual experiences of violence. Our research also expands on the findings of researchers examining positive social neighborhood features including cohesion (Browning, 2002; Caetano et al., 2010; Frye, 2007) by examining the positive social neighborhood factors of positive perceptions of neighborhood, social cohesion and informal social control with IPV. Our work contrasts with findings in a population of younger adults, aged 18 to 25 years, that identified social cohesion and informal control as significant predictors of IPV experiences; notably, Jain et al. (2010) did not examine positive perceptions of neighborhood. Further work examining sets of promotive neighborhood factors would benefit the field.
Consistent with busy streets theory, our findings are consistent with social disorganization theory as negative neighborhood factors predicted IPV risk, but our findings also suggest they may not adequately characterize neighborhoods because they do not capture the potential of positive neighborhood factors. Researchers have suggested that social disorganization theory is inadequate to understand and capture the complexity of neighborhood factors (Browning, 2002; Capaldi et al., 2012). This may be due to social disorganization theory focusing on risk factors and representing positive factors as the opposite of risk factors. Yet, the lack of negative factors does not mean that positive or promotive factors are present in a given neighborhood (and the presence of promotive factors does not mean that neighborhood risk factors are absent).
The items used to assess positive perceptions of neighborhood variable are more representative of constructs in busy streets theory (Aiyer et al., 2015) than the items for the social cohesion and informal social control variables. Busy streets theory postulates that promotive social processes can synergistically build on one another and create momentum that improves neighborhoods. Although IPV does not map perfectly onto more generalized types of violence (W. L. Johnson et al., 2015), given that many IPV interventions are based on empowerment theories (Page et al., 2017; Wood, 2015), examining neighborhood factors that are more closely related to busy streets theory may be a better fit for informing IPV prevention strategies than the risk factors derived from social disorganization theory. Future work could examine how neighborhood composition, including diversity within a neighborhood, and feelings of inclusion and accessibility to housing (in contrast to discrimination) may influence feelings of social cohesion or strengthen neighborhood ties.
The multilevel model allowed us to explore and find several insights on IPV trajectories relative to risk factors through growth curve modeling. We found that by 28 years of age, individuals have different risk starting points (e.g., the intercept coefficient in the model). We found that the risk of IPV does not change between time points within individuals between the ages of 28 and 33 years, and that the slope of IPV risk is similar across individuals. These findings build on prior researcher’s work that found that the average age of individuals who reported violence during arguments was in the early 30s; our findings suggest no inflection point or acceleration of risk between the late 20s and early 30s (Rodriguez et al., 2001). Instead, our findings support that risk is largely dependent on an individual’s initial risk level in the late 20s. This suggests that IPV prevention work should target younger ages, to reduce the risk level that the individual has by the late 20s.
Several limitations require attention. Although our study is longitudinal and we examined random effects, we do not examine causality because we used neighborhood and IPV data during the same period (Waves 9–12). Thus, our results are not able to conclude that more positive perceptions of neighborhood results in fewer experiences of IPV victimization. Future work examining neighborhood effects at an earlier time (e.g., adolescence) predicting IPV in adulthood would be helpful in deepening our understanding of the relationship between IPV and neighborhood factors. In addition, our measure of IPV focused on event experiences, but does not provide information about frequency of IPV victimization experiences. Nevertheless, our study suggests that future research, that is, both longitudinal and includes more detailed information about IPV would be useful. Our measures of positive neighborhood factors were self-reported and may introduce some reporting bias in our results. Yet, one could argue that resident perceptions are necessary to assess the lived experience in any given neighborhood. It would be useful to develop positive measures of neighborhoods that do not require resident self-report such as the presence and number neighborhood civic organizations, clean and accessible community spaces, and participation level of community members in community development, such as neighborhood associations. Finally, our findings are most generalizable to cities that are experiencing similar stresses as Flint; while the lived environment impacts all humans, further research in neighborhood physical and social relationships in rural areas or urban areas with robust economies would deepen our understanding of neighborhood factors and experiences of IPV.
Conclusion
Intimate partner violence is a pervasive problem. Although individual factors have been of great focus, less is known about contextual factors, particularly perceived neighborhood factors. This study fills in several gaps in the literature. The results of this study suggest that more positive perceptions of neighborhood are associated with lower levels of IPV experiences when controlling for risk factors of alcohol use, substance use, observed neighborhood violence, and economic need. The longitudinal nature allows this analysis to consider the change in a given factor, such as perceived neighborhood cohesion, relative to experiences of IPV, providing a fluidity and dimension of analysis that is missing from the field (Capaldi et al., 2012).
Statement on Diversity
Our sample is composed primarily of a minority population. We opt to not limit our exploration of IPV to women, and instead examine both female and male experiences of IPV. We note a consideration of generalizability in the limitations section, and acknowledge that this study does not address nonbinary gender or sexual identities, the lived experience of rural settings, or the lived experience of urban settings that have a robust economy. For this article, our analytic and writing team was interdisciplinary, had individuals who identify as male and female, persons of color, multiple race/ethnicities, and multiple religious beliefs.
Footnotes
Declaration of Conflicting Interests
The author(s) declared no potential conflicts of interest with respect to the research, authorship, and/or publication of this article.
Funding
The author(s) disclosed receipt of the following financial support for the research, authorship, and/or publication of this article: This research was funded by the National Institute on Drug Abuse, Grant No. DA07484 and National Institute of Child Health and Development, Grant No. R03HD083397-01. The research reported here does not necessarily reflect the views or policies of the National Institute on Drug Abuse.
