



Abstract
Bias-based bullying (e.g., bullying related to race, weight, sexual orientation) is a common experience among youth, yet few school-based prevention programs explicitly address this type of bullying. This study explores whether schools that offer diversity education activities have lower rates of bias-based bullying among students compared to schools that do not offer these activities. Data came from two sources: the 2018 CDC School Profiles Survey (N = 216 schools) and the 2019 Minnesota Student Survey (N = 64,510 students). Multilevel logistic regression tested associations between diversity education activities (diversity clubs, lessons, or special events) and eight types of bias-based bullying among students, with attention to effect modification by relevant demographic characteristics. Students attending schools that offer a wider variety of diversity education opportunities had significantly lower odds of bullying about race, ethnicity, or national origin among boys of color (OR = 0.89, CI: 0.80, 1.00), about sexual orientation for gay, bisexual, and questioning boys (OR = 0.81, CI: 0.67, 0.97), and about disability for boys with a physical health problem (OR = 0.86, CI: 0.76, 0.99). Attending a school with more types of diversity education activities may protect vulnerable students against specific types of bias-based bullying and advance health equity. A diversity education is recommended as a key component of antibullying efforts and policy.
Introduction
Peer bullying is a common form of interpersonal violence among youth; recent findings from the Youth Risk Behavior Surveillance System show that approximately one-quarter of high school students report being bullied in the past year (Basile et al., 2020). In general, bullying targets a wide range of personal characteristics (e.g., appearance, social awkwardness, high/low intelligence) or behaviors (e.g., clothing/style choices, peer group affiliations, perceived interference in another’s romantic relationship) that are considered undesirable by the actor, who typically has greater physical or social power than the target. Bias-based bullying is a subset of bullying experience, wherein bullying or harassment focuses specifically on personal characteristics or identities that have historically been (and continue to be) stigmatized, such as race, ethnicity, sexual orientation, gender identity, disability, or body weight, where the greater power of the actor is reinforced by systemic and structural forms of oppression. This type of bullying is common among youth, particularly young people with these marginalized identities (Bucchianeri et al., 2013, 2016; Flannery et al., 2016; Russell et al., 2012; Salmon et al., 2018; Swearer Napolitano et al., 2010). For example, previous research has found that 6% of White, non-Hispanic students reported being bullied or harassed about their race, ethnicity or national origin, while, in contrast, 22%-27% of African American, Asian, and Hispanic students reported this experience (Bucchianeri et al., 2016). Similarly, rates of bullying about sexual orientation are up to 14 times higher among lesbian and gay students compared to heterosexual students, and rates of bullying about weight are approximately twice as high for students with obesity compared to healthy weight students (Bucchianeri et al., 2016).
Bias-based bullying has been identified as a key contributor to poorer physical, emotional, and behavioral health, particularly among youth of color; lesbian, gay, bisexual, transgender, and queer/questioning (LGBTQ 1 ) youth; and youth who are overweight or obese (Bucchianeri et al., 2014; Hong et al., 2018; Rosenthal et al., 2015; Russell et al., 2012; Salmon et al., 2018; Sinclair et al., 2012; Walton, 2017). Furthermore, the detrimental effects of bias-based bullying may be even more pronounced than for bullying not rooted in stigma or bias (Russell et al., 2012; Sinclair et al., 2012). The National Academies of Sciences, Engineering, and Medicine (2016) called for research on bias-based bullying in these populations, consistent with numerous public health organizations that have prioritized reductions in bullying as essential to improving health among adolescents (HRSA Maternal Child Health Bureau, n.d.; United States Department of Health and Human Services, 2010).
Bullying Prevention in Schools
Schools are a typical locus of bullying prevention research and intervention. Numerous school-based bullying prevention programs have resulted in only modest, if any, change in general bullying attitudes and behaviors among students (Cantone et al., 2015; Evans et al., 2014; Fraguas et al., 2020; Jiménez-Barbero et al., 2016), with larger effects for White students than for those of other racial and ethnic groups (Bauer et al., 2007; Beelmann & Heinemann, 2014). Although several intervention studies have addressed prejudice among youth with the goal of improving attitudes toward stigmatized groups (Beelmann & Heinemann, 2014), there has been minimal attention to bias-based bullying as a specific outcome (Earnshaw et al., 2018). The most commonly studied type of bias-based bullying relates to homophobia (Beelmann & Heinemann, 2014), and a small body of literature shows promising effects of school-based activities in increasing acceptance of diverse sexual orientations. Learning activities such as workshops, panel discussions, and theatre and films with LGBTQ characters have been used in schools to address homophobia among students, with some success (Iverson & Seher, 2014; Lucassen & Burford, 2015; Saewyc & Marshall, 2011).
Beyond formal bullying prevention programs, schools also seek to improve their climate. School climate refers to student and staff attitudes and behaviors that characterize the school’s social environment, and improving school climate to be more safe and supportive of students is commonly thought of as a means to reduce school bullying (Voight & Nation, 2016). Studies have shown that positive school climate is associated with lower rates of bullying among students (Acosta et al., 2019; Birkett et al., 2009; Low & VanRyzin, 2014).
Steps to improving climate can be complex, and involve intentional planning, assessment, and implementation of “supportive practices that nurture inclusion and safeness” (Coulston & Smith, 2013). Inclusion leads to a socially connected and accepting environment. Further, inclusive practices that promote diversity have demonstrated success in improving this aspect of climate (Paluck, 2011; Voight & Nation, 2016), which has specifically been linked to decreases in bullying (Gage et al., 2014). For example, Gender and Sexuality Alliances or Gay-Straight Alliances (GSAs) have also been shown to contribute to a supportive climate and reduced bullying for LGBTQ students (Day et al., 2020; Marx & Kettrey, 2016)—although they are rarely conceptualized as a school climate intervention, per se. We are not aware of evaluations of similar clubs designed to support other marginalized groups of students (e.g., Black Student Unions).
The Present Study
With emerging evidence that youth with stigmatized characteristics are at higher risk of violence victimization, many schools in the United States have adopted diversity education activities to engender a school climate that values diversity and reduces bullying. The format of such activities varies widely, and can include commercial curricula, student groups, school-wide social activities, intergroup dialog, and peer education, among others (Voight & Nation, 2016). Few large-scale surveys of U.S. schools include measurement of this aspect of school climate. However, the Centers for Disease Control and Prevention’s (CDC) biannual School Health Profiles’ assessment of school connectedness measures the presence of three types of diversity education activities (clubs, special events, or in-class lessons “for students to learn about people different from them”). In 2018, the CDC reported that on average across states, 64% of schools had diversity promoting clubs, 67% offered diversity promoting special events, and 88% offered diversity promoting in-class lessons for students (Centers for Disease Control and Prevention, n.d.-b).
Guided by social-ecological models that emphasize institutional (e.g., school) factors for individual (e.g., student) well-being (Barboza et al., 2009), the present study capitalizes on two sources of existing data to explore whether students attending schools offering diversity education activities report lower rates of eight types of bias-based bullying victimization among students (i.e., bullying related to race, ethnicity, or national origin; religion; gender; gender expression; sexual orientation; disability; size or weight; or physical appearance). Building on recommendations (Earnshaw et al., 2018; Swearer Napolitano et al., 2010), this study pays particular attention to these associations among youth in vulnerable groups (i.e., youth of color, LGBTQ youth, those with a disability, and those who are overweight/obese).
Methods
Data Sources
This cross-sectional, multilevel study uses statewide surveillance data from two sources: the 2018 School Profiles Survey (Profiles) and the 2019 Minnesota Student Survey (MSS; Minnesota Center for Health Statistics, n.d.). Since 1996, the Profiles survey has been administered by the CDC in even-numbered years to secondary schools, in conjunction with state Departments of Education. The present study uses self-administered questionnaire data provided by school principals. Schools were randomly selected, and 77.7% of those invited participated in 2018 (N = 272). Data on bias-based bullying experienced by students were collected from the MSS, an anonymous survey administered triennially since 1989, which assesses a wide variety of health behaviors, risk factors and protective factors. All public schools in Minnesota are invited to participate at the 5th, 8th, 9th, and 11th grade levels; In 2019, 81% of school districts participated, yielding data from 68% of all 8th graders, 66% of all 9th graders, and 54% of all 11th graders enrolled statewide (N = 125,375). The demographic profile of participating students closely matches the state’s adolescent population. Approximately 2% of MSS cases were discarded where responses were highly implausible, inconsistent, or exaggerated. This analysis utilized data from the 216 schools that had data from both sources (N = 64,510 students); the merged dataset was created by the Minnesota Student Survey Interagency Team and identities of specific schools were blinded to the investigators. The University of Minnesota’s Institutional Review Board exempted this study from review due to the use of existing, anonymous data.
Measures
In the Profiles survey, each principal reported on a variety of school-based policies and programs relevant to student health and well-being. Items measured whether the school offered diversity education activities “for students to learn about people different from them, such as students with disabilities, homeless youth, or people from different cultures,” (three activity types included clubs, lessons, and special events, with yes/no options for each). A school-level variable was created indicating how many types of diversity education activities were offered (0-3), and each type of activity was also examined separately.
Eight types of bias-based bullying were included in the MSS: “During the last 30 days, how often have other students harassed or bullied you for any of the following reasons: your race, ethnicity or national origin; your religion; your gender (being male, female, transgender, etc.); your gender expression (your style, dress, or the way you walk or talk); because you are gay, lesbian, or bisexual or because someone thought you were; a physical or mental disability; your size or weight; your physical appearance.” Each had five response options ranging from never to every day. Given the non-normal distributions of bias-based bullying variables, they were dichotomized to never vs. ever for each type of bullying; the selected cutpoint was based on previous research showing that even infrequent bullying victimization is associated with detriments to well-being (Gower & Borowsky, 2013).
Several demographic and personal characteristics were also reported by students on the MSS. Students indicated all that applied of six racial and ethnic groups, which were used to create a seven-category variable (Hispanic or Latino/Latina; non-Hispanic American Indian, Asian, Black, Pacific Islander, White, and multiple race). In addition to one item regarding assigned sex (male/female), one item was used to assess if students were transgender, genderqueer, or gender fluid, or unsure about their gender identity (those who did not know what the question meant (4.2%) were set to missing on this variable). Students were asked how other people at school would describe their gender expression: very or mostly feminine, somewhat feminine, equally feminine and masculine, somewhat masculine, or very or mostly masculine, and these were crossed with assigned sex to create a variable “gender presentation as assigned” (a response of equally feminine and masculine (14.3%) was considered not as assigned). Students were asked to describe their sexual orientation as heterosexual, bisexual, gay or lesbian, questioning/not sure, pansexual, queer, or indicate if they do not describe themselves in any of these ways or were not sure what the question meant (those who do not describe themselves in any of these ways (8.5%) or were not sure what the question meant (1.5%) were set to missing on this variable). One item was used to assess physical disabilities (i.e., “long-term health problems (such as asthma, cancer, diabetes, epilepsy or something else)? Long-term means lasting six months or more”) with response options of yes or no. Students also reported their weight and height, which was used to create three categories: underweight or healthy weight (≤85th percentile), overweight (85th -≤ 95th), and obese (>95th; Centers for Disease Control and Prevention, n.d.-a). Similar questions regarding religion and appearance were not assessed on the MSS.
Students also reported their grade in school, and whether they had experienced food insecurity in the past month (“had to skip meals because your family did not have enough money to buy food”) or housing insecurity in the past year (“stayed in a shelter, somewhere not intended as a place to live, or someone else’s home because you had no other place to stay”). Those who reported either food or housing insecurity were considered to have experienced poverty and contrasted with those who had neither of these experiences. The MSS team categorized all participants as living in the Twin Cities metropolitan area vs. elsewhere in the state.
Statistical Analysis
Data analysis was conducted using SAS version 9.4. The proportion of students experiencing each type of bias-based bullying is reported and chi-square tests were used to compare prevalence for those with and without the relevant demographic or personal characteristic (e.g., LGBQ identity for bullying regarding sexual orientation), where the appropriate measure was available. Characteristics were categorized as shown in Table 2.
Generalized estimating equations were used to conduct multilevel logistic regressions testing whether the school-level variables of (a) number of types of school diversity education activities and (b) each specific type of diversity education (clubs, lessons, events) were associated with bullying based on race, ethnicity, or national origin; religion, gender; gender expression; sexual orientation; disability; weight; and appearance (student level variables). Interaction terms were added to statistical models to test whether results differed for those with and without the relevant characteristic (as above). Stratified models were run when interaction terms were statistically significant (p < .05) or marginally significant (p < .10). Analyses accounted for the clustering of students within schools, and for grade in school, poverty, and metropolitan location. All models were stratified by assigned sex.
Results
Diversity education activities were common in this sample of secondary schools, with 45.8% of schools offering all three types (Table 1). In-class lessons were the most common type, with 87.0% of principals endorsing this activity at their school. Characteristics of the student sample are shown in Table 2. The student sample was evenly split by assigned sex, and 2/3 of students (68.5%) were White, non-Hispanic. Only 3.3% identified as transgender/gender diverse, or unsure about their gender identity, but almost 18% described their gender expression as different than societal expectations based on their assigned sex.
Diversity Activities in Secondary Schools (N = 216).

Characteristics of Sample and Prevalence of Bias-Based Bullying Victimization, Percent (N = 64,510).
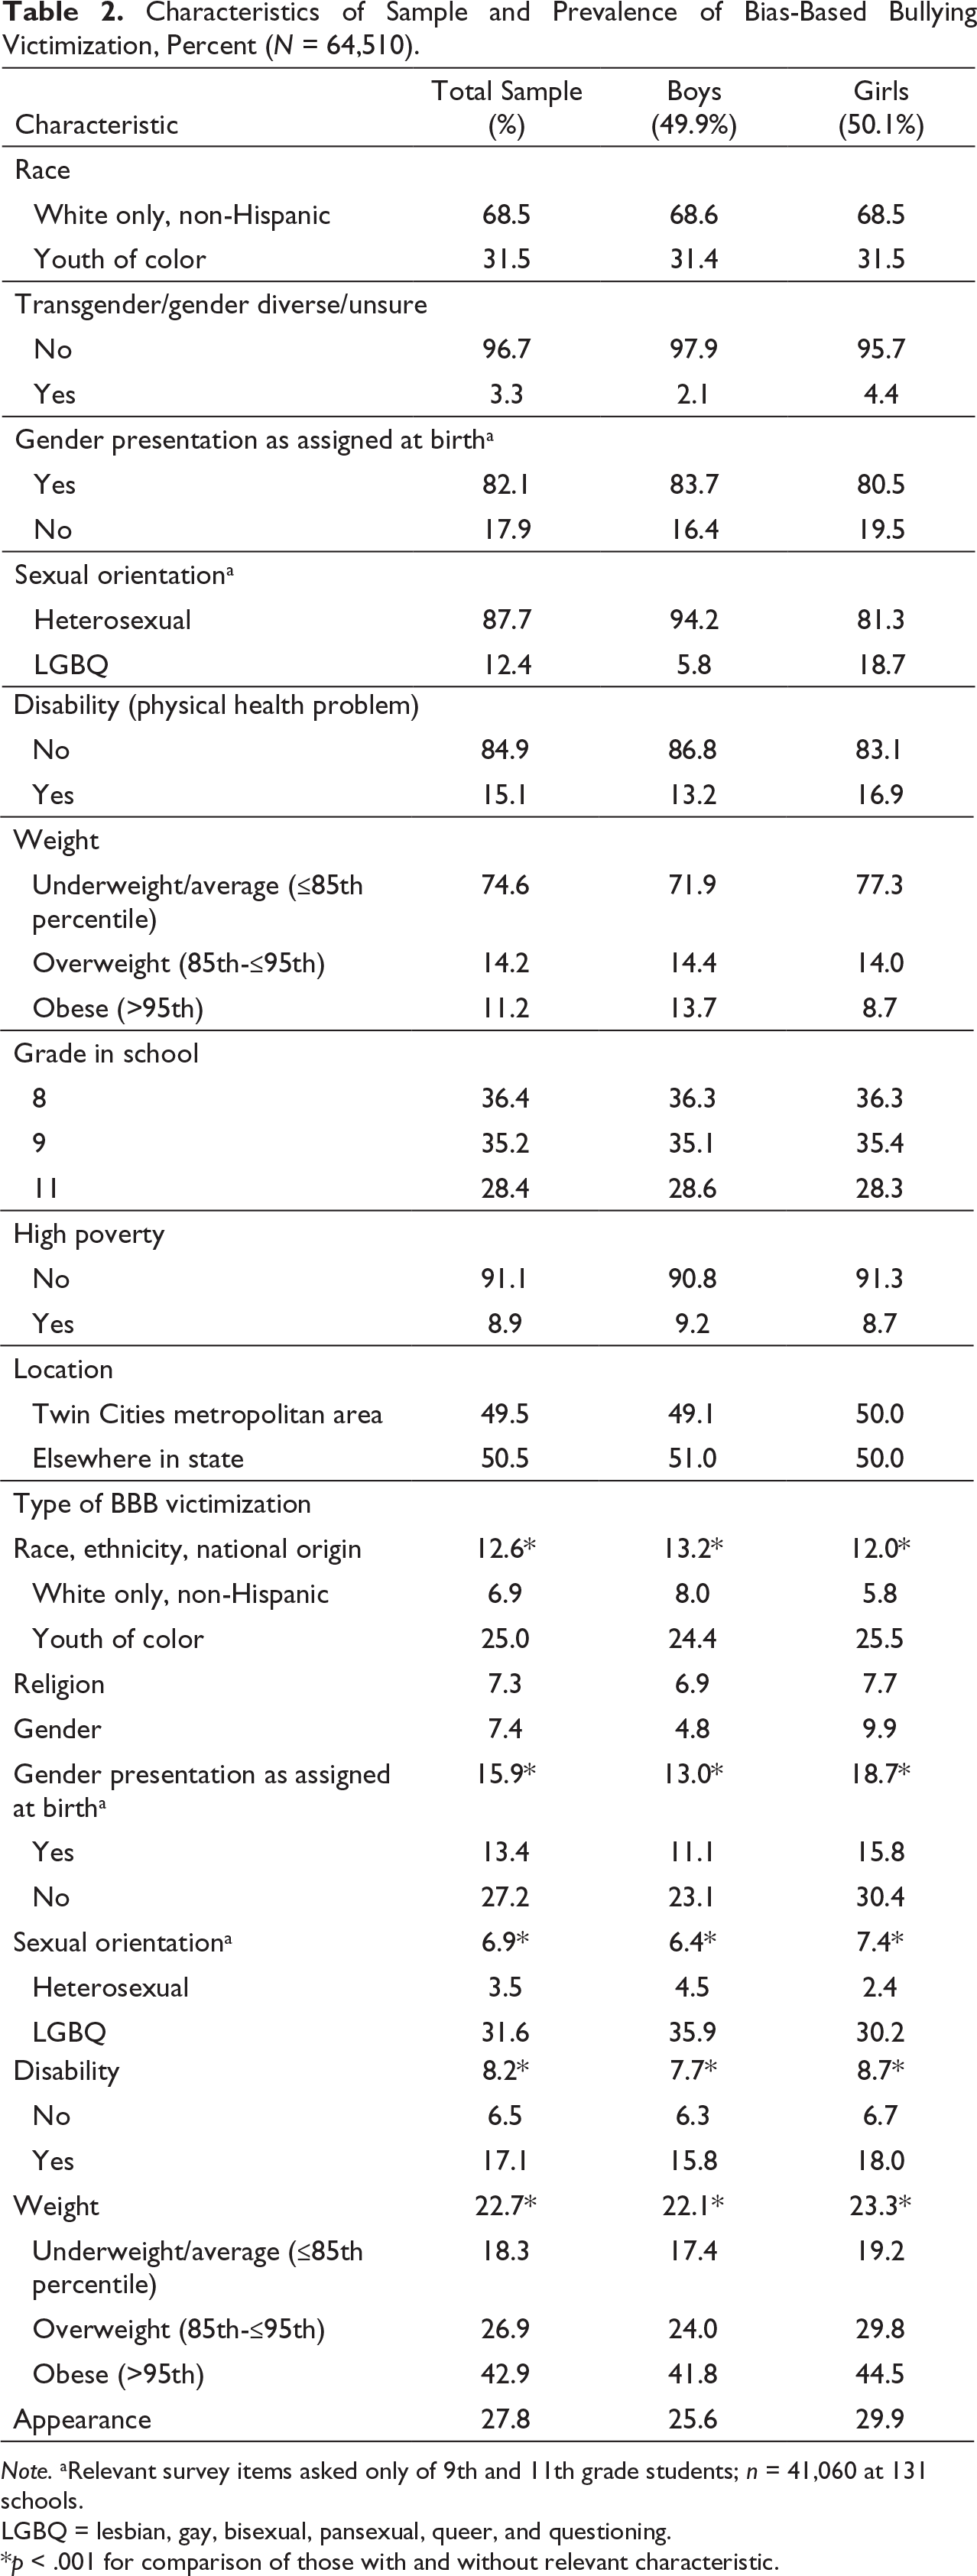
Note. aRelevant survey items asked only of 9th and 11th grade students; n = 41,060 at 131 schools.
LGBQ = lesbian, gay, bisexual, pansexual, queer, and questioning.
*p < .001 for comparison of those with and without relevant characteristic.
Odds Ratios for Bias-Based Bullying Victimization Associated With One Unit Difference in Diversity Activities.a
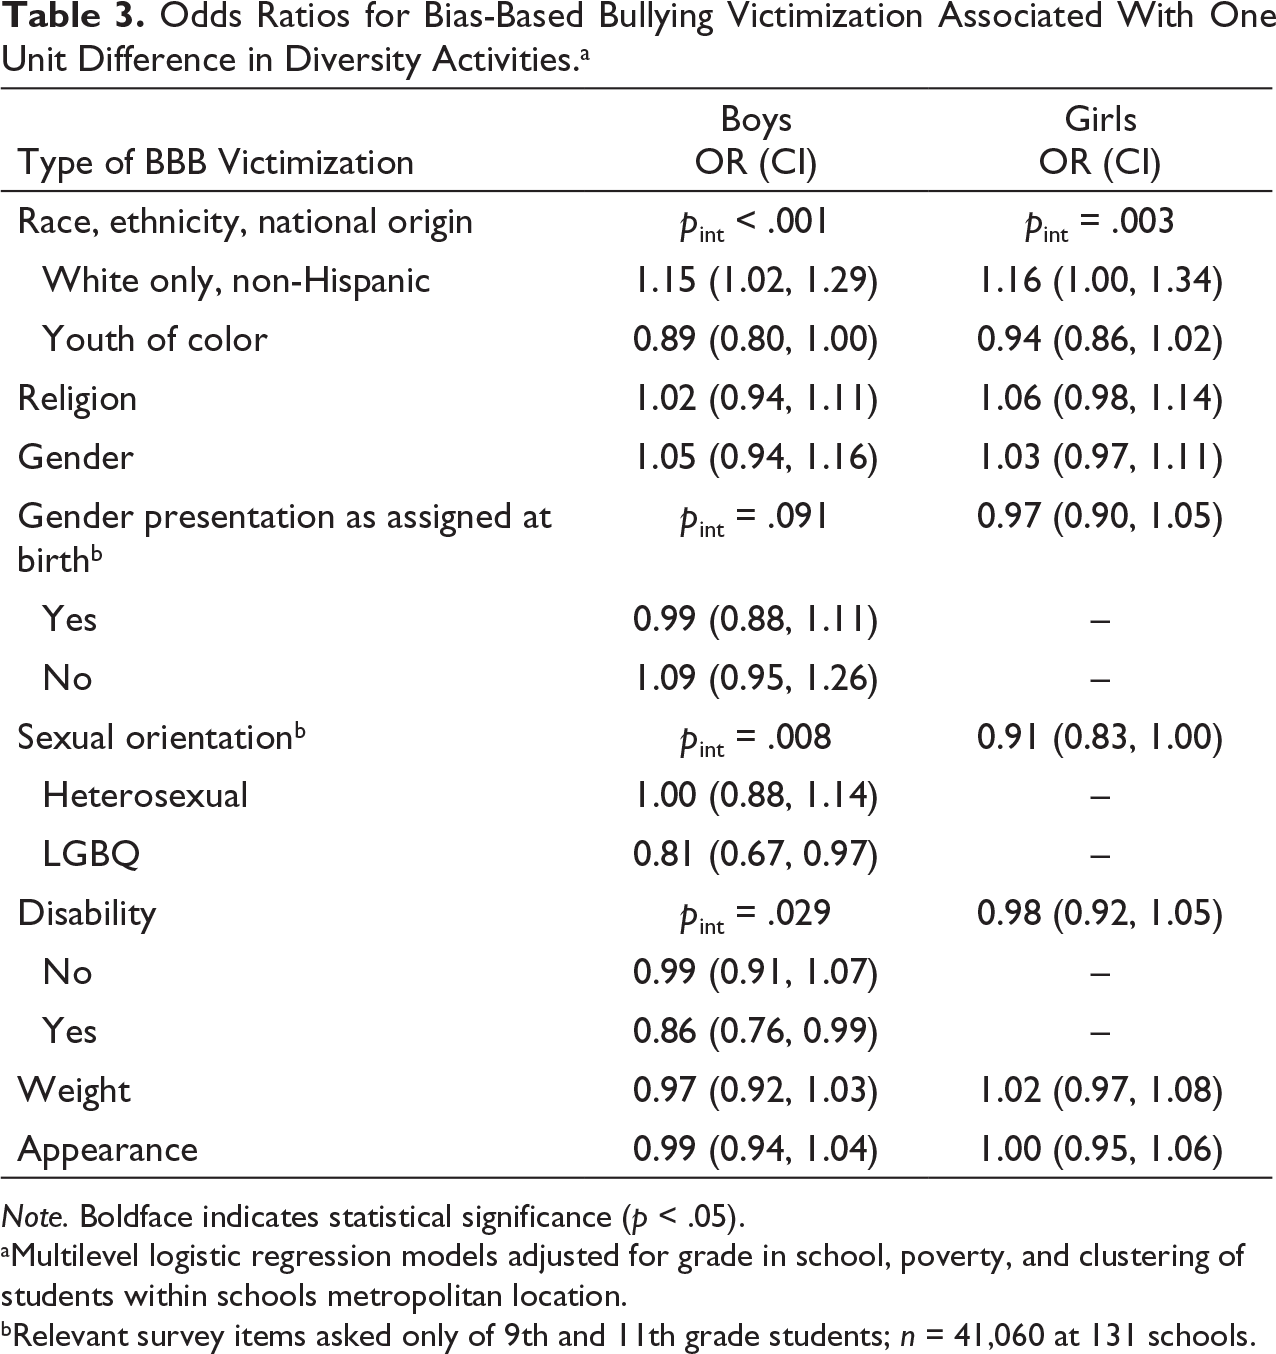
Note. Boldface indicates statistical significance (p < .05).
aMultilevel logistic regression models adjusted for grade in school, poverty, and clustering of students within schools metropolitan location.
bRelevant survey items asked only of 9th and 11th grade students; n = 41,060 at 131 schools.
In order to illustrate conflicting findings for the combined diversity education variable and bullying regarding race, ethnicity, and national origin, predicted probabilities were calculated from estimates generated by stratified models (Figure 1). For example, among boys of color, the predicted probability of experiencing this type of bias-based bullying was .29 at schools with no diversity education activities and .24 at schools with all three types. In contrast, the predicted probability of bullying based on race, ethnicity or national origin was .05 for White, non-Hispanic boys at schools with no diversity education activities and .08 at schools with all three types.
Predicted probability of experiencing bullying based on race, ethnicity, or national origin.

Odds Ratios for Bias-Based Bullying Associated With Having Each Type of Diversity Activities at School.a
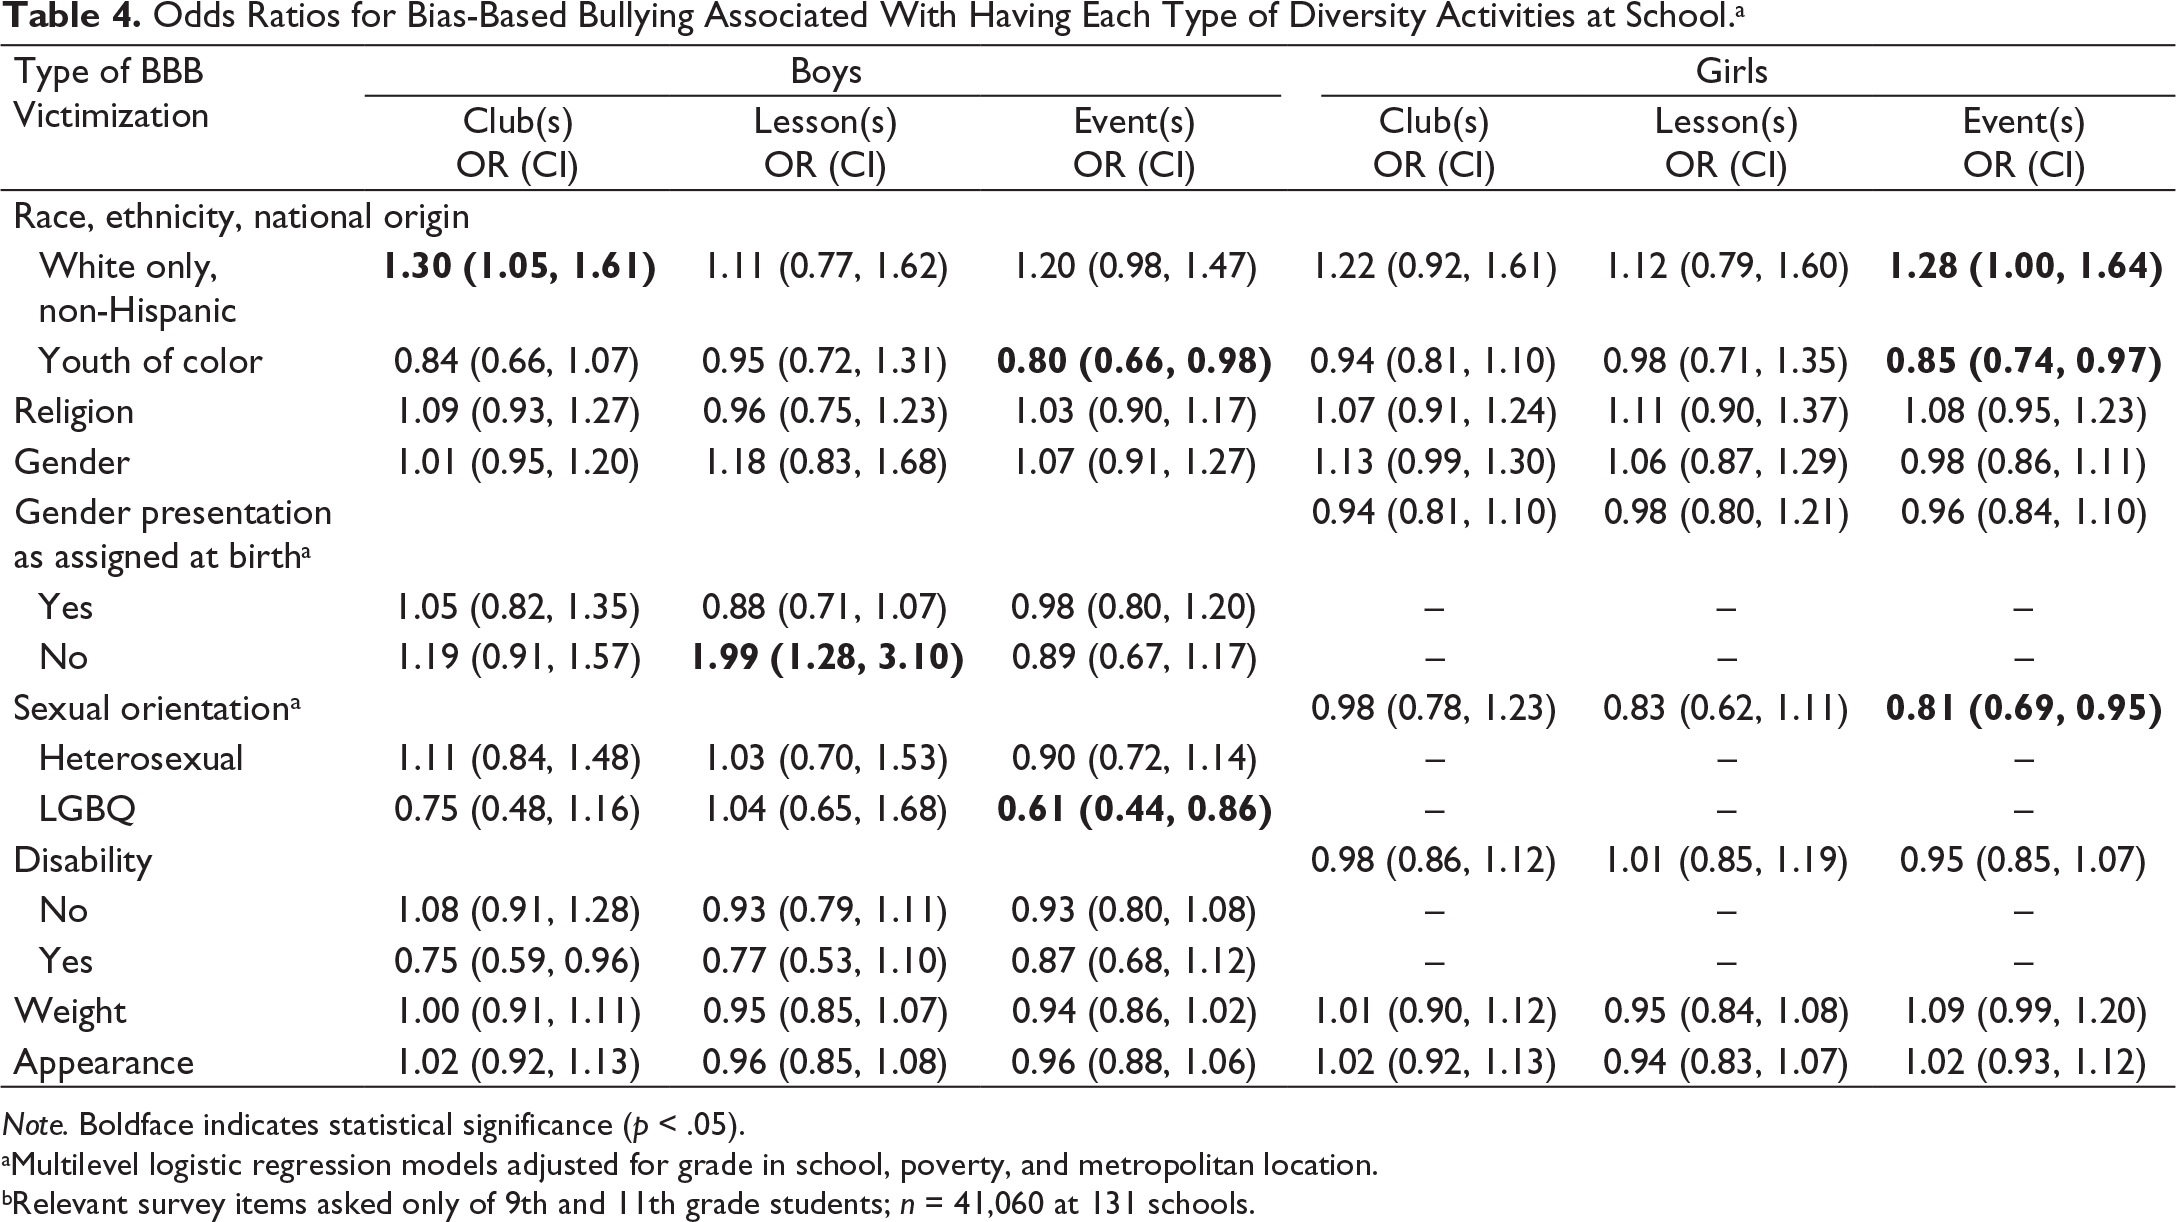
Note. Boldface indicates statistical significance (p < .05).
aMultilevel logistic regression models adjusted for grade in school, poverty, and metropolitan location.
bRelevant survey items asked only of 9th and 11th grade students; n = 41,060 at 131 schools.
Discussion
The goal of this study was to test whether the presence of diversity education activities at school is associated with experiences of bias-based bullying among students. The majority of schools in this sample offered three types of diversity education activities, at levels that were consistent with national data (Centers for Disease Control and Prevention, n.d.-b). Findings suggest that students attending secondary schools that offer diversity education activities may experience lower odds of several types of bias-based bullying victimization, particularly boys who are members of vulnerable groups. The relationship between diversity education activities and bias-based bullying varied somewhat across both the specific type of diversity education activity and the type of bias.
Several previous studies have documented sex differences in the relationship between social supports (particularly institutional and community) and the well-being of young people in those settings. The current study included significant findings mostly for boys, in regards to bullying about race, ethnicity, or national origin, sexual orientation, and disability. Interestingly, previous literature has more commonly found significant findings for girls. For example, student support organizations, LGBTQ-supportive school policies, and LGBTQ-supportive community resources have been associated with several measures of well-being among LGBQ girls (Eisenberg et al., 2019; Konishi et al., 2013; Poteat et al., 2012), including bias-based bullying experiences specifically (Gower et al., 2020). Based on these prior studies, investigators have theorized that girls may be more aware of or connected to social resources, or more “tuned in” to cues from the social climate that such resources represent. Our research, however, supports the adoption of diversity education as a protective factor for marginalized boys in the school setting.
This study found significant associations between diversity education activities and three of the eight types of bias-based bullying examined here—race, ethnicity, and national origin; sexual orientation; and physical disability. Discrimination and violence toward African Americans, Hispanic immigrants, and LGBTQ people have been the focus of public policy and discourse in recent years (e.g., Black Lives Matter, immigration bans, marriage equality); it may be the case that diversity education activities focused on these issues and groups, resulting in the findings seen here. Without information on the topics addressed in schools’ diversity education activities, however, this could not be tested in the present study.
An unexpected finding is that schools offering a greater variety of diversity education activities saw slightly higher rates of bias-based bullying about race, ethnicity, and national origin among White students than schools with few such activities (8% vs. 5% among boys). Two possible explanations are hypothesized. First, we acknowledge the possibility that this result could be due to genuinely higher rates of aggression toward White students in schools with greater attention to diversity (reported by White students as bias-based bullying). Alternatively, a school’s acceptance of and respect for diverse backgrounds may be viewed as a direct challenge to White supremacist messaging that is prevalent in U.S. society (Anti-Defamation League Center on Extremism, 2020), which some White students may perceive as devaluing of their White identities, and report as race-based bullying. Regardless of the underlying reason, it is important to note that even in schools with the highest rates of this type of bullying among White students, rates were approximately three times higher among youth of color (23% among boys).
Two main mechanisms may be responsible for the results found here. Diversity education activities may lead to reductions in bias-based bullying by increasing acceptance of differences, building compassion, and/or strengthening social skills among students who participate in these activities. Furthermore, the various learning modes that range from clubs to lessons to special events facilitate the building of skills and awareness in a more comprehensive manner. Future study of these issues, accounting for students’ involvement in these school activities, is needed to illuminate this pathway. A second possibility is that the presence of a variety of diversity education activities serves as a proxy for a more inclusive social environment and a climate that is broadly welcoming and supportive of diverse students. In such settings, bias and bullying may be less acceptable among students (as well as among school personnel), which would contribute to social norms that are unsupportive of stigmatizing behaviors. Regardless of the theorized pathway, schools with such activities appear to provide safer environments for students when it comes to bullying.
Limitations and Strengths
Several limitations and strengths must be considered in interpreting this work. Given that this is a secondary analysis of two existing datasets, several relevant points could not be included, including the number of sessions, length of time, content, and population of interest (e.g., students of color, LGBTQ students) of diversity education activities in school, which may be related to effectiveness (Beelmann & Heinemann, 2014); whether such activities were required of all students or elected by interested students; and whether specific students reporting on their bias-based bullying experience engaged in the diversity activities at their school. This research also was not able to include an information on teachers’ or facilitators’ interest or expertise in the diversity topic, or other measures of the climate of the school, students’ experiences of systemic discrimination in school, or resources in the surrounding community. Similarly, the MSS did not include measures of several personal characteristics (e.g., religion) that would have allowed for stratified models of corresponding types of bias-based bullying. In addition, although the sequencing of the school (2018) and student (2019) surveys is consistent with the theorized causal association, each dataset was itself cross-sectional. The years when diversity activities were added to school programming or previous rates of bias-based bullying in those schools are not known; thus, a causal relationship cannot be inferred. Further research is recommended to address these shortcomings.
However, this research uses a very large sample of schools and students, which is an uncommon strength, in that it permits robust statistical analysis among groups of youth with less prevalent identities (e.g., transgender/gender diverse), who are often excluded or combined with others for analysis. Additionally, the MSS included numerous types of bias-based bullying and several demographic and personal characteristics that allowed us to examine effects for the most relevant groups of youth. This breadth of measures is rare in large surveillance studies, and allows for greater generalization of our findings than would be possible in a smaller study focused on specific groups or previous bullying experience.
Implications and Conclusions
This study highlights that greater exposure to diversity education activities at school—regardless of specific format or content—may contribute to a supportive school climate that protects vulnerable students, particularly boys, against specific types of bias-based bullying and advances health equity. Particularly in the current context of divisiveness and systemic discrimination and oppression in schools and society more broadly, diversity education is recommended as a key component of antibullying efforts and policy to address risk and protective factors of bias-based violence.
Given the starkly disproportionate rates of bullying experienced by youth in stigmatized groups, one promising approach to prevention is the use of broad and multiple types of diversity education programming. Educators across all content areas are encouraged to address issues of diversity and stigma in their classroom lessons and extracurricular activities. School faculty and staff should plan assemblies, after-school programs (e.g., family and community events), and other activities (e.g., student mentoring programs) that share information and celebrate all types of human diversity. Student affiliation groups should also be supported by schools, especially with staff trained as facilitators and advocates. Schools can look to national organizations for technical support, lessons, and other resources to create welcoming schools for students of all backgrounds and identities (Anti-Defamation League, 2021; Campaign, 2021; Learning for Justice, 2021).
Schools may have natural opportunities to increase the number and type of diversity education activities they offer. Many schools have bullying prevention policies, programs, and trainings; revising the language of written materials (e.g., school policies) to explicitly refer to bullying rooted in bias and adding content about diversity and bias to existing antibullying events or lessons would streamline these related activities. Likewise, social-emotional learning and general training on relationship building and communication are common, and would be another avenue for adding content related to diversity. Interweaving diversity education into already-existing structures may be an efficient strategy to expand these activities and further establish a climate of equity and inclusion. Further research is also needed to monitor and evaluate the effectiveness of this approach in contrast to separate diversity education activities, as were examined in this study.
Footnotes
Acknowledgments
The sponsor had no role in the study design; collection, analysis, and interpretation of data; writing the report; or the decision to submit the report for publication.
Minnesota Student Survey data were provided by public school students in Minnesota via local public school districts and managed by the Minnesota Student Survey Interagency Team.
Declaration of Conflicting Interests
Funding
The author(s) disclosed receipt of the following financial support for the research, authorship, and/or publication of this article: Funding for this research came from the University of Minnesota, Department of Pediatrics New Team Science Grant, supported by the Minnesota Masonic Charities Fund.
