



Abstract
This research project examined the potential variables associated with high-risk police pursuits in the state of Georgia. The Georgia Association of Chiefs of Police (GACP) initiated data collection of pursuits among accredited agencies as a result of the decision in Scott v. Harris. A sample of 2,155 pursuit reports from 2007 to 2009 was analyzed using chi-square analysis. Variables associated with negative pursuit outcomes revealed a classification of variables for high-risk pursuits. The findings indicated a classification of high-risk pursuit variables, which originated from approximately 100 GACP accredited police agencies per year during the 3-year collection of data. Discussion includes implications related to policy evaluation and training as well as suggestions for future research.
Introduction
Media reports and television shows notwithstanding, the imagery of police pursuit crashes has not escaped concerns of the public and policy makers. News media has covered this controversial topic in their effort to report on police pursuit that satiate public desires and result in ratings (Cavendar & Deutsch, 2007; Lawrence, 2000). As Ferrell (2003) has indicated, the desire by the public to promote policies in police chases can outweigh the dangers and collateral damage that largely escape the public consciousness. A relative majority of society supports the process of the police chase, policies behind it, and the goal of catching criminals at the expense of potential tragedy (MacDonald & Alpert, 1998).
According to Alpert, Kenney, Dunham, Smith, and Cosgrove (1996), one of the variables to consider in all police pursuit incidents is the public as innocent third-party victims. If the fleeing driver or the public are at risk during these incidents, then pursuits are a form of coercive action in the use of force continuum. Public consideration is essential when examining all factors in police pursuit incident policies (Alpert & Dunham, 1989).
Not captured by these and other statistics are the number of third-party injuries and property damage related to these pursuits. Awareness of the destruction caused by high-speed pursuits has been heightened by media reports of the events. The increase in exposure to third-party damage and injuries caused by police pursuits has been correlated with an increase in public fear and risk associated with driving on the highways (Alpert et al., 1996; Crew & Hart, 1999). Proper policy and management strategies within the law enforcement profession must evaluate objectives in police pursuits (Alpert, 1997; Alpert et al., 1996; Alpert & Smith, 1999).
Police pursuit policies are of vital interest to the public as stakeholders, but also because the driving public is a relevant factor to consider in police pursuit incidents. Practitioners and administrators understand that officers need guidance in policy and model formulation when use of force is an issue (Alpert et al., 1996).
Literature Review on Variables
When seeking solutions to negative outcomes involving police pursuits, careful attention should always be given to analysis and interpretation of pursuit information. Routine decision-making based on experience can help solve short-term issues, but the scope of issues surrounding police pursuits require adequate decision-making skills derived from empirical assessments. The combination of the three main parties involved in pursuits (police, suspect, and public as third party) can create unexpected possibilities that lead to negative outcomes. Discretionary decision-making is the principal factor influencing outcomes of police pursuits. Data involving pursuits must lend directly toward proper decision-making with a direction toward the most influential party in the incident, the police officer (Alpert & Dunham, 1989).
During such events, vague policies contribute to variability of actions on behalf of the pursuing police officer, whereas more restrictive policies safeguard against unpredictable police decision-making and actions. There are three general models of police pursuits: judgmental, restrictive, and discouragement. Judgmental policies rely on officer decision-making regarding pursuit initiation, tactical maneuvers, and termination. Restrictive policies place specific restrictions on each phase of the pursuit incident. Discouragement policies caution against or completely discourage pursuits except for in the most extreme scenarios (Alpert & Dunham, 1989).
Alpert and Dunham (1989) reported data from 300 pursuits that occurred in Dade County, Florida, during 1987. The most significant findings indicated that younger officers were more likely to be involved in injurious pursuits, higher numbers of police units involved were more likely to be involved in negative outcomes, and rural locations for pursuits were more likely to be involved in injuries. One interesting discovery was that there existed no significant relationship between length of the pursuit and injury outcome.
Officer Variables
Research into police physiology indicates a rise in adrenaline, stress, and contention within officers during and after police pursuits (Crundall, Chapman, Phelps, & Underwood, 2003; Crundall, Chapman, France, Underwood, & Phelps, 2005). Visual stimuli account for an overwhelming majority of the information drivers’ process at normal and high speeds (Crundall et al., 2003). For drivers and especially police officers, the recognition of driving hazards is important for driving safety. Crundall et al. (2003) posited that experience and training can improve this recognition process during hazardous driving conditions. Electro-dermal responses (EDRs) and oculomotor (eye-tracking) movements were tracked over several videos of police pursuits that occurred in different environments with road/traffic conditions. Participants included novice drivers, experienced police officers with pursuit training, and experienced civilian drivers who had similar characteristics of the officers. EDRs were elevated for police officers compared with the other groups. Furthermore, oculomotor measures indicated a longer scanning history for police officers compared with other drivers. That is, the officers spent less time fixated on the pursuit vehicle and more time scanning horizontally compared with other groups. An interesting finding was the difference in fixation periods on the pursuit car during night-time scenarios compared with day-time scenarios, which led to a subsequent study.
Suspect Variables
Utilizing a sample of offenders (n = 146) who agreed to participate in surveys and follow-up interviews regarding their pursuit incident, Dunham, Kenney, Alpert, and Cromwell (1998) were able to gauge the perceptions of offenders involved in police pursuits. With regard to pursuit outcomes, 30% of suspects reported terminating the pursuit on their own either by surrendering or abandoning the vehicle, or instead flee on foot. Of the total sample, 25% of the offenders who outran police (foot or vehicle) got away, whereas another 30% crashed their vehicle during the pursuit. The chances of apprehension were greatest for those suspects who crashed or were forced to stop by the police. Questions were also asked about the respondents’ reasoning for risk-taking. For instance, 67% of respondents indicated they would still run if pursued aggressively, and slightly more than half (53%) stated they would run at all costs. Three fourths of the sample indicated they would have slowed down if they felt they were at a safe distance from law enforcement pursuing them (Dunham et al., 1998).
Toward a High-Risk Typology of Pursuits
Previous research has focused on one agency or policy-related data from multiple agencies. A comprehensive National Institute of Justice (NIJ) study conducted a survey of 436 agencies, where officers (with experience ranging from rookie patrol officers to supervisors) were respondents on various aspects of police pursuits. Furthermore, data from three metro-area agencies were obtained on 1,200 police pursuits to correspond with 126 interviews of incarcerated suspects who were involved in pursuits within those areas. Ninety-one percent of those agencies surveyed had written policies on pursuits, but almost half were never updated. Of those with updated policies, 87% indicated they had revised them to be more restrictive. Of the 436 agencies, only 135 regularly recorded data on their pursuits, with only 5% of the states represented by the sample indicating that data collection was mandatory. With regard to training, only 60% of agencies mandated a pursuit course at police academies, and the average amount of time allocated to the topic was approximately 14 hr. Very few agencies indicated more than 3 hr per year of training on pursuits after basic academy training (Alpert, 1997).
According to Alpert (1998), there are four critical factors to be considered during a police pursuit: known violation, area of pursuit, weather conditions, and traffic conditions. In a comprehensive survey of 1,055 officers representing four major municipalities, he found interesting results through utilizing factor analysis, which scaled items into the following variables (risk factors): area, violation, and road conditions. Logistic regression was then used to assess the likelihood to pursue or not to pursue (the dichotomous dependent variable). Alpert’s findings indicated that officers were three times more likely to pursue for Driving Under the Influence (DUI) over other traffic offenses. There were no significant differences between highway or commercial areas, but officers were less likely to pursue in residential areas compared with main freeways. Officers were three times more likely to pursue in non-congested traffic conditions, but only 1.7 times more likely to pursue on dry road conditions. Overall, supervisors and officers indicated apprehension as the most important factor in deciding to initiate or continue pursuit of a suspect. A key factor in understanding risk factors versus need to apprehend is the consideration of terminating the chase in favor of follow-up investigative procedures.
Hoffmann and Mazerolle (2005) analyzed pursuit data from Queensland Police Services in Australia. Data were obtained on approximately 1,200 pursuits across 2 years (2000-2002). Approximately 50% of the pursuits were initiated due to traffic offenses, and approximately 25% were due to stolen cars. Of all pursuits, approximately 11% resulted in death or injury, and two persons, on average, died each year as a result of police pursuits. However, data from charges filed after the pursuit indicated that the most frequent additional charge was driving while intoxicated or driving while unlicensed. The study found that an important aspect of balancing public safety versus offender apprehension is seriousness of the offense. Further consideration of policies in restricting pursuits for traffic offenses would reduce these incidents by half, and a further level of restriction against chasing stolen cars would reduce pursuit incidents an additional 25%. Despite advances in technological pursuit devices (Pursuit Intervention Technique [PIT], stop sticks, etc.), policy restrictiveness is likely to have a greater impact on public safety.
In evaluating the Police Executive Research Forum (PERF) data, Becknell, Mays, and Giever (1999) identified four criteria for evaluating each agency on their pursuit policy and implementation. First, each policy was rated on a continuum similar to that used by Alpert et al. (1996) ranging from a judgmental (or restrictive) policy to discouragement-type policy. Second, each agency’s policy was rated for clarity and specificity. Third, each agency was rated on thoroughness of training on police pursuits (initiation of pursuit, driving techniques, alternatives, and termination of pursuits). Finally, each agency was evaluated on its own methods for administratively tracking and monitoring pursuits and related outcomes (reporting pursuits, keeping statistics on each pursuit, and discipline of officers.
After each agency was rated, the four evaluative scales were used as independent variables in a subsequent Ordinary Least Squares (OLS)regression model seeking to explain the variance in three dependent variables: rate of pursuits for each agency, rate of pursuits involving accidents, and rate of pursuits involving deaths (where rates were determined by number of pursuits vs. number of officers per agency). Findings from these analyses indicated a significant inverse relationship between increasing policy restrictiveness and overall number of pursuits.
To evaluate this cost–benefit strategy, Crew and Hart (1999) utilized police pursuit data from the state of Minnesota during 1989 to 1996. In more than 6,700 pursuits, approximately 77% resulted in arrests, which was also the most frequent outcome of pursuits. In looking at costs versus benefits, the authors create a ratio of probability that a pursuit will likely result in a capture divided by the probability of a negative outcome (defined as accident, injury, or death). From the Minnesota data, pursuits were approximately 2.5 times more likely to end in an arrest (benefit) than a negative outcome. Logistic regression revealed that those factors with the greatest likelihood of negative outcomes were pursuits initiated due to suspected Driving While Intoxicated (DWIs)or felony offenses, which occurred during night-time hours. An interesting finding was neither length nor duration of pursuit was found to be a significant variable in these models. While Crew and Hart (1999) indicated a basic measure for cost–benefit analysis in decision-making of police pursuits, they at least created some degree of estimation for policy makers to consider regarding the legal liabilities associated with negative pursuit outcomes.
Madden and Alpert (1999) developed a “pursuit calculus” in their analysis of pursuit incident variables associated with data collected at the Miami Police Department. This data spanned from 1990 to 1994 and included variables from more than 1,000 pursuit incidents. Approximately 25% of the pursuits resulted in property damage and 20% of the pursuits resulted in personal injuries to those involved. From these pursuits, the authors examined the following variables: area, reason for pursuit, speed of pursuit, time of the day, and number of police units that pursued. Road conditions were not analyzed due to the low percentage (5%) of total pursuits where inclement weather was a factor. Considering the two-factor outcome of property damage and personal injury, log-linear models were utilized to evaluate categorical and scale data, and these models account for the interaction effect each have on pursuit outcomes. For property damage, most pursuit characteristics did not have a statistically significant effect, but number of pursuit units and pursuit during the day increased the odds of property damage to 3.88 to 1. For personal injury, the models indicated that more than 1 unit in pursuit coupled with speeds in excess of 65 mph and traveling from a residential area to a commercial area resulted in an increase of odds for injuries to parties (2.50-1). It is important to note that in some pursuit conditions, pursuits initiated for traffic offenses resulted in increased odds of injury versus pursuits for more serious offenses, but the effect was not significant and odds decreased for various pursuit conditions. Therefore, these variables interact to mediate the effects toward the likelihood of a negative outcome (property damage or injury).
For the pursuit decision calculus, Madden and Alpert (1999) indicated the model policy would utilize a cost–benefit analysis where the lowest offense (traffic) would necessitate a pursuit with the lowest risk to the public, and continuing up the scale model, an offense for a felony would call for law enforcement to consider a higher risk pursuit. To impute the economic models for cost–benefit odds, the authors divided the model policy into three scales (A, B, C). A Profile A pursuit would be utilized for low cost/risk decisions for traffic offenses and property damage. A Profile B pursuit would be utilized for medium cost/risk decisions for pursuits involved in property damage to felonies, and a Profile C pursuit would be the riskiest pursuit for those suspects who have committed violent felonies. For policy implications, Madden and Alpert (1999) contend that similar analyses need to be conducted across other law enforcement agencies toward development of a pursuit decision calculus.
Research Methodology
The project sought to discover the relationship between pursuit incident variables associated with a negative or positive outcome while leading toward a risk-assessment profile.
The data analyzed for this project originated from the Georgia Association of Chiefs of Police (GACP, 2011) state certification program, which operates as a statewide accrediting authority to promulgate professional standards. In 2007, the state certification program required agencies to begin recording statistics on their police pursuits. Data collection years are from 2007 to 2010 with more than 100 agencies participating. As part of the state certification process, each agency is required to have one officer be trained (by the GACP) as a certification manager and who will be responsible for providing evidence that the agency has met standards in accordance with the accreditation process. The certification manager and agency chief executive thus have a vested interest in obtaining state certification.
The analysis of a large sample from 279 agencies over a 3-year period (2007-2009) included more than 2,155 pursuits with 11 categorical variables. To safeguard from Type I error, a random sample of approximately one third (715) of the pursuits was taken from the larger sample, and most variables that emerged as significant in the analysis were also found to be significant in the random sample analysis. Groups were assigned by agencies that reported pursuits that involved damage/injury/fatalities, and those agencies that reported pursuits with no negative outcomes. Each variable from the report had certain categories associated with the overall main factors of pursuits—officer variables, pursuit variables, and suspect variables. For this project, agencies that reported negative pursuit outcomes were variables related to officer/suspect/third-party injuries and/or fatalities.
Analysis
Because the data collection was carried out in frequencies, chi-square tests of independence were conducted to measure association among all relevant categorical, pursuit variables (road conditions, officer, suspect, and outcomes) in this study. According to Pearson’s statistical technique, chi-square will indicate larger values as the minimum association between differences is zero, which shows evidence of a stronger relationship among variables and greater support against the null hypothesis (Daniel, 1978). The characteristic of the chi-square distribution of values is that the mean is the same as the degrees of freedom in the sample. Because there are no negative numbers, the distribution is positively skewed, but approaches normality as degrees of freedom increase (Agresti, 1996). Values that exceed the critical table value of significance within the sample’s degrees of freedom can be obtained, and an inference can be made that an association exists between variables (Thompson, 2001). Chi-square analyses have assumptions and limitations. First, the sample size must be random, large, and in frequency form. Second, cases must be assigned to at least one cell in the analysis, either observed or expected. A limitation to chi-square analyses is that it measures the degree of association between variables, but little else (Agresti, 1996).
Agresti (1996) and Field (2005) indicated that Cramer’s V is a statistic that can further evaluate association by squaring the Pearson chi-square statistic and dividing by sample size and rows/columns. For this project, the dependent variables agencies associated with negative pursuit outcomes were utilized with independent variables of interest to calculate Pearson’s chi-square statistic and values for Cramer’s V to show the strength of the relationship.
Findings
The first variable that showed a significant relationship with pursuits with negative outcomes was violation. A random sample drawn from the original sample yielded a total of 966 values (Table 1).
Random Sample of Variable: Violation.
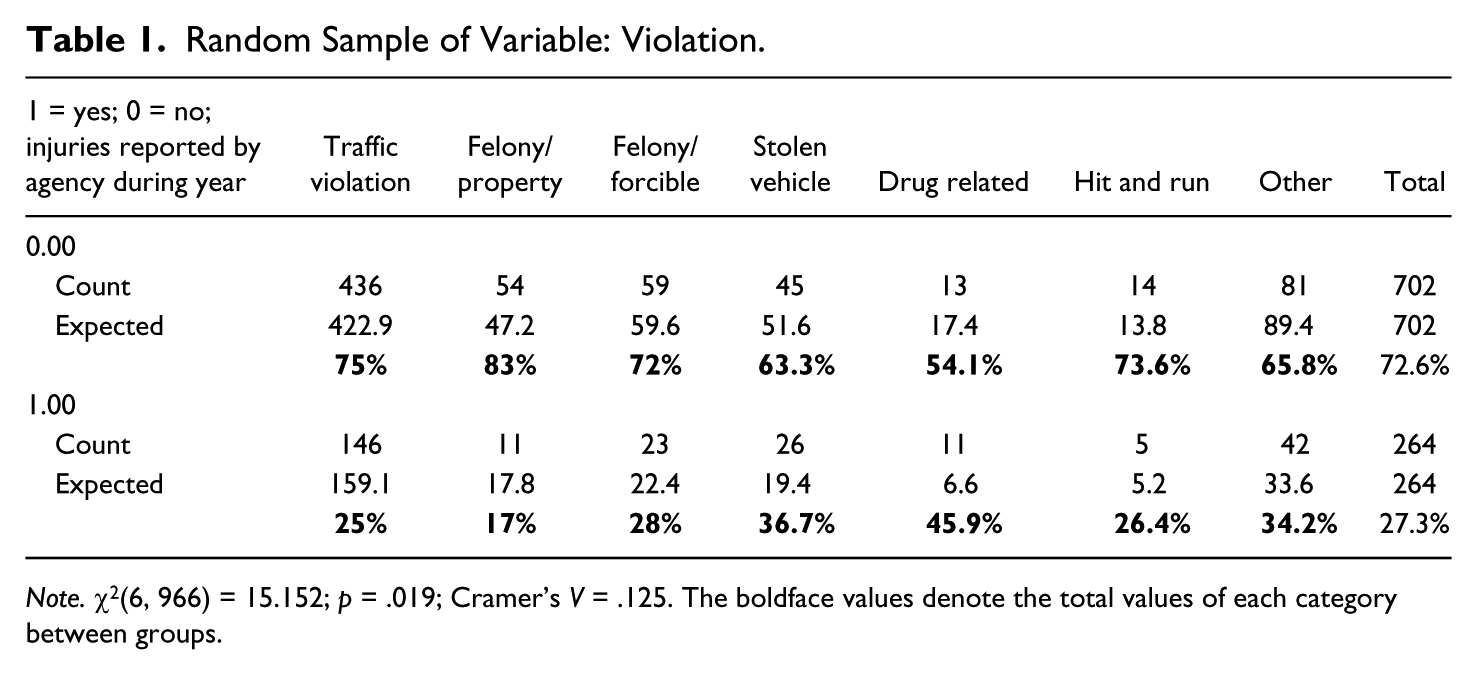
Note. χ2(6, 966) = 15.152; p = .019; Cramer’s V = .125. The boldface values denote the total values of each category between groups.
Chi-square analysis indicated a significant relationship between violation that initiated pursuit and negative outcomes of pursuits within the sample, χ2(6, 966) = 15.152, p = .019. Specifically, there was a higher than expected count for pursuits with negative outcomes and forcible felonies, stolen vehicles, drug-related, and “other” violations. Cramer’s V for this analysis was .125 (moderate relationship), and as such there is practical value associated with this finding.
Speed of pursuit was found to have a significant relationship with pursuits with negative outcomes in Table 2. Approximately 749 values for speed were obtained by randomly selecting pursuit reports from the original sample.
Random Sample of Variable: Speed.

Note. χ2(6, 749) = 20.343; p = .002; Cramer’s V = .165. The boldface values denote the total values of each category between groups.
Chi-square analysis indicated a significant relationship between speed and negative outcomes of pursuits within this sub-sample, χ2(6, 749) = 20.343, p = .002. Specifically, there was a higher than expected count for pursuits with negative outcomes for the posted speed limit and ranges of speeds (in mph) over the posted speed limit: 10 to 19, 20 to 30, and 61 and above. Cramer’s V for this analysis was .165 (strong relationship), and as such there is practical value associated with this finding.
The variable road condition was found to be significant (Table 3) from the larger sample of pursuits. The random sample drawn from the original sample of pursuits resulted in 2,380 values (original comprised 8,780 values). The variable was collapsed into similar categories, because the counts were less than 5. There were not higher than expected counts for pursuits occurring on the interstate in this sub-sample.
Random Sample of Variable: Road Conditions.

Note. χ2(6, 2,380) = 33.915; p = <.001; Cramer’s V = .117. The boldface values denote the total values of each category between groups.
Chi-square analysis indicated a significant relationship between road conditions and negative outcomes of pursuits within this sub-sample, χ2(6, 2,380) = 33.915, p = <.001. Specifically, there was a higher than expected count for pursuits with negative outcomes and pursuits that occurred at night, on two-lane roadways and outside city limits. Cramer’s V for this analysis was .117 (moderate relationship), and as such there is some practical value associated with this finding.
From the original sample, number of vehicles was found to be significantly related to the dependent variable. In Table 4, one can observe that 859 values were analyzed similar to the original sample. This variable was collapsed into four categories for analysis, because the counts were less than five.
Random Sample of Variable: Number of Vehicles.

Note. χ2(3, 859) = 66.930; p = <.001; Cramer’s V = .279. The boldface values denote the total values of each category between groups.
Chi-square analysis indicated a significant relationship between number of vehicles and negative outcomes of pursuits within this sub-sample, χ2(3, 859) = 66.930, p = <.001. Specifically, there was a higher than expected count for pursuits with negative outcomes and pursuits from one agency with two or more vehicles. Cramer’s V for this analysis was .279 (very strong relationship), and as such there is practical value associated with this finding.
Length of pursuit in time was found to be significant with negative outcome pursuits. In Table 5, one can observe that the values analyzed within the sub-sample were quite similar.
Random Sample of Variable: Length of Pursuit–Time.

Note. χ2(2, 833) = 12.261; p = .002; Cramer’s V = .121. The boldface values denote the total values of each category between groups.
Chi-square analysis indicated a significant relationship between length of time of pursuits and negative outcomes within this sub-sample, χ2(2, 833) = 12.261, p = .002. Values for short time periods were similar across categories of 3-min increments. Therefore, these categories were collapsed. Specifically, there was a higher than expected count for pursuits with negative outcomes and pursuits that lasted between 9 and 15 min, which is similar to the findings in Table 5. Cramer’s V for this analysis was .121 (moderate relationship), and as such there is some practical value associated with this finding.
The variable “pursuit termination” was evaluated with a smaller sample. From Table 6, there were 2,267 values for termination techniques, which resulted in 862 values in this sub-sample that were evaluated utilizing chi-square test for independence.
Random Sample of Variable: Termination Techniques.

Note. χ2(5, 862) = 11.527; p = .042; Cramer’s V = .116. The boldface values denote the total values of each category between groups.
Chi-square analysis indicated a significant relationship between termination techniques and negative outcomes of pursuits within this sub-sample, χ2(5, 862) = 11.527, p = .042.
Specifically, there was a higher than expected count for pursuits with negative outcomes and the PIT maneuver, stop sticks, vehicle crashing, and the pursuit discontinued. Cramer’s V for this analysis in the sub-sample was .116 (moderate relationship), and as such there is practical value associated with this finding.
Conclusion
From this project’s analysis, certain variables emerged that contributed to a typology of high-risk pursuits for the sample of Georgia pursuits. Speed, as a variable associated with negative outcomes in pursuit report analysis, has been found to be significant (Lum & Fachner, 2008; Madden & Alpert, 1999). Speed was also a variable of concern in Scott v. Harris (2007). In the case, the legal interpretation of “imminent threat” to a third party was associated with increasing speeds by the suspect and the pursuing officers. Surprisingly, a large number of values in the category of speed indicated pursuits 60 mph or more over the posted speed limit. For training and policy requirements, police departments have had restrictions on top speeds to indicate high-risk pursuits (Alpert, 1998). The importance of the supervisor regulating speed during pursuits has been a relevant theme throughout pursuit literature, legal issues concerning liability, and practitioner experiences. An officer’s decision to follow suspects at high speeds creates an unpredictable environment. Supervisor and officer decision-making are critical for this one dimension of pursuits (Alpert, 1998; Crew, Kessler, & Fridell, 1995).
Road conditions were also significant in this project, as previously noted in select literature (Alpert, 1998; Lum & Fachner, 2008; Madden & Alpert, 1999). Road conditions have been considered in pursuit policy restrictions as an important variable for discretion in pursuit continuation (Hicks, 2006; Lum & Fachner, 2008). Road conditions as part of the decision-making process during pursuits have been part of many departmental policies and included in high-speed pursuit training (Alpert, 1998; Crew et al., 1995; Hicks, 2006).
Another variable found to be significant was short lengths of pursuits. A univariate analysis indicated a significant Pearson correlation between the dependent variable and the categories of distance traveled in pursuits. For discretion in continuing the pursuit, many officers report willingness to continue is balanced by violation and severity of offense (Alpert, 1997).
Length of pursuit in time was found to have a significant relationship with negative outcomes of pursuits. The duration of pursuits is one of the salient variables indicated in previous research (Alpert & Dunham, 1989; Madden & Alpert, 1999), and one also considered for training. From a practitioner viewpoint, supervisors have to keep a mindful clock on the duration of pursuits for which they are monitoring, and this is also paramount in the calculus for the pursuing officer. The longer pursuits in this analysis indicated a relationship with agencies that reported negative outcomes. Furthermore, research has also indicated that longer pursuits factor into a suspect’s discretion to abscond from law enforcement (Alpert, 1997).
Traditionally, agencies utilize a “mutual aid” policy to assist with law enforcement emergencies across jurisdictions. Furthermore, police pursuits within one jurisdiction often require more than one police vehicle. For this project, number of vehicles and number of agencies involved in pursuits were found to be significantly related with pursuits with negative outcomes. Supervisor discretion and officer calculus involving numerous vehicles duplicating risky driving behaviors is an important factor for policy evaluation in the midst of a pursuit (Alpert, 1997).
An important variable of interest found in this project was termination techniques utilized by the pursuing police officer. Lum and Fachner (2008) found termination techniques were rarely used in their study but significantly associated with negative pursuit outcomes. As mentioned previously, the genesis of the GACP’s decision to collect data on pursuits was concerned with the termination technique at issue in the landmark Supreme Court case Scott v. Harris (2007). In an effort to capture a suspect, where pursuit discontinuation is not considered, police officers and police supervisors have few choices regarding how to end a pursuit. Various termination techniques have emerged with technological advances, but have resulted in negative as well as safe pursuit outcomes.
Implications
This project adds to the existing but minute body of literature on police pursuit research where variables are evaluated with negative outcomes. Comparable with the methods and variables obtained from previous research on police pursuits, frequency data revealed certain trends. In this project and that of Madden and Alpert’s (1999) initial Miami-Dade study, road conditions, violations, officer age, and number of vehicles were found to be significantly related to pursuits with negative outcomes. In Alpert’s (1997) additional study of 1,200 pursuit reports, violation, speed, and number of vehicles were found to be related to negative pursuit outcomes. Comparing decision-making variables with categorical data (much like the data from Alpert’s project), time of travel in pursuit, number of vehicles, and violation were found to be associated with pursuits with negative outcomes.
There is opportunity to inform the administrator and practitioner presently. From this project, 279 agencies reported 2,155 pursuits, which resulted in 205 injuries and 42 deaths. The agencies reporting these negative outcomes all reported pursuits associated with the typology of high-risk variables found in this analysis and in previous research. Although GACP establishes rules for accreditation for training in high liability areas, these directives do not precisely specify how training is to be conducted. In fact, most administrators in law enforcement enjoy discretion regarding the manner in which training is conducted within their organization. Furthermore, this project’s findings can inform and contribute to the learning process that is ongoing in understanding the dynamics of police pursuits in the state of Georgia.
Third, this project can contribute directly to the GACP in two ways. One way is through providing a summary, which describes the nature of pursuits from the sample of pursuit data; such a summary can inform directly and efficiently toward assessing pursuits for participating agencies in the accreditation program. Also, the nature of the results and its limitations can yield reform regarding how pursuit data are collected. This project utilized chi-square analyses as part of its methodology, which was due to the nature of the data recorded. GACP accepts final reports in spreadsheet format from participating agencies. Agencies have wide discretion in how they format pursuit incident reports. Therefore, GACP currently has no directive on how agencies report the data, except to report number of frequencies. A more detailed analysis can occur if pursuit data were entered by individual report. In this way, each negative outcome of a pursuit would have specific variables associated with it. Multivariate analysis finds relationships between variables more efficiently than categorical data analysis and frequency reports. The existing method utilized by GACP is probably due to the agency segueing this data collection directive to agencies that might be reluctant to report or provide actual copies of incident reports for pursuits. Future directives could provide for a standard reporting system to help inform GACP of the nature of specific pursuits abroad and in the state of Georgia, but could also provide better analysis for research endeavors.
Limitations and Future Research
Prior to any implications inferred toward complete policy reformation or specification, it should be noted there are several limitations to this research project. There are 535 law enforcement agencies in the state of Georgia. The sample of data collected by GACP originated from approximately 100 agencies per year, a smaller sample of the entire population. Furthermore, this smaller sample provided data for this analysis that informs on accredited agencies only. Accredited agencies and non-accredited agencies can have similar characteristics, but be different in many operational aspects depending on administrator discretion and policies. Therefore, generalizations made from this research project’s findings should be limited to accredited law enforcement agencies in the state of Georgia only.
This research project utilized only descriptive and non-parametric statistics. Therefore, the assumptions associated with non-parametric statistics are limited and not inferential to a larger population. Caution is advised in generalizing this project’s findings as typical pursuits in the state of Georgia. Furthermore, administrators and practitioners should only recognize the typology presented as informative. Policy changes should be based on projects that utilize multivariate analysis, and administrators can rely on the nature of pursuits within their own department to effect positive policy reform. This project’s scope of limitation should be viewed as a descriptive or characterization of police agencies, which experienced negative outcomes in police pursuits, and the associated, typical high-risk pursuit.
Future research concerning police pursuits should focus on the variables involved in the dynamics of incident. As stated previously, there is minute research focusing on capturing the variables involved in police pursuits in America. This is largely due to the trend of police agencies to not keep their own statistics, despite the suggestion of professional organizations and researchers (Alpert, 1997). Future research projects that utilize data before and after policy changes can also contribute to policy reform effectiveness. Crew et al. (1995) examined injury/fatality rates for agencies that changed from non-restricted to restricted pursuit policies. To build on this type of project, policies that have changed by restricting pursuits based on certain variables (e.g., discontinue if more than two vehicles or over a certain speed) would be influential in policy reformation. Finally, future research projects should also focus on inferential statistics to enhance analysts’ findings and implications toward policy reform. If future research utilizes such techniques, important findings could lead to a scientific calculus in decision-making processes.
The decision-making process in police pursuits is key, and currently driven by individual officer training, experience, and pursuit policy restrictions. This project’s scope was intended to inform on the type of high-risk pursuits that occur in the state of Georgia. Police pursuits are complicated and dynamic incidents that can result in dangerous and fatal outcomes. Police officers and supervisors can observe and record trends within their own department or shifts to assist in this complicated decision-making process. Knowing traffic and road condition patterns and monitoring speed variances in the midst of a pursuit can affect the decision to continue or discontinue the pursuit. Training officers can update officers on effective termination measures and proper management of pursuits between jurisdictions. Finally, administrators can adjust their agency pursuit policies dependent on the number of pursuits reported during the year. If anything can be gleaned from this project’s findings, it is that agencies that have higher frequencies of pursuits—which involved variables associated with negative outcomes—reported an injury or fatality for that year. Administrators concerned with public safety, officer safety, and liability, can do well to monitor their officers’ pursuits and maintain a fluid policy of restrictiveness based on safety and law enforcement objectives.
Footnotes
Declaration of Conflicting Interests
The author(s) declared no potential conflicts of interest with respect to the research, authorship, and/or publication of this article.
Funding
The author(s) received no financial support for the research, authorship, and/or publication of this article.