



Abstract
Purpose:
There is a growing body of evidence that the built environment influences diet and exercise and, as a consequence, community health status. Since long-haul truck drivers spend long periods of time at truck stops, it is important to know if this built environment includes resources that contribute to the emotional and physical well-being of drivers.
Setting:
The truck stop environment was defined as the truck stop itself, grocery stores, and medical clinics near the truck stop that could be accessed by a large truck or safely on foot.
Design:
Researchers at the National Institute for Occupational Safety and Health (NIOSH) developed and utilized a checklist to record the availability of resources for personal hygiene and comfort, communication and mental stimulation, health care, safety, physical activity, and nutrition at truck stops.
Subjects:
The NIOSH checklist was used to collect data at a convenience sample of 16 truck stops throughout the United States along both high-flow and low-flow truck traffic routes.
Measures:
The checklist was completed by observation within and around the truck stops.
Results:
No truck stops offered exercise facilities, 94% lacked access to health care, 81% lacked a walking path, 50% lacked fresh fruit, and 37% lacked fresh vegetables in their restaurant or convenience store.
Conclusion:
The NIOSH found that most truck stops did not provide an overall healthy living environment.
Purpose
It is generally accepted within the medical and public health communities that diet and exercise are 2 important determinants of individual health. 1,2 Furthermore, there is a growing body of evidence that the built environment influences these determinants and, as a consequence, community health status. The built environment is generally defined as the man-made surroundings such as buildings, transportation systems, parks, and other man-made structures. 3
Some studies report a negative relationship between body mass index (BMI) and access to a supermarket 4,5 and a positive relationship between BMI and access to either convenience stores 6 or fast-food restaurants. 7,8 A more recent study using a longitudinal regression model demonstrated that increases in density of both supermarkets and commercial physical activity facilities reduced BMI by 5.46 to 7.36 lbs/ft2 among men. 9
Truck drivers, by virtue of their occupation, are often constrained for long periods of time to specific built environment, such as loading docks, truck stops, trucking terminals, highway rest areas, and truck cabs. Drivers spend time in these locations not only during their working day but also during off-duty periods since parking for large trucks can be difficult to find at other locations. Long-haul truck drivers (LHTDs) carry freight on delivery routes that require sleep periods away from home. A recent survey of LHTDs found that 62.9% of drivers sleep at home less than 7 days each month. 10 As a consequence, they often spend long periods confined to truck stops when they are working. This makes the truck stop environment integral to the daily lives of LHTDs.
For people to make changes in behavior that improve their health requires support for the change at the individual, environment, and social levels. 11 For truck drivers, the truck stop defines an important environment level of support for individuals to make choices related to diet and exercise. Studies indicate that the truck drivers’ work environment provides few opportunities for healthy food and exercise. 12 -14 Given the time truck drivers are restricted to the truck stop environment, it is not surprising that studies have found truck drivers are less likely to exercise regularly or make healthy dietary choices than the general population, 12,15 -17 or that a recent survey of LHTDs found that 89% of truck drivers had a BMI greater than 25. 10 The availability of healthy food and exercise options in the truck stop environment is a critical element for supporting truck drivers’ ability to improve their health.
To better understand the truck stop environment, researchers from the National Institute for Occupational Safety and Health (NIOSH) developed a checklist designed to record resources available at truck stops that might contribute to the emotional and physical well-being of drivers. The checklist expands previously reported information through the inclusion of items describing the availability of nutritious food in restaurants and convenience stores at and near truck stops. Using the checklist, NIOSH researchers collected data at a convenience sample of 16 truck stops across the United States along both high-flow and low-flow highway segments. Data for this study were collected concurrently with quality assurance site visits by NIOSH staff during the National Survey of Long-Haul Truck Driver Injury and Health (LHTDS), a nationwide survey of LHTDs. 10 In this article, the authors use data collected with the checklist, as well as selected data collected as part of the LHTDS, to describe resources available to LHTDs for personal hygiene and comfort, communication and mental stimulation, health care, safety, physical activity, and nutrition in the truck stop environment.
Methods
Setting
For this study, the truck stop environment was defined as the truck stop itself, along with restaurants, grocery stores, and medical clinics near the truck stop that could be accessed safely on foot or accessed by tractor-trailers, also known as 18-wheelers. Tractor-trailers are representative of the size and weight of trucks typically used by long-haul drivers. Information on truck stop indoor and outdoor amenities, convenience store healthy food options, and restaurant/fast-food healthy food options were collected by NIOSH researchers from October to December 2010.
Design
The approach for this truck stop study was to collect data on truck stop amenities at a portion of the 32 truck stops used in the LHTDS. This allowed NIOSH researchers to collect information on truck stops amenities at the same time that they were conducting quality assurance audits of the LHTDS. The truck stops in this amenity study were derived from the methodology used to generate the LHTDS, however; LHTDS sample weights cannot be used to generate national estimates for the truck stop amenities reported in this study. Since the truck stops in this amenity study are a subset of the truck stops in the LHTDS, a brief description of the sample strategy LHTD survey is appropriate. More details on the LHTDS sampling strategy and design are available in the article by Sieber et al. 10 The sample of truck drivers in the LHTDS was selected in 3 stages, the first 2 of which selected the sampled truck stops and the final stage selected the sampled truck drivers. In the first stage, limited-access highway segments were stratified by geographic region and truck traffic volume. Truck traffic volume was defined as either high flow (12 500 or more trucks/day) or low flow (less than 12 500 trucks/day). The number of high-flow state highway segments in each geographical region was selected proportional to the length in miles of limited-access highway in that region. Low-flow state highway segments were selected with probability proportional to that state’s population. Once highway segments were selected, a national truck stop list was used to select those stops that had a restaurant and at least 5 paved parking spaces 18 ; the selection probability was proportional to the number of parking spaces. The sample pool of qualifying truck stops included 1490 independent truck stops and 918 chain truck stops, from which the LHTDS collected truck driver information at 32 truck stops.
Sample
The 16 stops visited by NIOSH researchers for the truck stop amenity study were a convenience sample selected based on limited travel funds, proximity to NIOSH facilities, and ability to combine multiple truck stop visits into single travel events. Of the 16 stops in the study, 3 were independent truck stops and 13 belonged to 3 different truck stop chains (chain 1: n = 7, chain 2: n = 4, chain 3: n = 2); the percentage of truck stops on high- and low-flow highway segments was similar to the full LHTDS sample. The geographic distribution of the 16 truck stops is shown in Table 1 and Figure 1. When high-flow samples are compared with the LHTDS, the truck stop amenity study had proportionately fewer truck stops in the Central and Great Lakes regions and proportionately more in the Northeast and South regions. Four of the 6 low-flow trucks stops from the LHTDS were included in the truck stop amenity study. Most (75%) of the truck stops in the amenity study were located along high-flow truck traffic routes. The number of overnight truck parking spots ranged between 20 and 800, with an average 231 spaces per stop. Average parking space occupancy was 47% during the day and 82% at night. The number of drivers visiting the truck stop varied between 10 and 4000 drivers on weekdays and between 5 and 2500 drivers on weekends.
Sample Geographic Distribution for the LHTDS and the Pilot Study of Healthy Living Options at 16 Truck Stops Across the United States.
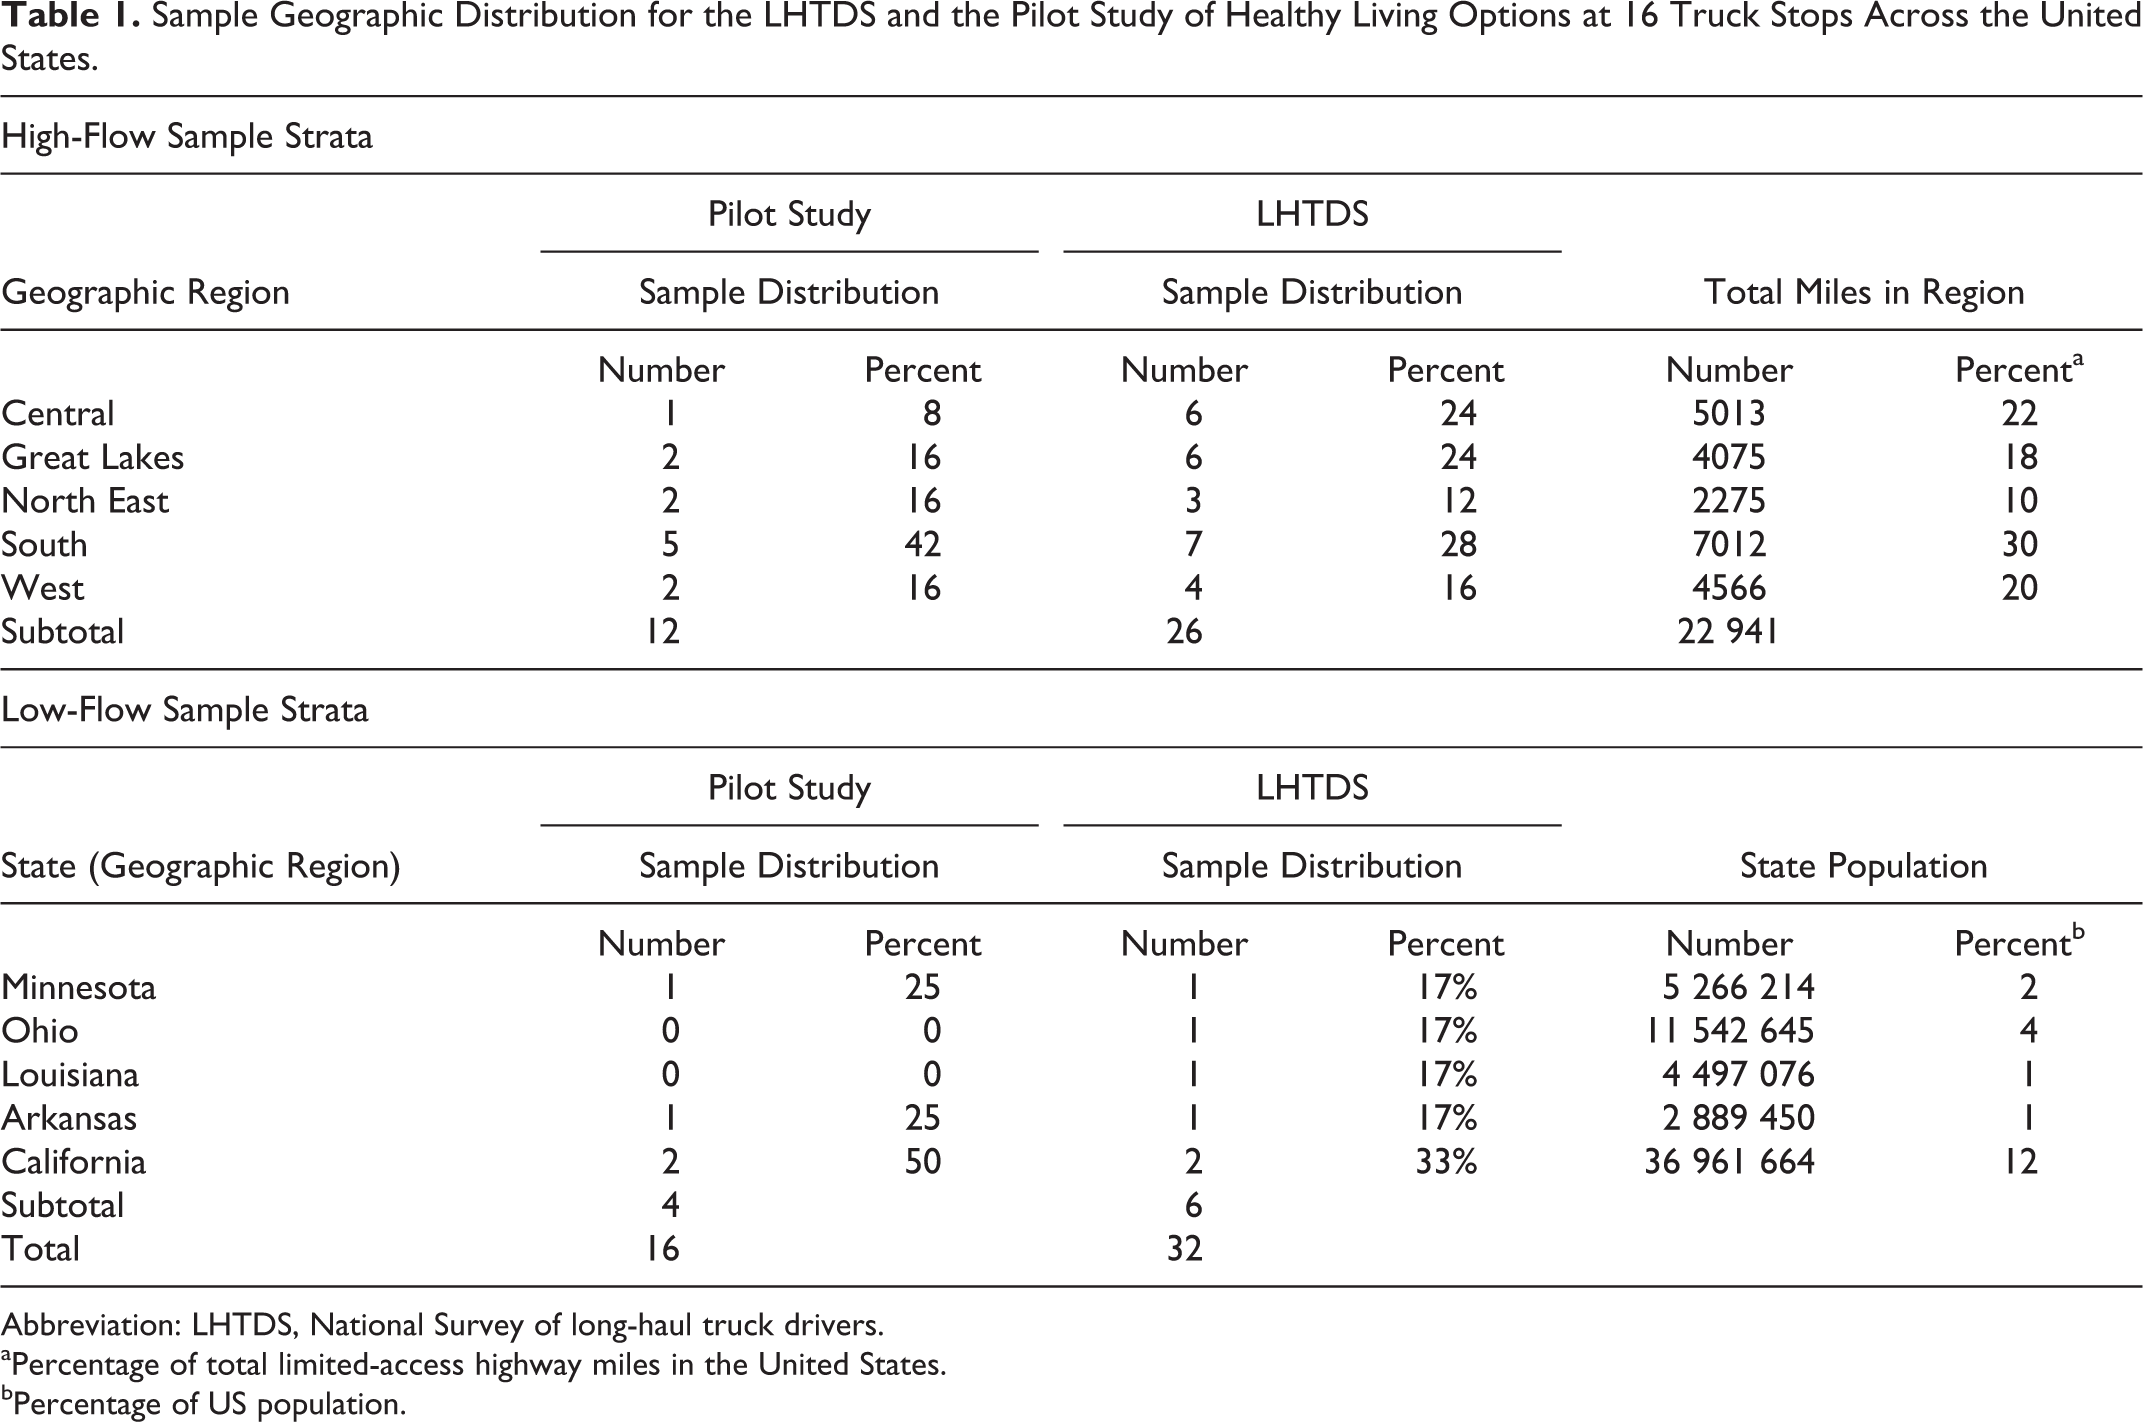
Abbreviation: LHTDS, National Survey of long-haul truck drivers.
aPercentage of total limited-access highway miles in the United States.
bPercentage of US population.

Geographical Distribution of the 16 Truck Stops in the United States.
Measures
At all 32 truck stops in the LHTDS, information was obtained on truck stop characteristic by interviewing the truck stop owner or manager. Data on these characteristics were extracted from the LHTDS for the 16 truck stops for this article. Results abstracted from the LHTDS for this article include the availability of motels/hotels, Internet kiosks, wireless Internet, and parking lots that allowed only trucks to enter, while remaining results pertaining to other living environment characteristics were collected by NIOSH researchers via direct observation using a checklist developed by NIOSH. Truck stops were visited over a 3-day period during daylight and nighttime time periods. The checklist took approximately 4 hours to complete over the 3 days.
The checklist consisted of 5 sections: truck stop indoor amenities, truck stop outdoor amenities, convenience store healthy food options, energy products, and restaurant/fast-food healthy food options, with space for comments from the data collector if they needed to further describe the environment. The data collector recorded the presence of a checklist item by checking or circling it on the form, or in the case of energy products, recording the number of different products available. Energy products were defined as any beverage, shot, or pill that claimed it would increase the consumer’s energy or alertness. Energy products were tallied by brand; the different varieties within brand were not captured. To reduce interrater variability, 2 NIOSH researchers independently collected information on the checklist at the first 2 truck stops visited. At both truck stops, the researchers reviewed and discussed each element of their ratings to assure all future checklists were completed in a consistent manner. No further interrater variability assessment was done to further validate the survey instrument.
Facilities were considered to be nearby if they could safely be accessed by foot or tractor-trailer and seen from the truck stop. Parking lots were considered to be well lit by NIOSH researchers if functioning lighting was observed positioned throughout the parking lot including parking lot edges.
The availability of nutritious food was ascertained by NIOSH researchers in the truck stop convenience store by observing displayed items and in truck stop restaurants by viewing the menus and salad bars. In the convenience store, healthy foods were defined as (1) fresh fruit or vegetables; (2) packaged (frozen, canned, or dried) fruit if it did not have added sugar or fat; and (3) packaged vegetables, entrees (canned/frozen meals), and prepared snacks if they met or exceeded the US Food and Drug Administration (FDA) guidelines for low-fat and low-sodium foods, which require 3 g of fat or less and 140 g of sodium or less per reference amounts customarily consumed. 19
Restaurant menus did not contain dietary information. Restaurant foods were considered healthy if they were advertised as cooked with little or no added oil (ie, baked, broiled, steamed, or poached); healthy animal proteins included white-meat poultry, shellfish, or any fish, including salmon; healthy salads needed to have greens other than iceberg lettuce that is considered to have low nutritional value; and healthy vegetarian dishes included fresh vegetables and needed to be low in sugar and be foods other than white potatoes or white rice, which have high glycemic loads and are considered to be of low nutritional value. While not an exhaustive list, we felt these options were the healthy choices most likely to be available.
All data are reported as percentages. Data extracted from the LHTDS were analyzed using the PROC/FREQ procedure generated using (SAS/STAT) software, copyright (2002-2010) SAS Institute Inc., Cary, NC, USA.
Results
Table 2 shows the physical amenities available at the 16 checklist truck stops. Only showers were universally available; more than 81% lacked a walking path, grocery store, or a barber/hair salon; 94% lacked any type of health-care facilities accessible to the drivers. Most truck stops had a laundry, motel/hotel, driver lounge, full-service restaurant, and/or fast-food available either at the truck stop or nearby. None of the truck stops visited offered designated exercise facilities. Only 6% had parking areas that restricted nontruck drivers and few had adequate lighting in the truck parking area.
Percentage of Truck Stops With Selected Physical Amenities at 16 Truck Stops Across the United States.
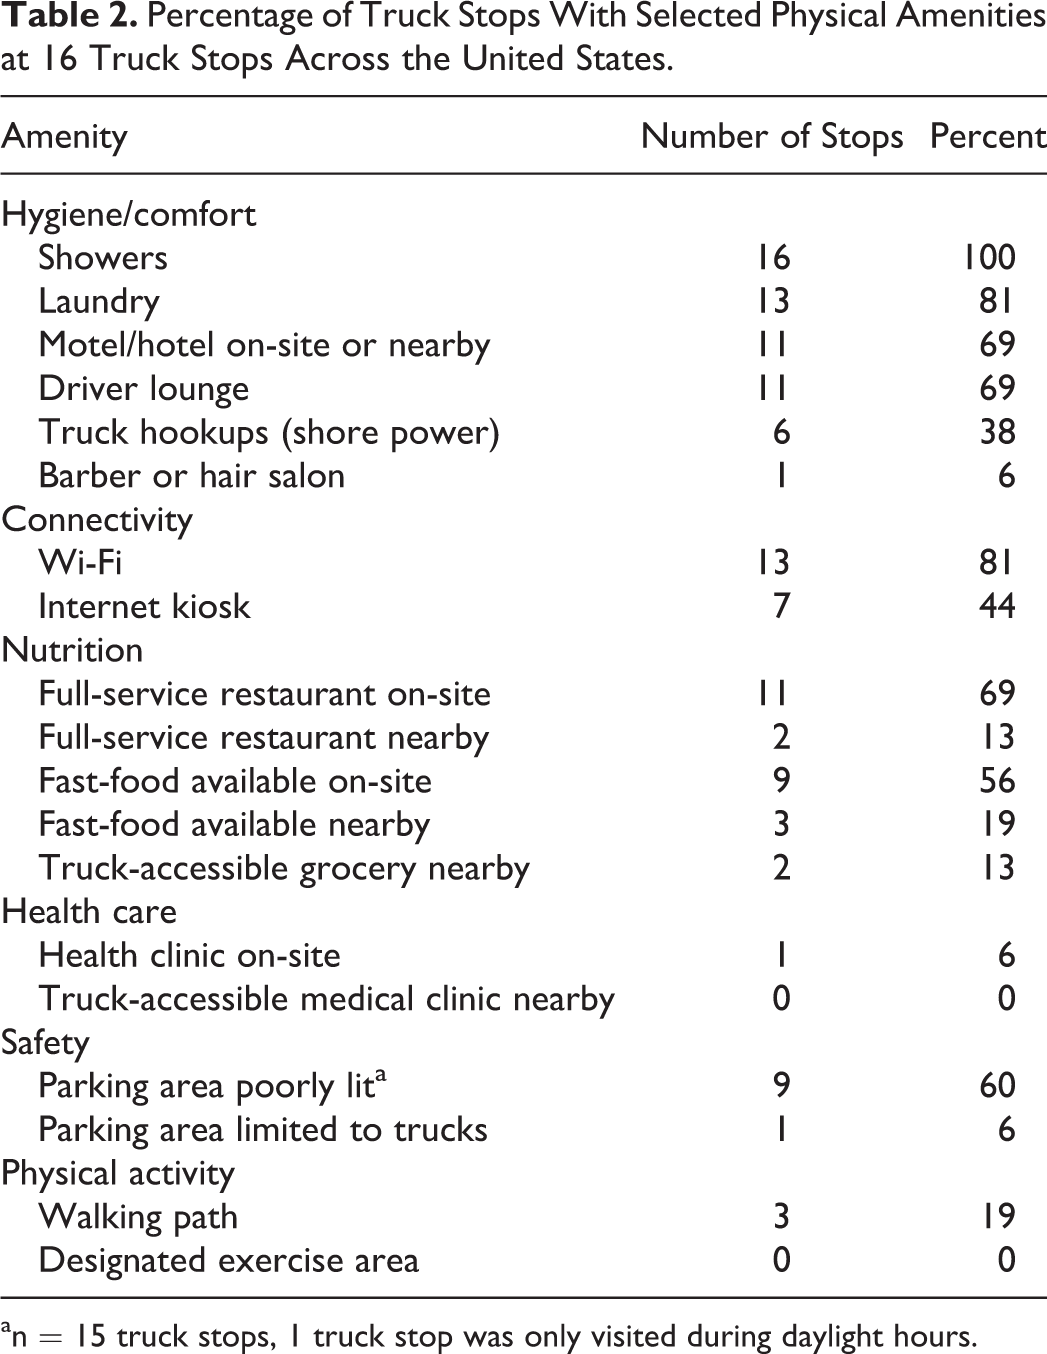
an = 15 truck stops, 1 truck stop was only visited during daylight hours.
All of the truck stops had at least 1 convenience store and some form of restaurant (either full-service or fast-food). Where there was more than 1 restaurant option, healthy food availability was assessed at all restaurants using a single checklist. Table 3 shows the percentage of the 16 truck stops with specific healthy food options available at restaurants (full-service and/or fast-food combined) and convenience stores. Truck stop restaurants offered a healthy animal protein at 94% of stops and a healthy vegetable at 75% of stops; the most common healthful food options available in restaurants were white-meat poultry (88%) and vegetable/vegetarian dish (75%). Convenience stores offered a healthy fruit at 75% of truck stops, healthy snacks at 44% of stops, and a healthy vegetable at only 6% of stops; none of them offered a healthy prepared entrée.
Available Healthy Food Options at 16 Truck Stops Across the United States.

aThree gram or less fat and 140 g or less sodium per serving.
The number of energy shot and pill brands offered at the 16 truck stops was tabulated. The average number of energy brands available was 15 (range: 5-30). The average number of energy shot and pill brands at each truck stop was 6 (range: 0-12; data not shown).
Discussion
Our pilot study found that while the truck stop environment generally provided opportunities for personal hygiene such as showers and laundries, and connectivity via wireless Internet, we consider them to be deficient for healthy living options. The environment rarely provided opportunities to obtain health care, lacked healthy food choices when there is no time to stop for a restaurant meal, and rarely provided options that encouraged physical activity. Furthermore, safety in the parking lot was less than optimal, as almost all stops allowed anyone to drive into the parking area, and lighting was often inadequate, which may discourage exercise around the parking area.
The truck stop environment did not provide ready access to medical care. Our pilot study found that 94% of the truck stops visited did not have a health-care clinic on-site or nearby. Results from the LHTDS showed that 18.3% of the drivers delayed or did not receive needed health-care treatment in the past 12 months. 10 Other studies have shown that truck drivers had challenges finding health care, were more likely to self-medicate, and were dissatisfied overall with health-care access while on the road due to parking lot and driveway accessibility limitations for large trucks with trailers. 17,20 -22
The truck stop environment generally did not help patrons meet the US Department of Agriculture (USDA) guidelines for diet. For average adults needing 2200 calories daily, the USDA Food Pattern recommends 2 cups of fruit and 3 cups of vegetables every day. 23 To help Americans meet this recommendation, the Dietary Guidelines Advisory Committee suggested improving the availability of fresh produce; yet, 38% of truck stops did not carry any fresh vegetables in either their restaurant or convenience store. 2 Healthy food was more likely to be available in the truck stop restaurants, although 25% of these did not have both a healthy animal protein and healthy vegetarian dish on the menu. Restaurant menus did not contain specific dietary information. Studies have shown that given a choice, drivers would choose healthy food options but may not know which food options are truly healthy. 24,25
Thirty percent of truck drivers report “sometimes” or “often” being given an unrealistically tight delivery schedule. 26 Furthermore, around 59% of drivers are paid by the mile, meaning that they don’t make money unless they are driving, and 46% are penalized for a late pick up or delivery. 27 These time and financial pressures can compel drivers to rely on the convenience store rather than taking time for a sit-down meal. Convenience store meal options were the only quick food option at 25% of the stops we visited where no fast-food restaurant was available. Only 1 of the 16 convenience stores offered a healthy vegetable, and none offered a healthy entrée. Fruit was easier to find, either fresh or frozen/canned/dried with no sugar added or fat, although 25% were lacking this as well. These results are similar to a study that found 8 truck stops on the East Coast to be “not at all supportive” of healthful eating. 14 Grocery stores have greater availability and quality of healthy food choices than restaurants and convenience stores 28 ; however, truck-accessible grocery stores were rare in our study, the time required to shop for and prepare these foods may be difficult for truck drivers, and trucks are not always outfitted with refrigerators or microwaves.
Obesity is a significant problem among truck drivers. A diet low in added sugars, moderate fat intake, and adequate physical activity can help individuals to prevent or reverse obesity, which, along with a diet low in sodium, reduces the risk of hypertension, stroke, and heart disease. 23 The LHTDS study found that more than one-quarter of long-haul drivers reported a diagnosis of hypertension and 89% had a BMI greater than 25. 10 Lack of physical activity is a significant contributor to obesity. The Physical Activity Guidelines for Americans recommends that adults engage in moderate-intensity aerobic activities for at least 150 min/week or of vigorous-intensity aerobic activities for at least 75 min/week. 29 The LHTDS measured the number of days in the previous week that LHTDs engaged in moderate to vigorous physical activity (MVPA) for at least 30 minutes at a time; Sieber et al10 found that 27% of LHTDS participants did not engage in any MVPA the previous week. Birdsey et al15 found that only 26% of male and 20% of female LHTDS participants engaged in MVPA 5 or more days/week. These physical activity levels are similar to other surveys where approximately 10% of truck drivers claimed vigorous activity 3 times a week. 12,17,30
The lack of safe walking areas combined with poor lighting and hazards posed by walking around moving vehicles are strong deterrents for truck drivers who might otherwise utilize their time at the truck stop obtaining exercise. In our pilot study, it was rare to find a walking path (including sidewalks), and there were no designated exercise areas at any of our 16 stops; few truck stops had adequate lighting (40%), and only 6% had parking areas solely for trucks. Studies have shown that drivers sometimes walk around the parking area for exercise, but they run the risk of being struck by vehicles, especially at night in lots with inadequate lighting. 31,32 As with our study, Apostolopoulos et al 14 also found that truck stops (n = 8) were “not at all supportive” of active living. The truck stop environment should be designed to encourage physical activity of truck drivers.
Truck stop parking lots are vulnerable to crime, which jeopardizes drivers’ safe and undisturbed rest. 33,34 All but 1 stop in our study allowed anyone to access the truck parking area, and 9 (60%) of the 15 stops were poorly lit after dark. Truck stops could improve safety and reduce disturbance by increasing their lighting and restricting access of the truck parking area to only truck drivers. One study suggested that increasing lighting and security at truck stops may reduce solicitation of truck stop patrons by sex workers and drug dealers. 35 Some research has shown improved lighting can reduce crime in parking areas. 36,37
In recent years, some truck stops, including some from our study, have increased healthy options on restaurant menus and provided walking areas and exercise facilities. 38,39 Additionally, at least 1 truck manufacturer has developed an optional “gym” for their trucks. As the Federal Motor Carrier Safety Administration has proposed a mandatory sleep study for any driver with a BMI ≥35, drivers may welcome any opportunity to help them achieve a healthy weight. 40
Strengths and Limitations
This pilot study was conducted in conjunction with a large nationally representative survey of LHTDs to characterize the truck stop environment, which is an integral part of the LHTD’s daily work life. We developed a simple checklist and used well-defined FDA product labeling and definitions to allow quick and accurate data collection on a subset of truck stops while conducting quality control visits for LHTDS. 19 This allowed us to collect valuable data about the truck stop environment without drawing resources away from the main truck driver survey.
Limitations to our study include the small number of truck stops that NIOSH researchers were able to visit due to limited resources. The small sample size and the convenience nature of the truck stop selection process mean the results are not representative of all truck stops in the country. For example, in our study, independent truck stops represented 19% of the visited truck stops, but 62% of truck stops in the United States. Forty-four percent of the truck stops visited were from a single truck stop chain, but that truck stop chain only represents 4.6% of the truck stops in the sample frame. Nevertheless, our study is strengthened by the wide geographic distribution of the 16 selected truck stops, which suggests our results are not limited to a single state or small geographic area. A larger-scale survey should be conducted to fully understand the magnitude of health and wellness barriers at truck stops. The stratified sample strategy used in the LHTDS could be used to select a representative sample of truck stops for such a full-scale study of healthy options at truck stops.
Other limitations are related to the checklist and how it was administered. The lighting around truck stop parking areas was rated by visual observation and not objectively with specialized equipment, and noise was not assessed at all. Restaurant menus did not contain similar dietary information to the packaged food in the convenience store; therefore, available healthy options could only be tabulated through visual observations not through actual dietary information. Lack of dietary information on truck stop menus is a challenge not only for researchers conducting this study but also for truck drivers who might like to make healthier eating choices. The checklist for available food items was not comprehensive and did not include items like whole-grain breads, vegetable proteins, portion size, or a measure of the number or diversity of healthy items available. The checklist also did not capture any other food or beverage options such as fried food, coffee, or sugary drinks. Checklist data were subject to observer bias and inconsistency between observers. To achieve better consistency, a standard checklist was used and both researchers independently used the checklist at 2 truck stops, discussing and reconciling differences among their checklists while still at each of the 2 truck stops. Future research should evaluate checklist instrument for interrater reliability and validity and implement a similar sampling strategy to the LHTDS to achieve more nationally representative results.
Conclusions
Many LHTDs spend multiple nights away from home when they are working and are subsequently dependent on the built environment of the truck stop to provide for their daily needs. The current pilot study found that most truck stops did not provide an overall healthy living environment, as only 6% of the truck stops offered fresh vegetables in convenience stores and no truck stop offered drivers designated exercise facilities. This pilot study underscores the limited access to healthy food and exercise options for this working population at the truck stops evaluated and raises important questions about the adequacy of the truck stop environment for promoting a healthy lifestyle among LHTDs. Widespread efforts to provide healthy food and opportunities for safe physical activity at truck stops are needed for the health of these workers.
So What? Implications for Health Promotion Practitioners and Researchers
What is already known on this topic?
Truck stops are integral to the daily lives of long-haul truck driver (LHTDs) since these workers spend long periods away from home confined to facilities that can accommodate their large vehicles. It is accepted that diet and exercise contribute to the overall health. Long-haul drivers have a high prevalence of obesity, and research has demonstrated an association between built environment and body mass index.
What does this article add?
This study assessed the healthy living options at a sample of truck stops geographically dispersed throughout the United States and found few opportunities for safe physical activity and healthy eating.
What are the implications for health promotion practice or research?
Understanding the built environment of truck stops can inform federal agencies and industry leaders in their efforts to help truck drivers improve and maintain their health.
Footnotes
Authors’ Note
The findings and conclusions in this report are those of the authors and do not necessarily represent the views of the National Institute for Occupational Safety and Health (NIOSH). This author worked at NIOSH, DSR, at the time of data collection
Acknowledgments
The authors wish to thank David Fosbroke, Ryan Olson, Caroline Smith, and Douglas Wiegand for their helpful comments; Teri Jacobs for preparing the map in  ; Westat Inc for providing data collection and statistical support; and anonymous reviewers. Finally, they wish to thank the participating truck stops, without whom this data collection would not have been possible.
Declaration of Conflicting Interests
The author(s) declared no potential conflicts of interest with respect to the research, authorship, and/or publication of this article.
Funding
The author(s) disclosed receipt of the following financial support for the research, authorship, and/or publication of this article: This work was supported by the National Institute for Occupational Safety and Health with partial funding from the Federal Motor Carrier Safety Administration, U.S. Department of Transportation.