




Abstract
Purpose:
The purpose of this study was to quantify the performance of organizations’ worksite health promotion (WHP) activities against the benchmarking criteria included in the Well Workplace Checklist (WWC).
Design:
The Wellness Council of America (WELCOA) developed a tool to assess WHP with its 100-item WWC, which represents WELCOA’s 7 performance benchmarks.
Setting:
Workplaces.
Participants:
This study includes a convenience sample of organizations who completed the checklist from 2008 to 2015. The sample size was 4643 entries from US organizations.
Measures:
The WWC includes demographic questions, general questions about WHP programs, and scales to measure the performance against the WELCOA 7 benchmarks.
Analysis:
Descriptive analyses of WWC items were completed separately for each year of the study period.
Results:
The majority of the organizations represented each year were multisite, multishift, medium- to large-sized companies mostly in the services industry. Despite yearly changes in participating organizations, results across the WELCOA 7 benchmark scores were consistent year to year. Across all years, benchmarks that organizations performed the lowest were senior-level support, data collection, and programming; wellness teams and supportive environments were the highest scoring benchmarks.
Conclusion:
In an era marked with economic swings and health-care reform, it appears that organizations are staying consistent in their performance across these benchmarks. The WWC could be useful for organizations, practitioners, and researchers in assessing the quality of WHP programs.
Introduction
As the 20th century began, improvements in public health and medicine resulted in a decided decrease in death and infirmity from infectious diseases in the United States. 1 Consequently, the American population saw increasing rates and earlier onset of chronic health conditions. 2,3 One result of this was growing employer recognition of working-age adults at risk of long-term health issues that negatively impacted absenteeism, presenteeism, productivity, and health-care costs for organizations. 4 As the costs of health care have continued to climb faster than the rate of general inflation in the United States, employers have sought to gain greater control over employee-based insurance costs by seeking strategies that may reduce employee risk.
Although employer worksites have been viewed as a setting in which public health efforts have significant opportunities to improve the health of populations, worksite health promotion (WHP) or “worksite wellness” has gained momentum and is now considered a key initiative nationally. In 2011, the US Centers for Disease Control and Prevention (CDC) began the National Healthy Worksite Program designed to assist employers in implementing health protection and promotion strategies that lead to specific, measureable health outcomes to reduce chronic disease rates. 5 Additionally, Healthy People 2010 recommended that companies take a comprehensive approach to worksite wellness that includes 5 components—health education, supportive social and physical environments, integration of the worksite program into the organization’s benefits and human resources infrastructure, linking related programs such as employee assistance programs into WHP, and screening programs linked to counseling and medical care to ensure follow-up. 6 A large number of worksites have been responsive to WHP efforts. A 2015 survey showed 81% of US companies reported offering some level of worksite wellness programming covering 64.7 million employees, although only 6% to 13% of worksite programs incorporate each of the components recommended by Healthy People 2010. 7,8
Given the increasing number of companies investing in worksite wellness and the disparity in programs adopting a comprehensive approach, definitive standards of worksite wellness programs’ success and quality indicators have proved elusive. Attempts have been made to benchmark criteria needed to establish best practices in worksite wellness. Through these attempts, a variety of checklists have been developed in the private sector, government, and academia in an effort to evaluate and benchmark organizational practices related to WHP.
Among these are checklists developed to measure employees’ perceptions of health promotion within organizations, including factors such as leadership support, social support, and organizational support (eg, Worksite Health Climate Scale, 9 Lifegain Health Culture Audit, 10 and the Organizational Health and Safety Survey 11 ). These checklists offer a self-reported employee perspective of WHP, which could be supplemental to checklists that measure organizational practices. At least 10 checklists have been developed to measure environmental factors such as support, strategies, and processes for WHP (eg, the Well Workplace Checklist [WWC], 12 Health Enhancement Research Organization (HERO) Scorecard, 13 and the CDC Worksite Health Scorecard 14 ). 15 Based upon the reviews of these checklists and prior literature as well as expert panel interviews, recommended guidelines for best practices have also been identified. 16 –18 Key components of best practices are in consonance with benchmarks referenced across various checklists, such as comprehensiveness of programs, leadership support, data and evaluation, implementation of programs, communication, and engagement of employees. 16 –18 Recently, checklists have been used by researchers to assess the relationship between benchmarks and health-care costs 13 and public health agencies to make assessments and to guide employers in WHP practices. 19 The use of these checklists by both researchers and practitioners along with the overlap in emphasis on organizational supports and programming suggests some element of face validity among experts in the field.
The Wellness Council of America’s WWC
One checklist, the WWC, was initiated in the 1990s by the Wellness Council of America (WELCOA). It was developed as a means to measure a continuum of worksite wellness practices within organizations across 7 quality benchmarks. The WWC is a 100+ item inventory that assesses an employer’s quality and quantity of support for workplace wellness. Specifically, the following 7 components of organizational wellness programming and support are measured by this assessment: Benchmark 1—CEO’s and upper management support for the organization’s wellness initiative. Benchmark 2—Composition and adoption of a team-based approach to organizational health management. Benchmark 3—Collection of data to drive both organizational health improvement and individual employee health enhancement. Benchmark 4—An emphasis on strategic planning to ensure a systematic, well-thought-out approach to creating a healthier, more productive workplace. Benchmark 5—Evidence-based, health improvement interventions designed to reach all employees. Benchmark 6—Creation of health-promoting environments to support individual attempts at changing personal behaviors. Benchmark 7—Evaluation of key organizational health outcomes to reinforce successful approaches and identify areas of untapped opportunity.
Originally developed as a paper-and-pencil instrument, the WWC has migrated into an interactive, online assessment tool that is publicly available to organizations. As part of the development and ongoing refinement of the WWC, WELCOA conducts systematic literature reviews, expert interviews, and pilot testing to ensure that this assessment is reflective of the current workplace wellness peer-reviewed literature as well as the evidence-based practice of prevailing organizational expert viewpoints. Since 2008, the WWC has been completed more than 5000 times by business leaders, health-promotion professionals, and consultants throughout North America.
Purpose
No comprehensive analysis has been conducted on how companies are performing against a variety of standards of program quality. Thus, the purpose of this article is to report on the performance of organizations’ worksite wellness programs as measured against the WELCOA 7 benchmarks included in the WWC. These data include over 4000 entries from US companies from 2008 through 2015. This report provides insights into the performance among worksite wellness programs and contributes to the ongoing dialogue about quality in WHP. This study seeks to further the conversation and research regarding the quality, and ultimately the effectiveness, of WHP programs to help improve the health of workers by reporting on organizational performance over an 8-year period.
Methods
Development of the WWC
The WWC was developed using the following protocol. Initially, a comprehensive review and analysis of the existing worksite wellness peer-reviewed literature was undertaken by gathering and analyzing more than 100 scientific studies that appeared in a number of previously published meta-evaluations. Only studies that were conducted in workplace wellness settings, used quasi-experimental or experimental designs, and were published in peer-reviewed journals were included in the review. Each published study was systematically examined using an itemized scorecard to capture the findings postulated to be most responsible for bringing about critical improvements in employee health status. Any new findings uncovered during this phase were then categorized under the previously mentioned 7 components of effective workplace wellness programs and, subsequently, converted into additional checklist items.
With the literature review and checklist process being completed, a beta version of the WWC was created. To ensure the appropriateness of the content, the WWC was subjected to a number of external peer reviews. Initially, 14 national thought leaders in the field of workplace wellness were identified and agreed to complete the WWC and give constructive feedback. After completion, each expert was then interviewed via telephone and their feedback was collected and, where appropriate, incorporated into the checklist.
To further ensure the utility of the WWC, business leaders from 157 small-, medium-, and large-sized companies were identified and contacted to complete the assessment. Upon completion, each participant was sent a brief survey to obtain feedback about the WWC content and their user experience with the new online interface. After analysis of this feedback, final changes were incorporated into the WWC and the online platform was officially released via WELCOA’s public website.
Measures
The WWC includes demographic questions about the participating organization, basic questions about their wellness programs, and 100 questions covering the WELCOA 7 benchmarks. Demographic questions included items such as company size, industry type, and unionization. Questions about organizations’ wellness programs include items such as how long programs have been in place, how programs are paid for, and organizations’ reasons for implementing wellness programs.
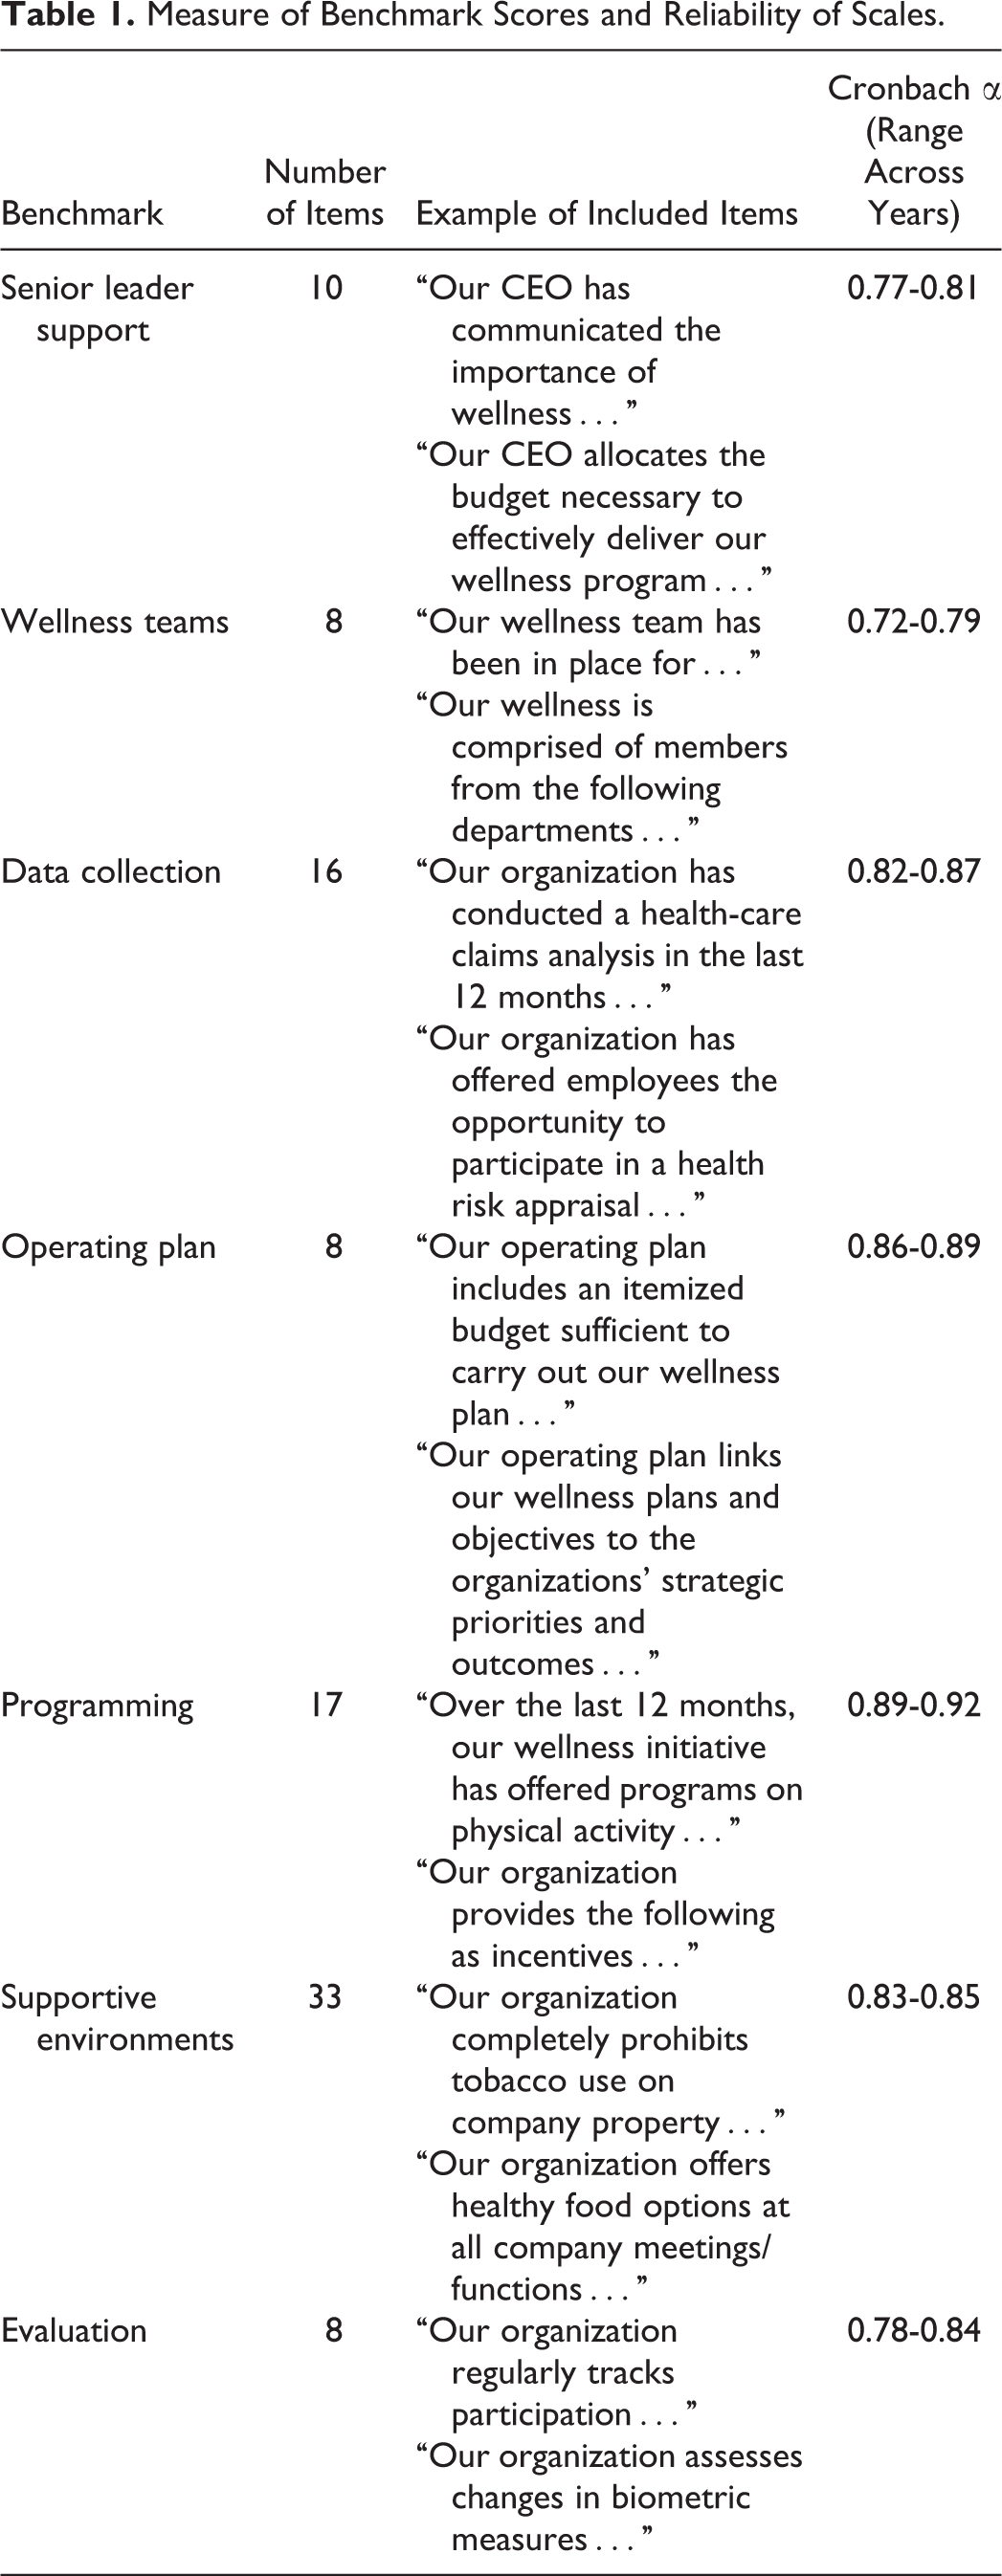
Each of the WELCOA 7 benchmarks were measured by a set of questions, for which ordinal response options were assigned point values ranging from 0 to 100. Scores for each of the benchmarks for each entry were computed using proportions of response points for items corresponding to each benchmark and dividing by the total possible points for that particular benchmark. Overall checklist scores were also calculated by summing the total points for all 100 items and dividing by the total possible points. These were calculated as proportions to match the outcomes of benchmark and overall scores that organizations received in their reports following the completion of the checklist. Benchmark scores and overall checklist scores are represented by 4 categories based upon their average points, which are referred to as needs improvement (0-25 points), good (26-50 points), very good (51-75 points), and excellent (76-100 points). Examples of items that measure each of the benchmarks as well as reliability measures for each benchmark are provided in Table 1.
Measure of Benchmark Scores and Reliability of Scales.
Sampling
The WWC is publicly available on WELCOA’s website and is promoted through conferences, mass e-mail mailings, WELCOA membership, and various marketing efforts. Given that this checklist is available on WELCOA’s public website, this study is a 1-group design that includes a convenience sample of organizations who self-selected to complete the online checklist from 2008 through 2015. Each year, some number of new organizations completed the checklist (compared to the previous year’s sample) and some dropped out from the previous year’s sample. Following the completion of the checklist, participating organizations receive an individualized report to help them assess the quality of their wellness programming for employees.
Analysis
This study was conducted using the WWC data collected from 2008 through 2015. The original data set contained 5433 entries between the years 2008 and 2015, inclusive. Of these entries, 557 entries were identified as organizations that completed the survey multiple times within 1 year or multiple entries within the same year by different individuals across the same company site. For this analysis, only the most recent entry per year for an organization was included. Another 138 entries were removed from the data set, as they were indicated as mock or test entries for the purpose of obtaining a sample report of the WELCOA 7 benchmarks. Additionally, 75 entries were international-based organizations that were excluded for this analysis. Finally, 20 entries with missing data were also excluded from the analysis. The final sample size used for this study consisted of 4643 entries from self-selected US organizations. Descriptive analyses of all checklist items were completed separately for each year of the study period with resulting frequencies and percentages or mean ± standard deviation (SD). All analyses were performed using SPSS v23 (IBM Corp, Armonk, New York).
Results
Sample Demographics
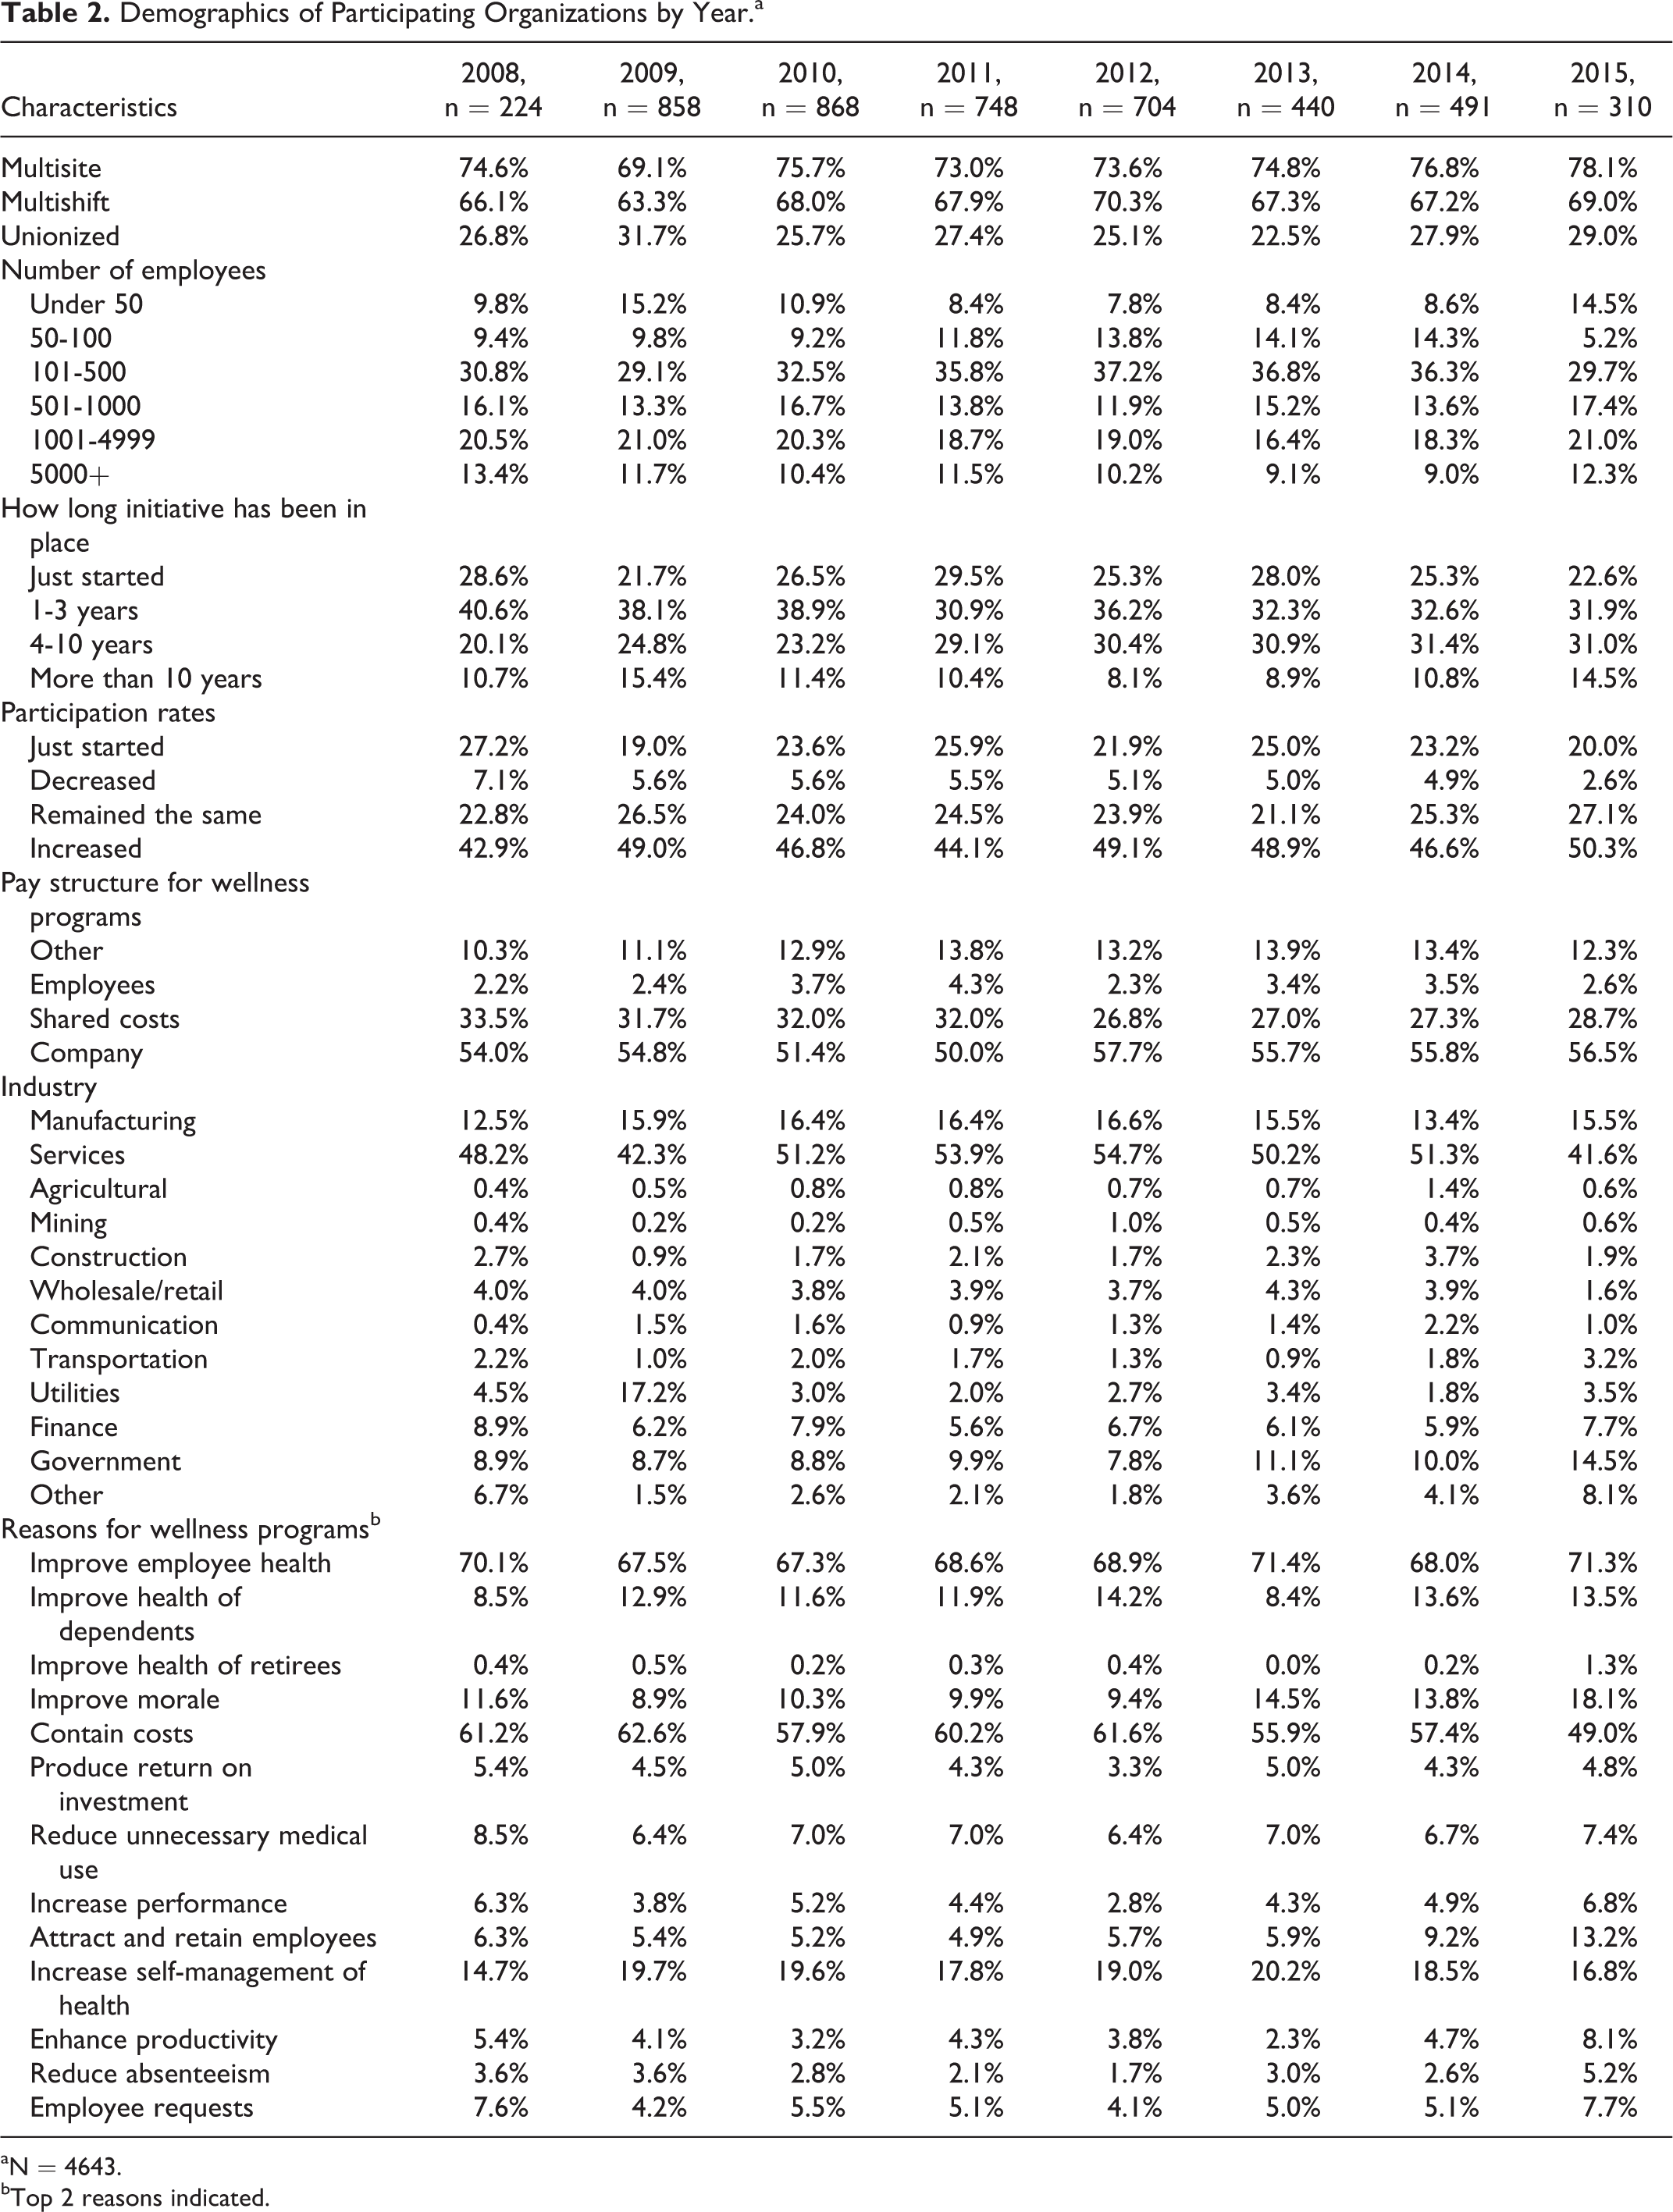
The WWC surveyed a convenience sample of organizations from 2008 through 2015, with 4643 entries included in the final analyses. Table 2 presents the descriptive statistics for demographic variables in this sample. Across years, a majority of the sample included organizations with multiple sites (69%-78%) and organizations with multiple shifts (63%-70%). On average, across all years, about 25% of organizations completing the checklist were unionized organizations. About one-third of the organizations completing the checklist within each year had 101 to 500 employees. Additionally, across all years, an average of about 20% of organizations had 1001 to 4999 employees. The smallest percentage of organizations completing the checklist across years were those with less than 50 employees. Each year, about half of the organizations were in the services industry and about 15% of organizations were in the manufacturing industry. On average across years, about 8% of organizations were government agencies.
Demographics of Participating Organizations by Year.a
aN = 4643.
bTop 2 reasons indicated.
Each year, less than 16% of organizations had wellness programs in place for more than 10 years. Most indicated having wellness programs in place for 1 to 3 years (31%-41%) or 4 to 10 years (20%-31%). Each year, about half of the organizations indicated employee participation rates in wellness programs had increased over the past 2 years. Although nearly a third of the participating organizations each year indicated shared costs between employees and employers for wellness programs, over 50% of organizations had employers covering all costs for wellness programs. Across all years, the highest percentage of organizations indicated their top reasons for implementing wellness programs were to improve employee health (67%-71%) and to contain costs (49%-63%).
Benchmark Performance
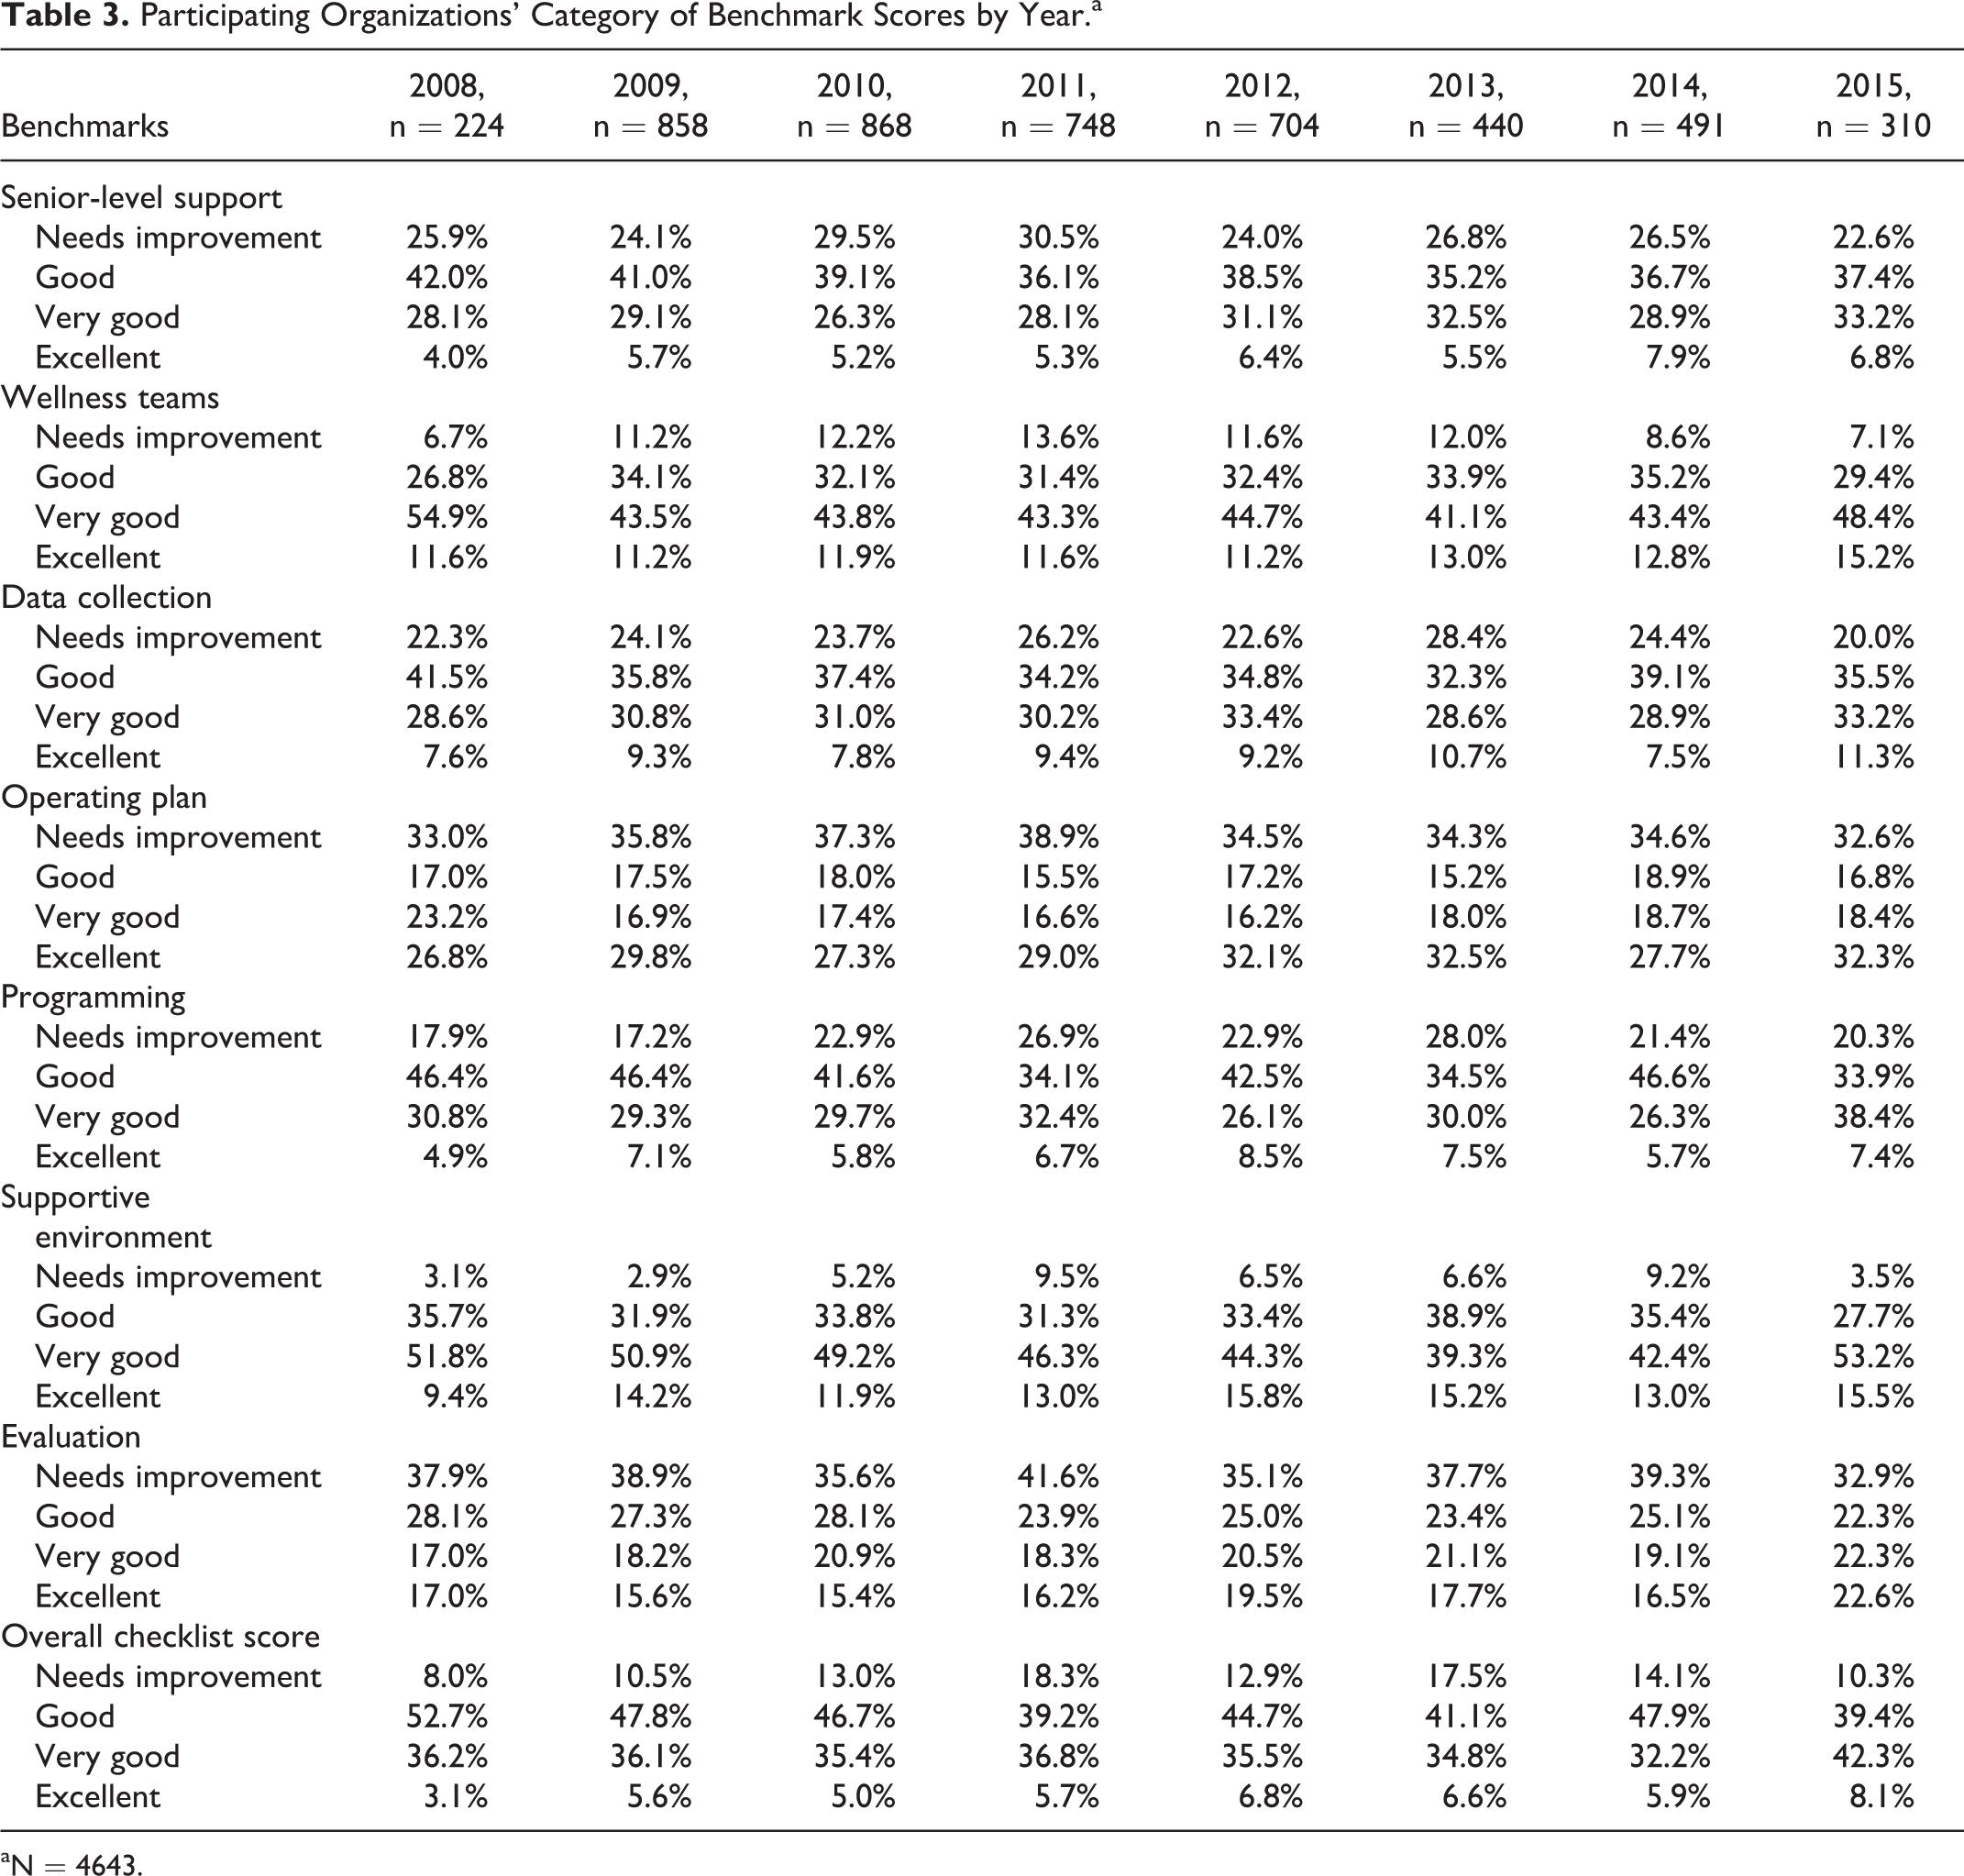
Table 3 shows the percentages of organizations scoring in each category on the WELCOA 7 benchmarks across each year. The “needs improvement” category includes scores 0 to 25, “good” includes scores 26 to 50, “very good” includes scores 51 to 75, and “excellent” includes scores 76 to 100. Figure 1 shows the mean scores for each of the WELCOA 7 benchmarks across 2008 to 2015. This figure provides the average scores of each benchmark for organizations participating in the checklist each year. The following results of performance against each of the WELCOA 7 benchmarks reflect those shown in both Table 3 and Figure 1.
Participating Organizations’ Category of Benchmark Scores by Year.a
aN = 4643.

Average benchmark scores for participating organizations each year (2008-2015).
The lowest scoring benchmarks, senior-level support, data collection, and programming, had average scores ranging from 40 to 47. Across each year, around 25% of organizations scored within the needs improvement category on senior-level support, data collection, and programming. Consistently, low percentages of organizations completing the checklist scored within the excellent category on the benchmarks for senior-level support (4%-8%), data collection (8%-11%), and programming (5%-9%). Additionally, high percentages of organizations scored within the needs improvement category for operating plan (33%-39%) and evaluation (33%-42%). Although operating plan and evaluation presented the highest percentages of organization scoring in the needs improvement category, both operating plan (27%-33%) and evaluation (15%-23%) also presented higher percentages of organization scoring within the excellent category. Thus, average scores for operating plan range from 49 to 55 and evaluation mean scores range from 43 to 51.
In addition to operating plan and evaluation for which organizations scored on the high and low extremes, organizations also scored higher among the benchmarks for wellness teams and supportive environments. Across years, about 40% to 50% of organizations scored within the very good category on wellness teams (41%-55%) and supportive environments (39%-53%). Only a small percentage of organizations scored in the needs improvement category for both wellness teams (7%-14%) and supportive environments (3%-10%). The average scores for wellness teams and supportive environments were among the highest of the 7 benchmarks, ranging from 53 to 59 across all years.
Overall Checklist Scores
Overall, about 13% of organizations across each year scored within the needs improvement category for the checklist. The majority of organizations participating in the checklist each year scored within the good category (39%-53%), with an overall checklist score of 26 to 50. On average, just over a third of participating organizations scored within the very good category each year (32%-42%). An average of just 6% of participating organizations scored between 76 and 100, the excellent category.
Discussion
The descriptive results of this successive convenience sample study provide a snapshot of the quality of workplace wellness initiatives from 2008 through 2015. It is clear from the number of organizations completing WELCOA’s Wellness Checklist that there is interest in assessing their WHP efforts, potentially looking to improve what they are doing. Organizations appear to want guidance regarding how best to achieve their wellness goals and are seeking reputable resources. At a minimum, organizations want to assess how they are doing.
The majority of the organizations represented within these data each year are multisite, multishift, and medium- or large-sized companies in the services industry. Even though there were yearly changes in the organizations completing the WWC, the results across the WELCOA 7 benchmark scores were relatively consistent from year to year. This result could indicate a secular trend in the quality of wellness programs in worksites or that the organizations completing the checklist are similar in other characteristics year to year. Given that we see a similar pattern in demographic characteristics across years, despite the change in organizations that self-select to complete the checklist each year, there may be a selection bias not yet identified.
Among the reasons for starting WHP initiatives, there was a slight upward trend from 2008 to 2015 among respondents indicating “to improve morale” and “to attract and retain employees” as some of their reasons for starting wellness programs. Similarly, there seemed to be a slight decrease in the number of organizations indicating “to contain costs” as a reason for implementing their wellness programs. Of course, we do not know whether this trend was due to sampling bias or to actual shifts in the society. However, these results may suggest the beginning of a shift in the perspective of organizations participating in the checklist.
Across all years, the benchmarks with the lowest average scores were senior-level support, data collection, and programming (Figure 1). These benchmarks included items related to CEO’s allocation of resources for wellness programs, organizational, environmental, and employee data collection, and the level of programming on a variety of topics such as physical activity, smoking cessation, stress management, and so on. These low benchmark scores may be due to a variety of factors such as resources, organizational support, and even company size.
Within senior-level support, organizations scored the lowest on items pertaining to the CEO’s health promotion practices. For example, around half of the participating organizations indicated that they did not know whether the CEO had taken an Health Risk Appraisal (HRA) or received an annual physical examination. This could be because individuals completing the checklist were unsure about the CEO’s personal health promotion practices. This may not be something that is communicated as openly within the company. If senior-level support is not obvious, it could impact any attempt to create a culture of health. Lower average scores for the senior leader support benchmark may also be attributed to low scores on items assessing CEO allocation of time, space, and resources for WHP, which could pose challenges for programming.
Lower average scores on the programming benchmark may be due to the comprehensive nature of the items in that scale. This scale assesses programming levels across 14 different wellness programs and interventions (eg, from awareness [lowest level] to awareness, education, behavior change, and culture enhancement [highest level]). The most common programming included HRAs, health screenings, physical activity, and nutrition/weight management. The lowest levels of programming included alcohol, medical self-care, work–family balance, and ergonomics. It may be that organizations do not have resources or the need to address all the potential programming areas at the same time, thus resulting in lower scores. This may be especially true for smaller companies who are implementing lower levels of programming than larger companies. It may be possible to incentivize organizations to improve their programming efforts relative to quality benchmarks through systems such as those outlined in the Affordable Care Act.
Similar to the programming benchmark, data collection measures across 16 different types of analyses conducted within an organization. The reason for lower average scores of the data collection benchmark may be due to the number of analyses organizations are willing and able to conduct. Although HRAs and health screenings were the most common forms of data collection reported by organizations each year (64%-79%), smaller companies were conducting these less frequently than larger companies. This may indicate a difference in the availability of resources. Most organizations did not conduct a corporate health culture audit (65%-70%) or an analysis of employee productivity, presenteeism, and engagement (64%-73%). This could mean that these issues are not important to the organization or that they lack the resources to collect these data or are not prepared to address what they might find from these data.
Average scores of operating plan and evaluation fall in between the mean scores for all other benchmarks. At the same time, operating plan and evaluation have higher percentages of organizations in both the excellent and needs improvement categories. This is the result of the items in these benchmarks being answered on a dichotomous scale versus the typical 5-point scale used in most other items.
In terms of the operating plan benchmark, most organizations across years reported that their operating plan contains a mission statement for wellness that is connected with the organization’s core philosophies (54%-64%). About half of the organizations across each year reported having an itemized budget for wellness programs (49%-54%). Organizations are likely to fall into either the excellent or needs improvement categories for this benchmark, creating opportunities to enhance operating plans of lower scoring organizations. Items included within this benchmark address policies, strategic plans, and objectives for employee health, which may require some external expertise from public health practitioners.
In terms of evaluation, on average across years, over two-thirds of the organizations reported tracking participation within their wellness programs. However, more than half of the organizations indicated they do not monitor the health status of “at-risk” employees, document improvements in knowledge, attitudes, skills, or behaviors, nor do they monitor the impact of wellness on key productivity indicators. Some of these evaluations may raise privacy concerns for employees within organizations. These evaluations may require expertise not present in organizations.
Wellness teams and supportive environments had the highest average benchmark scores across all years. Although these higher average scores could be reflective of areas for which organizations are more invested, this result may be, in part, an artifact of the measures used. Across both benchmarks, response options have some biases built in that could skew the averages to the higher end. For example, some items included within wellness teams have no 0 option (all other items do) and supportive environment contains several items that are dichotomous (yes/no) answers.
Within the wellness team benchmark, over half of the organizations each year indicated that their wellness teams meet at least 6 times a year (56%-73%). Most organizations reported that they do not require formal length of appointments among members of wellness teams (65%-69%). These items may suggest that the frequency of meetings and lack of formal appointments allow for the most committed employees to serve on wellness teams to plan and assess WHP efforts.
The supportive environment benchmark includes the lowest proportion of organizations in the needs improvement category. This may be due to the nature of the items included within this scale. Many of these are policy-related (eg, no knives/firearms, no drug use on company property) or facility-related items that may be required (eg checking heating/lighting). Some of these policies have legal requirements and others have become commonplace for organizations. Many of these items also don’t require any additional resources beyond what is legally or normally provided at the workplace.
Although there was variation in scores among benchmarks, most organizations scored within the “good” and “very good” categories for the overall checklist each year. Although it is possible that organizations improve their worksite wellness initiatives and then elect not to participate in the checklist the next year, characteristics of participating organizations each year remain similar. Future research may want to explore changes within organizations over time to determine whether organizations are improving, despite the steady results of this successive convenience sample. It would also be helpful to consider whether these results represent the mainstream of commitment among organizations to their WHPs. If so, it could guide interventionists to encourage companies to improve the quality of efforts or it may show us that these are the realities of what organizations are willing and able to do and then practitioners could try to maximize health for employees in that context. Finally, it would be good to have data to help us know that meeting certain benchmarks are more important in producing better employee health.
Comparison to Other WHP Checklists
Compared with other large sample studies of worksite wellness programs, a greater percentage of respondents in this study were large organizations. In 2009 to 2011, 33 organizations self-selected to complete the HERO scorecard, all of which were large organizations with an average of 20 000 employees per participating organization. 13 In the 2014 Massachusetts Worksite Health Improvement Survey sample, about 7% of the responding organizations had more than 1000 employees. 18 In our samples across the years, the proportion of respondents with more than 1000 employees ranged from a low of 25.5% in 2013 to a high of 33.9% in 2008. This would support earlier findings that larger companies are more likely to be engaged in worksite wellness programming. 4,8,13,19
The National 2004 survey included about 30% of organizations with workplace health promotion initiatives in place for 10 years or more. Across each year of the WWC data, only about 8% to 15% of the organizations indicated having a worksite wellness program in place for 10 years or more. This finding may be due to sampling differences, which could include that organizations with more recent programs are looking for guidance in terms of quality, and the WELCOA 7 benchmarks are one such guide with feedback. Additionally, differences may suggest that temporal shifts occur in worksite wellness programming depending on factors such as economic downturns, globalization of competition, or new policies such as the Affordable Care Act.
The results of this study are both different and similar to those in the 2004 National Workplace Health Promotion Survey 8 and the 2014 Massachusetts Worksite Health Improvement Survey. 19 In terms of visible leadership commitment, the Massachusetts study found that 14% had an annual budget, 24% reported having formal communication to all employees about the program, and 19% reported that senior management actively participated in their programs. 19 For each year in our study, about 50% reported having a formal budget, about 70% reported written or written plus other forms of communication about the programs to employees, and CEOs are actively participating in program activities in about 65% to 70% of the organizations, depending on the year. In terms of data collection and evaluation, the 2004 National Survey included close to 20% of organizations conducting health risk appraisals. 8 In this study, between 65% and 75% of organizations reported conducting health risk appraisals across 2008 to 2015. We did see a similar trend to the 2004 study, with larger organizations reporting the use of health risk appraisals more than smaller organizations.
Limitations
The main limitation of this study was that sampling was done by organizations voluntarily completing the WWC. Thus, the final sample was a convenience sample assembled across years as organizations chose to complete the checklist. We chose to divide the data into calendar years for analytical purposes since organizations may have completed the checklist in multiple years, and we wanted to be able to capture those data. The decision to divide the data by year was based on the notion that this time frame would generally capture what was going on in a single-budget year. Of course, not all organizations have budgets that mirror the calendar years, but in any given year, it is likely that most months of that year fall under a single annualized budget cycle. We reasoned that budget cycles would influence the resources available to any WHP initiatives in the organizations in any given year.
Conclusion
Companies are meeting most of the WELCOA benchmarks for quality in their WHPs at some level. It appears that these benchmarks can help employers make decisions about the extent and focus of prevention efforts related to employees’ health. The use of the benchmarks indicates that companies are taking systematic approaches to employee health promotion. However, few of the organizations are excelling in performance on the benchmarks, so further investigation could examine whether this is due to limitations of time, money, expertise, or other resources or whether it reflects the limits of what organizations are willing to do in this realm. Future research could also explore the relationship between organizational characteristics and performance across the benchmarks as well as the relationship between benchmarks and employee health outcomes, return on investment, presenteeism, and other outcomes of interest to employers.
Benchmarking of WHP programs is still evolving from the research and practice communities in an attempt to give WHPs the best chance of enhancing employee health. While being a convenience sample, this study adds quality metrics to the conversation generated by other studies of WHP activities conducted with representative samples of companies nationally. This study contributes practice-based evidence that some say is needed to produce evidence-based practice, 20,21 in this case in WHP, by reporting on 8 years of data from US organizations regarding the extent to which they are meeting the WELCOA 7 benchmarks.
SO WHAT?
What is already known on the topic?
Previous studies have tried to identify benchmarks for the quality of WHP programs. Assessment of performance against these benchmarks is still relatively unknown for many organizations, and there is little data that look at performance against benchmarks over time.
What does this article add?
This study adds considerable data to the conversation about what companies are doing relative to benchmarks that exist. These and other data could serve as a backdrop for discussions among practitioners and researchers about how to improve the quality of programming.
What are the implications for health promotion practice or research?
WELCOA’s benchmarks can be useful for practitioners to structure, advise, or advocate WHP programs. For practitioners, this study gives wellness professionals and external consultants ideas about what to expect in terms of a context for their work. Researchers could advance the quality of benchmarking by connecting the performance to outcome measures such as medical care utilization, use of preventive services, or employee morale to assess relative impact of WHP programming.
Footnotes
Declaration of Conflicting Interests
The author(s) declared no potential conflicts of interest with respect to the research, authorship, and/or publication of this article.
Funding
The author(s) received no financial support for the research, authorship, and/or publication of this article.