



Abstract
Purpose:
To examine changes in organizations’ workplace health promotion (WHP) initiatives over time associated with repeated self-assessment using the Well Workplace Checklist (WWC).
Design:
Well Workplace Checklist data include a convenience sample of US organizations that selected to assess their performance against quality WHP benchmarks.
Setting:
Workplaces.
Subjects:
In total, 577 US organizations completed the WWC in 2 or more years from 2008 to 2015.
Measures:
The WWC is a 100-item organizational assessment that measures performance against the original set of quality benchmarks that were established by the Wellness Council of America (WELCOA).
Analysis:
This study examined changes in overall WWC scores as well as 7 separate benchmark scores. Multilevel modeling was used to examine changes in scores associated with repeated assessments, controlling for the year of assessment and organizational characteristics.
Results:
There were significant increases in overall WWC scores (β = 2.93, P < .001) associated with the repeated WWC assessments, after controlling for organizational characteristics. All 7 benchmark scores had significant increases associated with reassessment. Compared to other benchmarks, operating plan (β = 6.18, P < .001) and evaluation (β = 4.91, P < .001) scores increased more with each reassessment.
Conclusion:
Continued reassessment may represent more commitment to and investment in WHP initiatives which could lead to improved quality. Other factors that may positively influence changes in performance against benchmarks include company size, access to outside resources for WHP, and a history with implementing WHP.
Keywords
Introduction
Workplace health promotion (WHP) initiatives have the potential to improve the health of the employees, decrease health-care costs, reduce absenteeism, and increase retention. 1 -5 Various sets of benchmarks were developed to guide the implementation of high-quality WHP initiatives which are expected to increase the likelihood of achieving outcomes of interest for employees, employers, and public health professionals. 1,2,6 -10 The Wellness Council of America (WELCOA), Health Enhancement Research Organization (HERO), and the Center for Disease Control and Prevention are among the national agencies that have established benchmarks and accompanying tools for organizations to assess the quality of their WHP initiatives. 8,11,12 There appears to be a significant overlap across the multiple sets of benchmarks, even aligning with studies that examined components vital for quality WHP initiatives, 2,7,9 providing some face validity to these quality benchmarks.
Despite the presence of benchmarks and guidelines, only 6% to 17% of US organizations that are implementing WHP initiatives have a high-quality or comprehensive initiative, 12 -14 leaving around 83% to 94% of those implementing WHP initiatives with room to improve the quality of their WHP initiatives. Yet, there are limited studies that have examined changes made by organizations to improve the quality of their WHP initiatives over time, making it difficult to discern which benchmarks are likely to be improved upon across different types of organizations. We believe identifying the changes that organizations have made to improve their benchmark performance would provide new insights on organizations’ capacity for implementing high-quality WHP initiatives.
This study examines changes in performance against quality benchmarks over time using the Well Workplace Checklist (WWC) data set. The WWC measures the quality of organizations’ WHP initiatives against the original set of benchmarks established by the Wellness Council of America (WELCOA) which included senior leader support, wellness teams, data collection, operating plans that integrate wellness, programming, supportive environments, and evaluation.
Importantly, organizations self-select to complete the WWC without incentives. Therefore, it is likely that many of these organizations want to improve the quality of their WHP initiatives. To do so, they may seek guidance from the WWC report that is received after completing the checklist. The report details performance against each benchmark, highlights areas of strength and opportunity, and suggests changes that could improve the benchmark performance. Assessments and survey feedback have a long history as an organizational development approach 15,16 and survey instruments have been known to increase knowledge or spark new ideas for respondents 17 which could lead to improvements in WWC scores. Therefore, our first hypothesis was that organizations’ overall WWC scores would increase with each repeated WWC assessment, even after controlling for organizational characteristics.
In addition, completing the assessment itself may provide ideas for specific changes that could be made. For example, items related to different types of evaluation data (eg, participant satisfaction or improvements in knowledge, attitudes, skills, and behaviors) may offer direction for specific actions to improve the benchmark performance. We expect that there may be different rates of improvement across individual benchmarks based on the assumption that some benchmarks require less resources to implement. For example, promoting new budgets, policies, or environmental supports often require significant engagement from leadership as well as costs to support the initiatives. 7,13,18,19 Therefore, our second hypothesis was that benchmarks requiring more resources and engagement from leadership (ie, senior leader support, operating plan, and evaluation) would not improve as much over time.
Methods
Sample
This study used secondary data consisting of a convenience sample of organizations in the United States and was approved by the University’s institutional review board. The WWC data consists of 3728 US organizations that self-selected to complete the WWC from October 2008, when the checklist was made publicly available online, through October 2015, when our research team received the data. For the purpose of this study, to examine change over time, our analytical sample included only 577 organizations that completed the WWC 2 or more times with each entry being completed in a separate year.
There were a few minor differences at first assessment between the 3151 excluded organizations and the analytical sample. Specifically, compared to the excluded organizations, organizations in the analytical sample were more likely to have over 100 employees (84% of analytical sample vs 75% of excluded sample, P < .001), multiple sites (76% of analytical sample vs 72% of excluded sample, P = .026), multiple shifts (72% of analytical sample vs 65% of excluded sample, P = .001), and WELCOA membership (45% of analytical sample vs 37% of excluded sample, P < .001). The analytical sample was also more likely to choose a cost-related reason (70% of analytical sample vs 64% of excluded sample, P = .006) and less likely to choose a morale-related reason (17% of analytical sample vs 22% of excluded sample, P = .006) for implementing WHP initiatives. Finally, compared to the excluded sample, the analytical sample had a higher overall WWC score at their first assessment (Manalytical = 48.28; Mexcluded = 43.86; P < .001) and scored significantly higher across each of the 7 benchmarks. There were no other differences across any of the other measures used in this study.
Measures
The WWC was made publicly available on October 2008 for organizations to complete online through the WELCOA website. The WWC includes 100 benchmark-related questions and some demographic questions about the organization. Organizations that complete the assessment receive a report detailing areas of strength and areas of opportunities, which may help organizations prepare a strong application for a WELCOA Well Workplace Award. The checklist is not connected to the WELCOA awards and is open to any organization, not just WELCOA members. Below, we describe the WWC measures that were used in this study. Additional information regarding the creation, administration, and scoring of the WWC was included in an earlier publication. 12
Quality of WHP initiatives. The WWC has 100 items that measure organizations’ performance against WELCOA’s original 7 benchmarks: (1) senior leader support for WHP initiatives, (2) employee wellness teams focused on WHP efforts, (3) data collection to drive WHP initiatives, (4) operating plans that integrate WHP, (5) programs to promote health and wellness, (6) environments supportive of health and wellness, and (7) evaluation of WHP initiatives. Table 1 lists the number of items and concepts used to measure each benchmark.
Foci of Benchmark Questions.
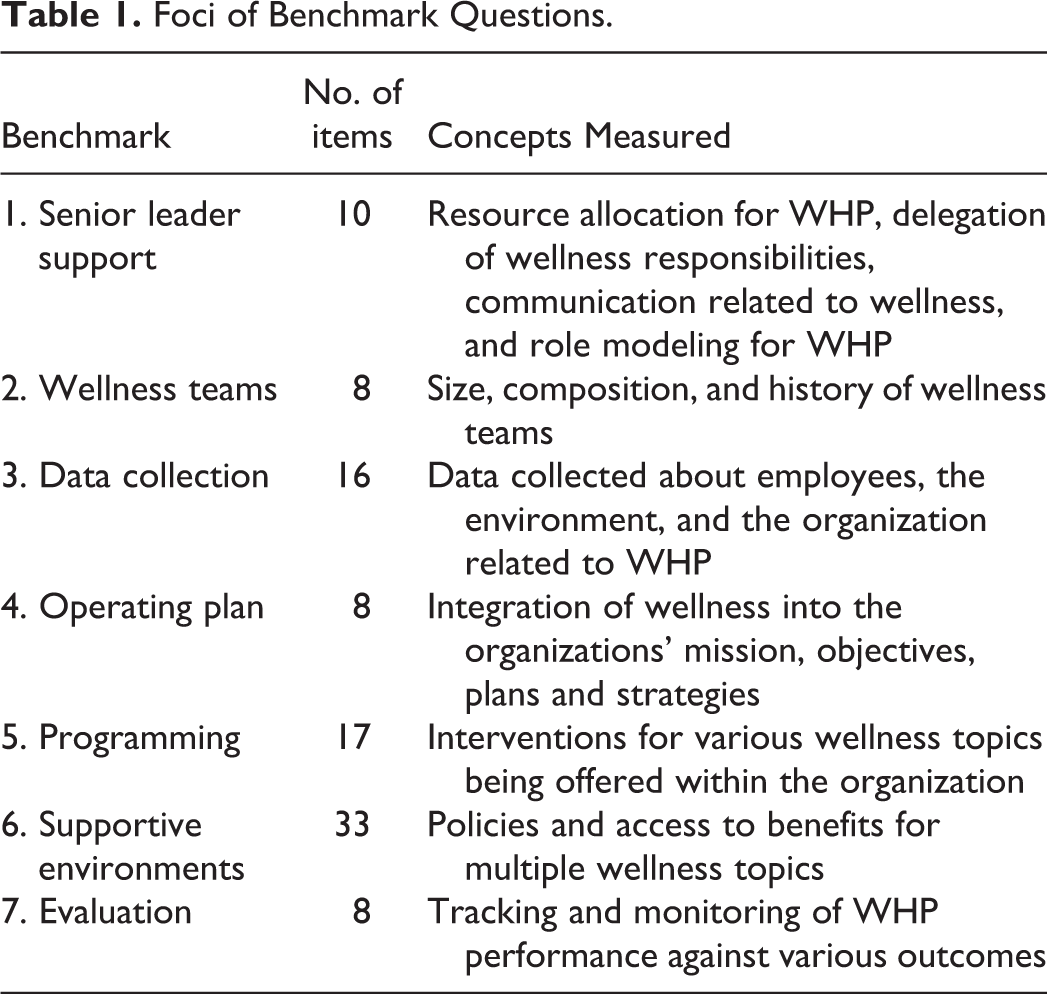
Each of the 100 survey items had 2, 4, or 5 ordinal response options which were assigned equidistant point values that ranged from 0 to 100 based on the quality of the approach. We calculated proportions for the overall WWC scores (ie, the total points an organization received across all 100 items divided by the total points possible). We used the same approach to calculate benchmark scores for each of the 7 benchmarks. For example, benchmark 1 consisted of 10 items worth up to 100 points each. To calculate the benchmark scores for benchmark 1, we used the sum of points across those 10 items and divided by 1000. The calculated overall WWC and individual benchmark scores ranged from 0 to 100. There was no weighting of specific benchmarks within the WWC.
Time
The key predictor variable was the order of repeated assessments. This variable indicated where in the series of total assessments each assessment fell. For example, the value of repeated assessments was 1 for an organization’s first assessment, 2 for its second assessment, and so on. In addition, we included the calendar year of assessment as a control variable to account for potential benchmark performance attributed to historical trends.
Control variables
Analyses included time-varying characteristics of organizations and their WHP initiatives. We included dichotomous variables for each of the following: multi-site, multi-shift, unionized, and membership with WELCOA. Given that over half of the organizations were in the services industry, we dichotomized industry type into services or not services. We also included control variables for the number of employees (referent = over 1000), length of time WHP initiatives were in place (referent = just starting), and how WHP initiatives were paid for (referent = employees or other funding source). Finally, we created 4 dichotomous variables (yes/no) that captured organizations’ reasons for implementing WHP initiatives: Health-related reasons included improving employee health, improving health of dependents, improving health of retirees, and improving health self-management. Cost-related reasons included containing costs, producing a return on investment, and reducing unnecessary medical use. Morale-related reasons included improving morale, attracting and retaining employees, and meeting employee requests for WHP initiatives. Performance-related reasons included increasing performance, enhancing productivity, and reducing absenteeism. Organizations that indicated at least 1 of the reasons within a category were coded as a yes for that reason.
Analysis
We used multilevel modeling, with time nested within organization, to test changes in benchmark scores across the order of repeated assessments. Multilevel modeling treats time flexibly, which is important given that organizations did not complete the WWC the same number of times or at equal time intervals. For example, an organization may have completed their first entry in year 2009, their second entry in 2012, and the third entry in 2015, while another organization may have completed their first entry in 2008 and their second entry in 2015. It is important to account for both the number of entries and the time between each entry because more frequent entries may represent a higher commitment to WHP while an additional time between entries could contribute to more improvements made between assessments.
Model 1 was an unconditional model with overall WWC scores as the dependent variable and the order of repeated assessments as the independent variable. Model 2 controlled for time-varying characteristics of organizations and their WHP initiatives to ensure that any observed association between the order of repeated assessments and WWC scores was not due to organizational differences. We also controlled for the calendar year of assessment to account for any historical trends that may have influenced WWC scores. Models 3 to 9 used each of the 7 benchmark scores as separate outcome variables and controlled for the same covariates that were included in Model 2. Akaike Information Criterion (AIC), Bayesian Information Criterion (BIC), and likelihood ratios were used to test for model fit. We performed all analyses using SPSS version 25. 20
Results
Characteristics of the Sample
Table 2 shows the characteristics of participating organizations at the time of their first WWC assessment. Twenty-five percent of organizations were just getting started with WHP initiatives when they completed their first WWC assessment. About 45% of the sample were members of WELCOA at the time of their first WWC assessment. Half of the participating organizations reported that the costs of their WHP initiatives were paid for entirely by the company. Half of these organizations had 101 to 1000 employees and about 34% had more than 1000 employees. Mean benchmark scores for the first-time WWC assessments were highest among Supportive Environments, Wellness Teams, and Operating Plan, although standard deviations for Operating Plan and Evaluation were considerably larger than other benchmarks.
Sample Characteristics for Organizations at Their First WWC Assessment.a

a N = 577.
b Reasons were grouped into 4 categories based on the list of reasons in the WWC.
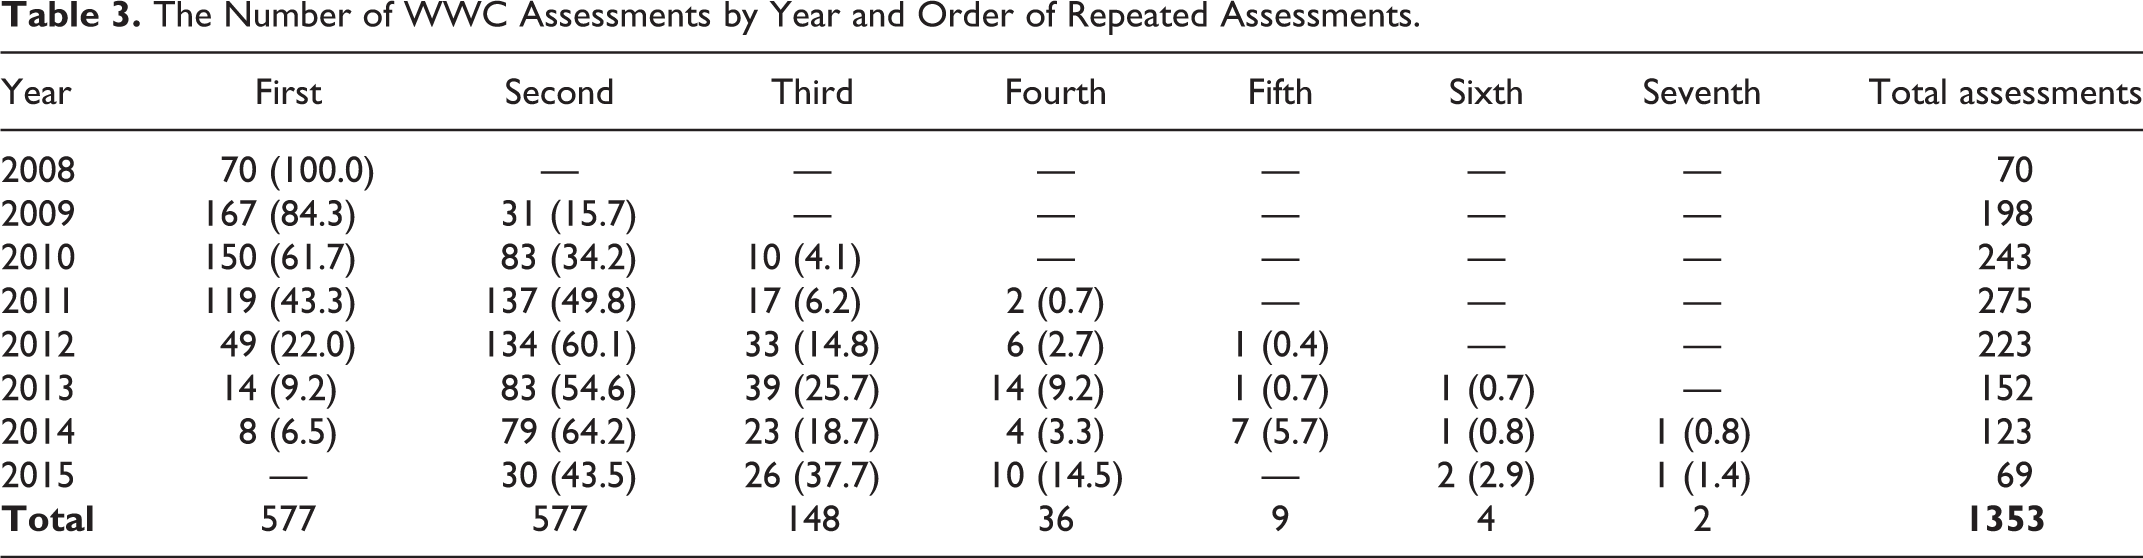
Table 3 shows the frequency of and intervals between reassessments across all years of the study timeframe. Of the 577 organizations that completed the WWC 2 or more times, 429 completed the WWC only twice, 112 completed the checklist 3 times, and only 36 organizations completed the WWC more than 3 times.
The Number of WWC Assessments by Year and Order of Repeated Assessments.
Changes in Performance
Table 4 shows the results from Model 1 and Model 2, in which the dependent variable is overall WWC scores. Results for Model 1 indicated that there was a significant positive relationship between the order of repeated assessments and overall WWC scores. Specifically, overall WWC scores increased by an average of 4.21 points with each additional reassessment completed. This association is still significant in Model 2 after controlling for all covariates, although the size of effect dropped to an increase of 2.93 points for each additional reassessment. Notably, this increase for each additional reassessment occurred against a backdrop of a significant negative association between the calendar year of assessment and overall WWC scores: overall WWC scores decreased an average of almost 1.00 point per year from 2008 to 2015. In terms of controls, overall scores were significantly lower for organizations that were unionized, but they were significantly higher for organizations that had more employees, multiple sites, multiple shifts, membership with WELCOA, WHP initiatives in place for longer, WHP costs paid by employers, and health reported as a primary reason for implementing WHP initiatives.
Repeated Measures Multilevel Modeling for Changes in WWC Scores.a
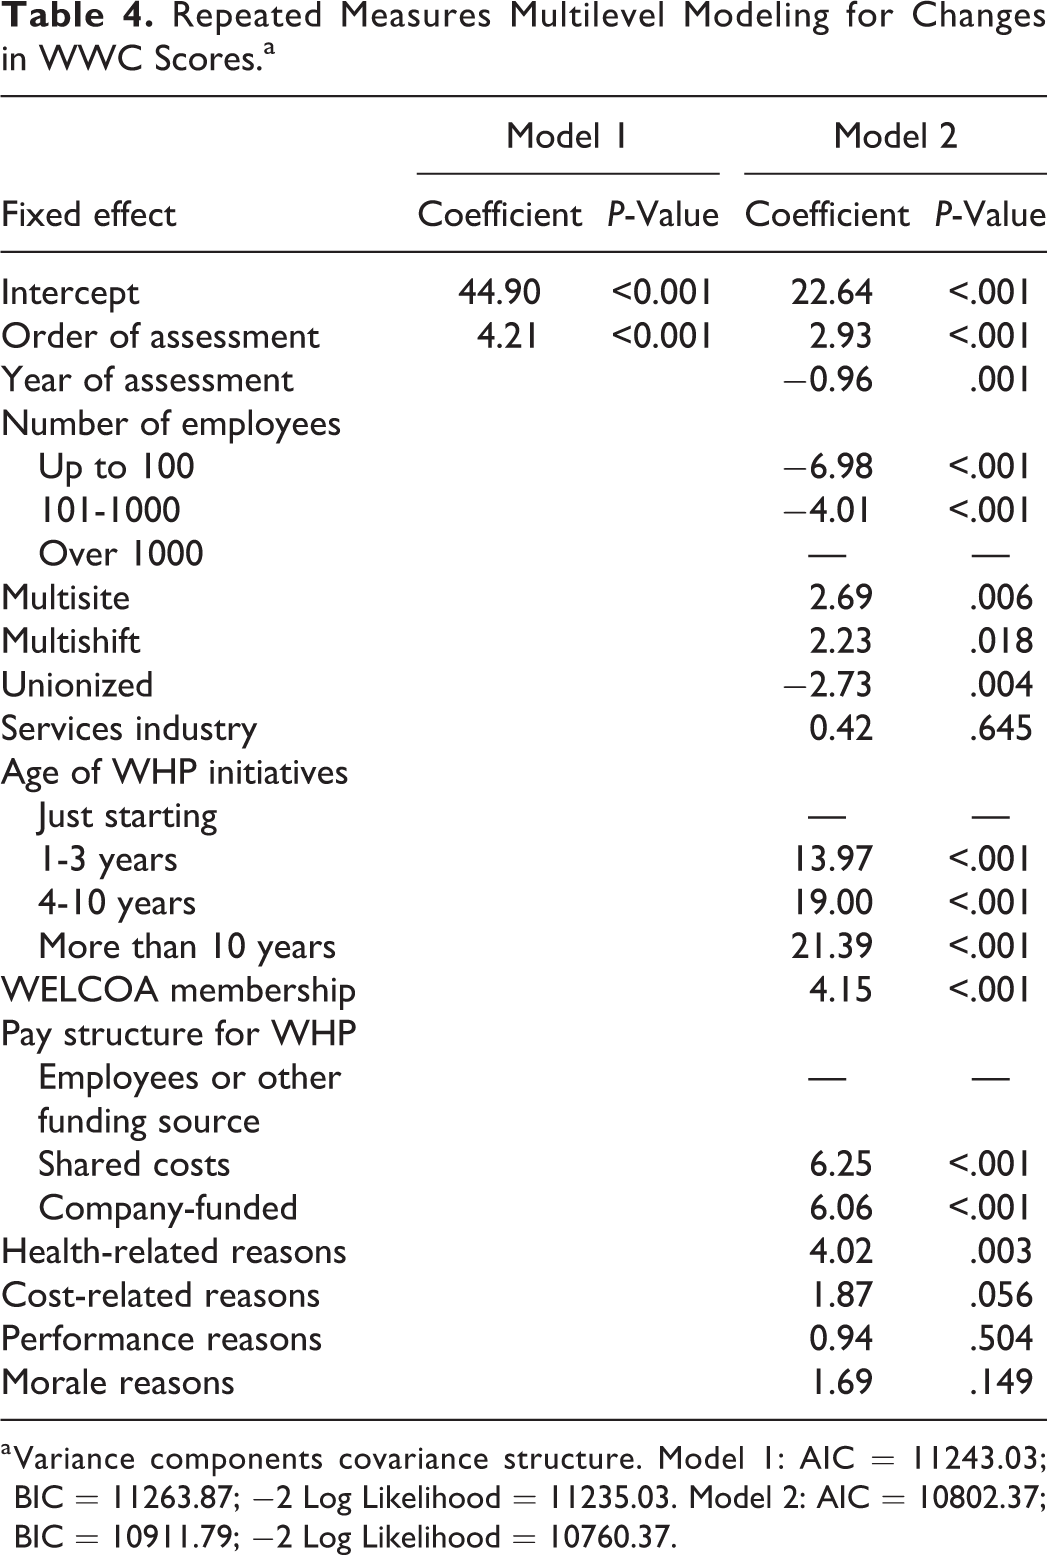
a Variance components covariance structure. Model 1: AIC = 11243.03; BIC = 11263.87; −2 Log Likelihood = 11235.03. Model 2: AIC = 10802.37; BIC = 10911.79; −2 Log Likelihood = 10760.37.
The characteristics of organizations explained some of the variances in overall WWC scores. Consistent with prior research, organizations with more than 1000 employees scored almost 7 points higher than organizations with 100 or fewer employees and 4 points higher than organizations with 101 to 1000 employees. Organizations with multiple sites or multiple shifts scored more than 2 points higher than organizations that were not multisite or multishift. Finally, unionized organizations scored 2.73 points lower on the WWC entry than organizations that were nonunionized.
There were also significant associations with overall WWC scores among characteristics for which organizations may have more choice or control. The longer the organizations had been implementing WHP initiatives, the higher they scored on the WWC. Organizations that were WELCOA members at the time they completed the checklist scored just over 4 points higher than non-members. Employers that paid some or all costs for WHP scored an average of 6 points higher than organizations with employees or other sources funding their WHP initiatives. Finally, organizations that reported a health-related reason for implementing WHP initiatives scored 4 points higher than organizations that did not report a health-related reason.
Table 5 shows the results from Models 3 to 9, which indicated that the order of repeated assessments was positively associated with each individual benchmark score: all benchmark scores increased by an average of 2 or more points with each additional reassessment. The increase was smallest for Wellness Teams (β = 2.14) and Supportive Environments (β = 2.69) and largest for Operating Plan (β = 6.18) and Evaluation (β = 4.91).
Repeated Measures Multilevel Modeling for Each of the WWC Benchmark Scores.
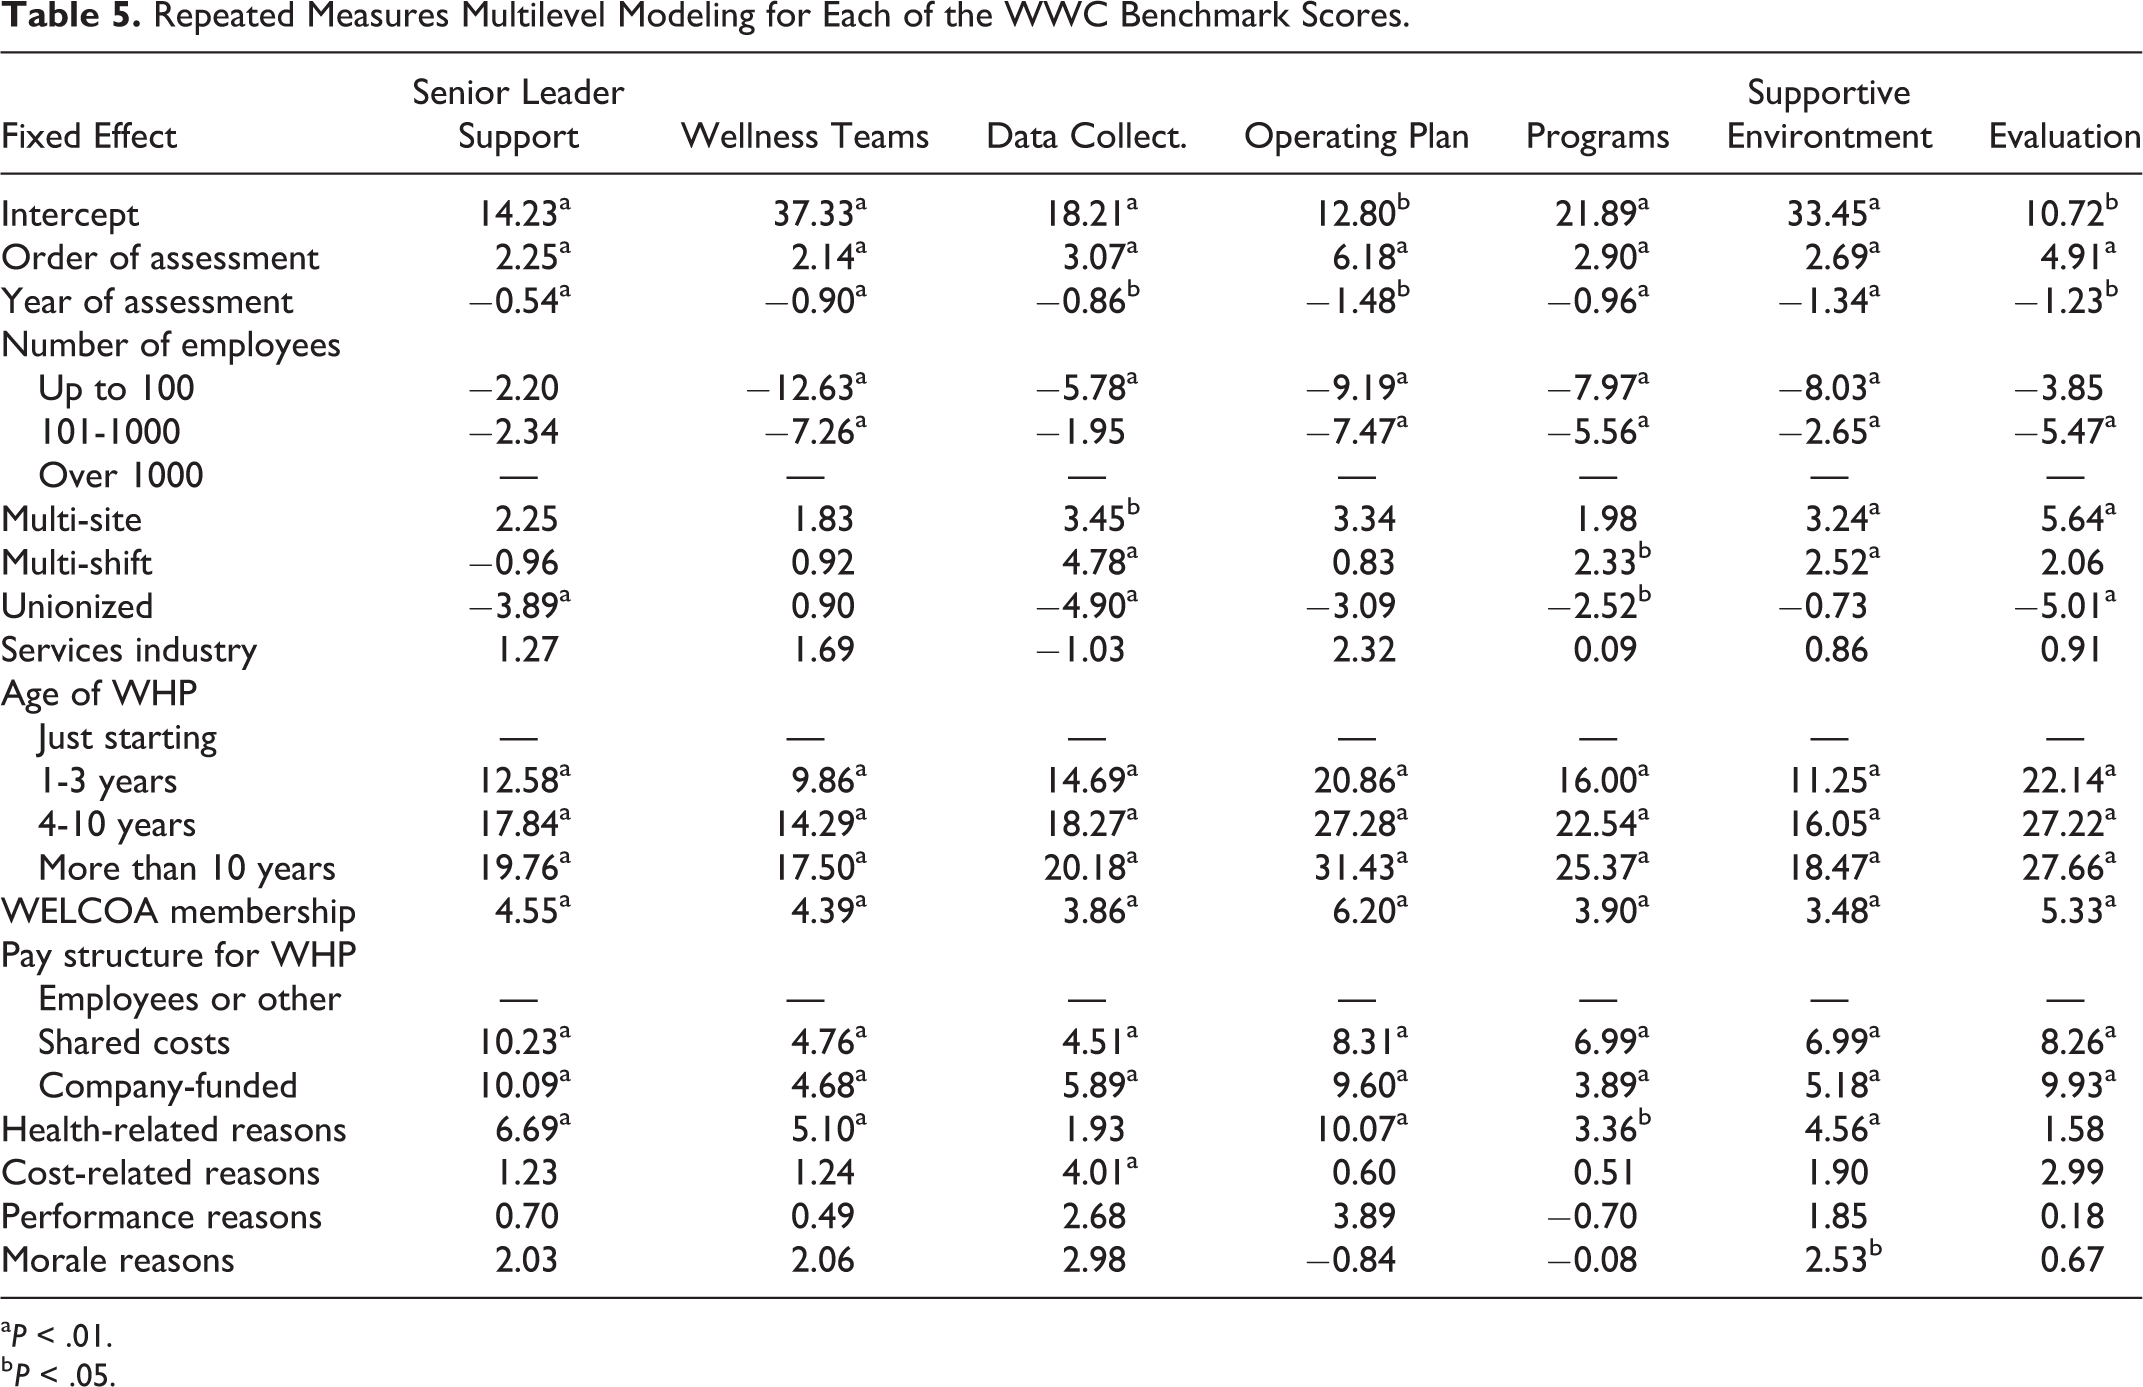
aP < .01.
b P < .05.
There were significant relationships between benchmark scores and organizational characteristics. Organizations with 100 or fewer employees scored significantly lower than organizations with more than 1000 employees on the Wellness Teams, Data Collection, Operating Plan, Programming, and Supportive Environments benchmarks. Multi-site organizations scored significantly higher than single-site organizations on Data Collection, Supportive Environments, and Evaluation benchmarks. Organizations with multiple shifts scored significantly higher on for Data Collection, Programming, and Supportive Environments. Finally, unionized organizations scored significantly lower than non-unionized on Senior Leader Support, Data Collection, Programming, and Evaluation.
Across all benchmarks, average scores were higher for organizations with longer-standing WHP initiatives. Wellness Council of America members scored higher across all benchmarks. Organizations that were paying some or all costs of WHP initiatives also scored higher across all benchmarks. Those that indicated a health-related reason for implementing WHP initiatives performed higher across all benchmarks except Data Collection and Evaluation. Whereas organizations that indicated a cost-related reason scored significantly higher on the Data Collection benchmark. Finally, organizations that indicated a morale-related reason scored significantly higher on the Supportive Environments benchmark.
Discussion
This study examined longitudinal changes in performance against quality benchmarks among a convenience sample of US organizations that completed the original WWC 2 or more times. Our results supported both of our hypotheses. First, we found overall WWC scores improved from 1 assessment to the next, after controlling for the calendar year of assessment and the characteristics of organizations. Second, we found that the amount of improvement in scores varied across benchmarks, suggesting that higher scores at first assessment may leave less room to improve for some benchmarks (eg, wellness teams), while other benchmarks (eg, senior leader support) may be more difficult to enact changes. These key findings suggest that organizations have some capacity to improve their scores over time and that capacity may vary across characteristics such as organizational size.
Organizations do not specify their motivations for reassessing with the WWC, making it difficult to determine why performance increased over time. However, there may be several explanations for the significant positive relationship between the order of repeated assessments and WWC scores. First, organizations may improve their benchmark scores as they are exposed to new ideas when completing the assessment or after reviewing their feedback report. 15 -17 In fact, those that had an active membership with WELCOA were directed to additional member-only resources based on their feedback reports. This could have contributed to higher scores across all benchmarks over time for WELCOA members, although we do not know what resources were actually utilized by organizations. It is also possible that organizations can respond more accurately after being exposed to the checklist items in earlier assessments. Given that this was a convenience sample of organizations that self-selected to complete the WWC across years, it may be that they are dedicated to accurate assessment and improvement of their WHP initiatives.
In addition, organizations with more WWC reassessments over time may be more committed to WHP, as they are investing their time to reassess their performance across years. Well Workplace Checklist scores improved with each additional reassessment, despite the negative trend in average scores for first assessments being lower across years. This may be consistent with the analytical sample having higher scores at their first assessment when compared to the excluded organizations that completed the WWC only once. It is also consistent with our findings that organizations with longer standing WHP initiatives had higher scores across all benchmarks compared to those just getting started. Similarly, organizations that invest financial resources in WHP initiatives also scored higher across all benchmarks. Notably, however, the order of repeated assessments across years still had a significant positive relationship with benchmark scores after controlling for the age of WHP initiatives and the financial resources invested in WHP initiatives.
The different rates of improvement in performance across benchmarks suggest several types of resources and support that would be useful for organizations depending on their characteristics. For instance, mean scores were higher at first assessment for Wellness Teams and Supportive Environments, both of which incorporate measures of grassroots-related concepts such as teams and peer support for WHP initiatives. These benchmark scores did not increase as much with each additional reassessment compared with other benchmarks, which suggests that these benchmarks may be easier to get started but more challenging to improve upon without increased support and buy-in from leadership in the organization. We also see that these benchmarks may be easier to improve upon for larger organizations, which typically have more slack to devote time and resources to growing wellness teams or supportive environments.
On the other hand, Operating Plan and Evaluation started with lower average scores at baseline and increased more than other benchmarks for each additional reassessment. These benchmarks assess aspects of strategic planning and feedback loops for WHP initiatives, which may require thoughtful input by planning and evaluation experts as well as decision-makers in the organization. Given the average growth of the performance against these benchmarks, it is possible that items included in these measures provide direction to support changes that may improve the performance.
Although not the focus of this study, it may be worth noting the differences in the benchmark performance based on organizations value propositions or reasons for implementing WHP initiatives. Organizations that indicated cost-related reasons for implementing WHP initiatives scored significantly higher for Data Collection. The cost-related reasons in the WWC included reducing unnecessary medical costs and containing health-care costs, which lend themselves to collecting claims and benefit data. It is no surprise that organizations with cost-related reasons would score higher on data collection, given that the WWC included items specific to collecting claims data and was developed at a time when return-on-investment was promoted as a primary objective of WHP. 3 Given the recent reevaluation of motivations for WHP related to return-on-investment versus value-on-investment, 21,22 future research should examine the relevancy of items assessing data collection so that they place equal emphasis on claims data and measures such as employee needs, satisfaction, overall well-being, or morale. In thinking about revised data collection measures, it may also be helpful to consider what evidence is needed to draw conclusions on the economic impact of WHP initiatives. 23
Limitations
This study relied on a convenience sample of organizations that chose to self-assess the quality of their WHP initiatives more than once using the WWC. Therefore, results are generalizable only to these organizations. In addition, the WWC is a self-report instrument, which could motivate social desirability in responses. In fact, repeated exposure to the checklist may further influence social desirability and the pressure to see changes in the performance across years. Finally, without having a control group, it is unclear what led to improvements in scores or whether these improvements may have happened independent of completing the WWC.
It is also important to note that the assessment of quality was based solely on the WWC and did not include any additional qualitative assessment or further detail regarding the specific practices that may contribute to the overall quality of an organization’s WHP initiatives. This is a limitation of many checklists and scorecards which may not allow for the variations in needs across different types of organizations. For example, a small organization may have a high-quality WHP initiative that meets the well-being needs of their employee population and still score lower on the WWC due to fewer programs being offered in general. Checklists and scorecards could benefit from including employee-facing outcome measures that validate measures of quality which may vary across different types of organizations.
Conclusion
The WWC and its resulting feedback report may provide guidance to organizations by introducing ideas and strategies to help improve the performance against quality benchmarks. This study contributes to the literature by examining organizations’ changes in the performance against WHP benchmarks over time. Our study found that organizations improved the benchmark performance with each additional reassessment over time. The continued reassessment of WHP initiatives may represent more commitment to and investment in WHP initiatives which could lead to improved quality. In addition, this study corroborates that larger companies, access to outside resources for WHP, and a history with implementing WHP has a positive influence on the quality of WHP initiatives being implemented within organizations. 13,24
Our findings suggest that 1 strategy to help organizations improve their WHP initiatives is to encourage them to complete the WWC assessment and review the resulting report that suggests with suggested actions they could take to improve the quality of their WHP initiatives. Going forward, a controlled study that examines the processes associated with an improved performance against benchmarks would provide more insight to organizations that are striving for high-quality WHP initiatives. In addition, qualitative research would help to provide more detailed assessment of the quality of WHP initiatives across various types of organizations that serve different employee populations across several unique contexts. Finally, with shifting value propositions for WHP initiatives, 22,25 there is a need for continued research to develop and test new measures for assessing and evaluating WHP initiatives based on different outcomes of interest.
So What?
What is already known on the topic?
National sets of benchmarks exist to serve as guidelines for developing high-quality WHP initiatives. Although surveys, scorecards, and checklists are available to help organizations assess the quality of their WHP initiatives based on benchmarks and guidelines, research has not examined longitudinal changes in performance against benchmarks.
What does this article add?
Repeated assessment is associated with improved performance against quality benchmarks for WHP initiatives. Despite the influence of organizational characteristics on performance against benchmarks for WHP initiatives, organizations can improve their WHP initiatives over time.
What are the implications for health promotion practice or research?
Health promotion practitioners could promote the use of assessments as 1 tool to encourage improvements to WHP initiatives. Continued exploration of the efficacy of strategies, resources, and support to improve the quality of organizations’ WHP initiatives across various benchmarks is needed.
Footnotes
Declaration of Conflicting Interests
The author(s) declared no potential conflicts of interest with respect to the research, authorship, and/or publication of this article.
Funding
The author(s) received no financial support for the research, authorship, and/or publication of this article.
