
Abstract
Purpose:
The purpose of this study was to identify the relationship between work-related, individual, and environmental factors and self-reported standing time during the workday.
Design:
Cross-sectional study design.
Setting:
Participants were recruited from a large, public university in the southeastern United States.
Measures:
Data were collected through an 87-item online survey using previously validated scales that assessed workplace standing time, demographic variables, work-related psychosocial factors, and workplace environment factors.
Analysis:
One-way analysis of variance, Pearson correlation coefficients, and nonparametric tests were used to determine univariate relationships between standing time and independent work-related variables and demographic factors.
Results:
Mean standing time among the sample (n = 502) was 72.49 minutes (standard deviation = 73.48) daily. There was a significant relationship between standing time and barrier self-efficacy for standing at work, self-regulation strategies, social norms, local connectivity in the workplace, overall connectivity in the workplace, and proximity of coworkers. Standing time was significantly higher for men, employees with an advanced degree, employees with a standing desk, and faculty.
Conclusion:
Health promotion researchers and practitioners should consider factors at multiple levels of influence when designing studies to explore workplace sedentary behavior. The findings regarding variations in workplace behavior by employee subgroups should be taken into consideration when designing future studies in the workplace.
Keywords
Purpose
Sedentary behavior is a significant public health concern and includes activities that involve sitting and low energy expenditure (≤1.5 metabolic equivalents). 1 Studies have shown associations with sitting and chronic diseases, including diabetes and cardiovascular disease. 2,3 One of the primary domains to target sedentary behavior is the workplace, as employees in desk-based occupations spend approximately two-thirds of the workday sitting. 4
Recommendations to modify occupational environments to reduce sitting include replacing sitting with opportunities for light intensity activity, such as standing. 5 Studies attempting to increase standing, such as providing sit–stand workstations, have been successful in reducing sitting time, with reductions ranging from 15 to 89 minutes per workday. 6 Although these interventions show promise, minimal information is known about factors that influence standing time in the workplace. 7,8 Information regarding these factors could help health promotion researchers and practitioners to develop strategies to change behavior. The purpose of this exploratory study was to determine the relationship between select workplace-related factors and workplace standing behavior.
Methods
Design
These findings are part of a larger study. Data were collected from August to November 2016 using an 87-item online questionnaire. Participants were employees at a large, public university in the southeastern United States. Approval was obtained from the university’s institutional review board prior to conducting the study (Protocol EX-16-CM-066-R2).
Sample
Sampling was limited to employees in desk-based occupations. Inclusion criteria were 18 years of age or older and full-time employment. Recruitment occurred in-person at wellness screenings and via e-mail through employee listservs. The first page of the survey contained informed consent information. Overall, 941 participants were recruited, and 537 completed the survey (57.1% response rate).
Measures
The survey contained self-report measures of workplace-related psychosocial factors, standing/sitting behavior, and demographics, including age, gender, race/ethnicity, education, employment classification (1 = faculty/staff; 2 = clerical staff; 3 = administrative staff), and office type (1 = private, 2 = shared).
Individual-level variables
Individual-level psychosocial variables were assessed using validated scales (Cronbach α: .72-.90). 9 Perceived behavioral control of sitting scale assesses the amount of control employees believe they have over their sitting time at work. The scale contains 5 items measured on a 5-point Likert-type scale (1 = strongly disagree; 5 = strongly agree). A total score is calculated by summing item responses. A higher score indicates greater control over sitting reduction. 9
Self-regulation of sitting was assessed using a 10-item scale that assesses the frequency employees utilize strategies to reduce sitting (eg, standing breaks). The items are measured on a 5-point Likert-type scale (1 = never; 5 = very often). A total score is calculated by summing item responses. Higher scores indicate greater use of self-regulation strategies. 9
The 9-item barrier self-efficacy scale measures an employee’s confidence to overcome barriers that impede the ability to reduce sitting (eg, uncomfortable footwear). Items are measured using a 5-point Likert-type scale (1 = not at all confident; 5 = very confident). A total score is calcualted by summing item responses, where a higher score indicates greater confidence. 9
Interpersonal-level variables
Social norms about workplace standing were assessed using a validated scale (Cronbach α of .81). 9 The 8-item scale assesses employees’ perception of workplace social norms related to standing and reducing sitting. Items are measured using a 5-point Likert-type scale (1 = strongly disagree; 5 = strongly agree). A total score is calculated by summing item responses, where a higher score indicates positive social norms.
Environmental-level variables
The office environment was assessed using the validated 18-item Office Environment and Sitting Scale, which includes 4 subscales: (1) proximity of coworkers, (2) visibility of coworkers, (3) local connectivity, and (4) overall connectivity (Cronbach α from .70 to .86). 10 Items are measured using a 5-point Likert-type scale (1 = strongly disagree; 5 = strongly agree). Scores for each subscale are calculated by summing item responses. A higher score on a subscale indicates a higher level of proximity, visibility, or connectivity. 10
Standing time
The Occupational Sitting and Physical Activity Questionnaire (OSPAQ) was used to measure standing time. 11 The OSPAQ is a self-report measure that asks participants to indicate the percentage of a typical workday spent sitting, standing, walking, and performing heavy labor. Multiplying the reported percentage by the participant’s self-reported daily working hours yields time spent in each beahavior. 11 The OSPAQ has demonstrated sufficient test–retest reliability (r = 0.73-0.90) and criterion validity for standing (r = 0.49). 12
Analysis
Analyses were conducted using SPSS version 23. The standing variable was found to violate normality (skewness = 2.17; kurtosis = 7.98). The standing variable was transformed using log transformation (mean = 1.73, standard deviation [SD] = 0.40). Normality statistics (skewness = 0.297, kurtosis = 0.264) and histogram indicated normal distribution of the transformed variable. Spearman correlation coefficients were calculated for all analyses with the standing variable. Mean differences were assessed using 1-way analysis of variance. Appropriate nonparametric tests were employed for non-normal variables.
Results
Participants (n = 502) were predominantly female, white, and highly educated (Table 1). Mean workplace standing time was 72.49 minutes (SD = 73.48), and 10.8% of participants (n = 57) reported no workplace standing time.
Demographic and Work-Related Characteristics of the Sample.a,b
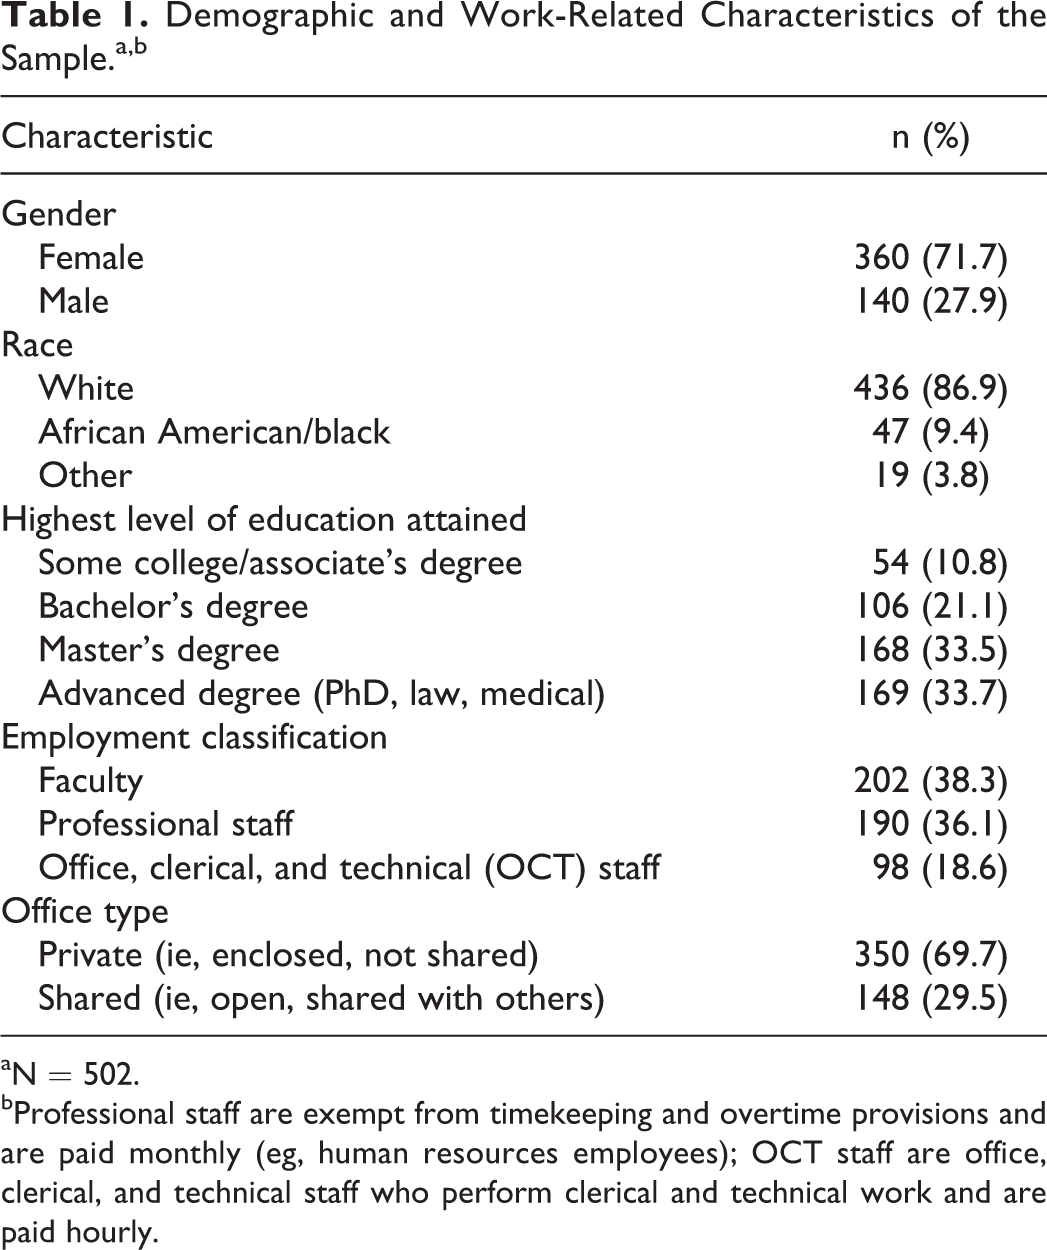
aN = 502.
bProfessional staff are exempt from timekeeping and overtime provisions and are paid monthly (eg, human resources employees); OCT staff are office, clerical, and technical staff who perform clerical and technical work and are paid hourly.
All measures were deemed internally consistent (Cronbach α: .64-.91). Barrier self-efficacy, r(441) = 0.169, P < .01, self-regulation strategies, r(435) = 0.098, P < .05, social norms, r(442) = 0.118, P < .05, local connectivity, r(437) = 0.113, P < .05, overall connectivity, r(434) = 0.110, P < .05, and proximity of coworkers, r(440) = −0.098, P < .05, had significant relationships with standing (Table 2).
Correlation Matrix Depicting the Relationship Between Workplace Factors and Employee Standing Time During the Workday.

Abbreviations: BSE, barrier self-efficacy; LC, local connectivity; M, mean; OC, overall connectivity; PBC, perceived behavioral control; PCW, proximity of coworkers; SD, standard deviation; SN, social norms; SRS, self-regulation strategies; ST, standing time; VCW, visibility of coworkers.
a Spearman correlation values reported.
b Significant at the P < .01 α level.
c Significant at the P < .05 α level.
There was a significant difference in standing time between men (mean = 1.83, SD = 0.38) and women, (mean = 1.69, SD = 0.40), t(1, 442) = 3.50, P = .001, and education level, H(2) = 20.11, P < .001. Post hoc analyses using Mann-Whitney rank sum tests with Bonferroni corrections revealed that employees with an advanced degree stood significantly longer than employees with a bachelor’s degree (P < .001; mean rank of 212.79 and 157.54, respectively) and employees who completed some college (P = .02; mean rank of 182.37 and 137.21, respectively).
Standing time was significantly higher in participants with a standing desk, mean = 1.89, SD = 0.41, compared to those who did not, mean = 1.72, SD = 0.39, t(1, 444) = 2.54, P = .01. There was a significant difference in standing by employment class, H(2) = 52.94, P < .001. Post hoc analyses using Mann-Whitney rank sum tests with Bonferroni corrections revealed that faculty stood longer than clerical (mean rank of 154.28 and 88.63, respectively) and administrative staff (mean rank of 207.08 and 145.78, respectively), P < .001.
Discussion
Summary
The findings from this study show that workplace-related factors were significantly related to employees’ standing time. Barrier self-efficacy was positively related to standing time. In previous research assessing self-efficacy and sedentary behavior, researchers have not found a significant relationship between the variables. 13,14 The positive relationship between barrier self-efficacy and standing time found in this study suggests that a relationship may exist between self-efficacy and standing at work. Similar to our findings, other studies have not identified a relationship between behavioral control or self-regulation and standing. 14
Social norms were positively related to standing time. This finding is important because workplace interventions have potential to change social norms due to built-in social support networks in workplaces. Contrary to our findings, other studies have not shown a relationship between social norms and sitting time, 14 so future studies should continue to explore the relationship between social norms and standing in the workplace.
Workplace connectedness was positively related to standing time and proximity of coworkers was negatively related to standing time. Previous research has also found a relationship between workplace connectivity and decreased sitting. 10,15 The finding that proximity was negatively related to standing time is also supported by previous research, where employees in offices with close proximity of coworkers reported fewer sitting breaks. 15 The findings from this study and previous research suggest that characteristics about the office layout may be related to employee behavior during the workday. We encourage future studies to include measures of the workplace environment to further explore this relationship.
Standing was significantly greater in employees who were male, highly educated, and faculty. A recent study in the academic setting also found that faculty reported significantly more standing time than administrative staff. 7 A potential explanation for differences by employment class may be due to the autonomous nature of faculty jobs. Regarding gender, findings from previous research are mixed, but other studies have also found a negative relationship between education and workplace sitting. 13 However, it is important to consider that within the workplace, education, employment class, and gender may be interrelated. We recommend that future studies explore potential interactions between these variables and their influence on behavior.
Limitations
The findings from this study should be considered within the context of several limitations. The use of a nonrandom, convenience sample limits the generalizability of the findings to other employees, and the cross-sectional study design further limits any determination of causation. Recruitment of participants from an academic setting limits the external validity of the findings with regard to other workplace settings. Additionally, the use of self-report information for standing time prevented the collection of objective data.
So What? Implications for Health Promotion Researchers and Practitioners
What is already known on the topic?
Current recommendations to reduce workplace sedentary behavior include suggestions to increase standing time throughout the workday. However, minimal information is known about what factors may influence standing time in the workplace.
What does this article add?
The findings from this study provide exploratory information regarding individual and workplace-related factors that may influence workplace standing time among employees in an academic setting.
What are the implications for health promotion practice or research?
Health promotion researchers and practitioners should consider some of the factors from this study when creating workplace strategies to increase standing time. Employee subgroup differences in standing time may also help target future strategies toward specific employee subgroups.
Significance
Although exploratory in nature, the findings from this analysis provide important information regarding the relationship between workplace-related factors and standing time. The findings from this study and previous research support the consideration of psychosocial and environmental workplace-related factors when creating models to explore workplace standing behavior. Additionally, the differences in standing time within employee subgroups provide insight for designing future studies in the workplace. In order to better determine the interrelatedness and predictive ability of these variables, we suggest future studies assess the combined influence of these variables on workplace standing behavior through multivariate modeling techniques.
Footnotes
Acknowledgments
The authors would like to acknowledge the help of Wanda Burton, Sarah Pember, and Andrew Piazza, who assisted with the data collection for the study. Also, the researchers would like to thank the participants, as this study would not have been completed without their participation.
Declaration of Conflicting Interests
The author(s) declared no potential conflicts of interest with respect to the research, authorship, and/or publication of this article.
Funding
The author(s) received no financial support for the research, authorship, and/or publication of this article.