



Abstract
Purpose
The Supplemental Nutrition Assistance Program (SNAP) Online Purchasing Pilot (OPP) allows for the online purchase of groceries using SNAP benefits. First implemented in California in late April 2020, little is known about program usage. This study assessed initial implementation of SNAP Online in California using SNAP OPP transaction data from April - October 2020. Insights can identify usage differences by demographics, store availability, and rurality to help inform future pilot programs and nutrition initiatives.
Design
Using generalized estimating equations, we modeled county-level associations between transactions and county-level demographics, rurality, and retailer availability.
Setting
Transaction data from California’s Department of Social Services (CDSS) was linked with publicly-available, county-level demographics.
Subjects
Anonymized county-level data on SNAP Online transactions and CalFresh households.
Measures
The primary outcome was successful SNAP Online food transactions per county.
Analysis
Generalized estimating equation models with clustering by county was used.
Results
During the first 7 months, median SNAP Online transactions per county per month was 665; 2.7% of total SNAP redemptions were from SNAP Online. Counties with more female-led, disabled, Latino, or Asian CalFresh households had fewer Amazon transactions. Each additional Walmart per county corresponded to 260.7 more Walmart transactions (P < .001). Each percent increase in county zip codes covered by Amazon Fresh corresponded to 45.4 fewer Walmart transactions (P < .05) and 37.3 more Amazon transactions (P < .001).
Conclusion
Number of stores per county was associated with greater online grocery transactions, whereas rurality was not. County-level SNAP demographics correlated with transactions at particular retailers.
Keywords
Purpose
Food insecurity in the United States greatly increased during the COVID-19 pandemic, from 10.5% in 2019 1 to an estimated 22.8% in April, 2020. 2 Low-income Americans were disproportionately impacted: 41% of households with annual incomes less than $20,000 experienced food insecurity in April 2020. Federal programs can play an important role in providing support, such as the Supplemental Nutrition Assistance Program (SNAP), which provides over 41 million Americans with funds to purchase groceries. 3 An integral food assistance program, SNAP gave an estimated average of $401 per month per participating household of 3 in 2021, enabling families to purchase qualified food items at participating stores. 4
While SNAP helps millions of Americans afford food, many recipients lack convenient access to stores with affordable, fresh, and nutritious groceries, particularly those with mobility challenges, such as the 16% of SNAP participants over age 60 and the 10% of non-elderly adults with disabilities. 5 The 2014 Farm Bill (PL 113-79) first introduced the SNAP Online Purchasing Pilot (OPP), which called for the creation of a pilot program that would test how SNAP customers could use their benefits to purchase groceries online for curbside pickup or delivery. In 2017, the USDA announced 8 retailers that would participate in the pilot, and in April 2019, the program was first launched in New York. 6 The overarching aim of SNAP Online is to promote health by increasing access to fresh, nutritious food for SNAP participants with mobility challenges and for those living in areas with few supermarkets or grocery stores (known as “food deserts” or “food apartheids”). Insights from program deployment in New York helped inform the program as it scaled to other states, including Washington in January 2020 and Alabama, Iowa, and Oregon in March 2020. While the pilot was intended to last only for a finite period of time before being revaluated by the government for potential expansion to other states, the pandemic quickly changed program implementation and timelines. 7 As health officials encouraged the general community to use online grocery shopping as a way to mitigate the spread of COVID-19, 8 the need for SNAP Online became greater, as it enabled SNAP recipients to more safely shop online using their benefits. Efforts were made to expand SNAP Online to other states as quickly as possible and bypass the original revaluation period. As of December 2021, 47 states and the District of Columbia were approved for SNAP Online. 7
Understanding how this program was initially implemented and its impact, gaps, and challenges provide valuable insights for many, including researchers, policy makers, and practitioners. Assessing which populations were and were not reached can have important implications for thinking about the deployment and structure of future nutrition programs, pilots, and emergency response initiatives, including WIC Online. Past literature details how efforts to increase food security must account for socioeconomic status, race, ethnicity, and neighborhood environment, as access significantly varies based on such characteristics. Rural areas often have lower access to grocery stores, and individuals living in rural food deserts often face greater challenges in obtaining healthy foods. Lack of digital access in rural areas further exacerbates access to healthy food and medical services, with a disproportionate amount of those without high-speed internet being low-income African American or Hispanic/Latino households. 9 Understanding which communities and regions participated in SNAP Online during its initial implementation is useful for identifying which populations still lack access and which regions could benefit most from expanded geographic program participation.
Very little data has been published on SNAP Online usage, particularly during the first months of the COVID-19 pandemic. One of the few publicly available sources of information, a USDA Economic Research Service report, found that in September 2020, $196.3 million had been spent using SNAP Online or2.4% of total SNAP dollars nationally. 10 At this time, SNAP Online was available in 46 US states and DC. 11 Nonetheless, some states saw high initial usage. For example, Kentucky had an initial monthly average of 19.9% of SNAP participants purchasing groceries online with SNAP in June 2020. Similarly, 11.9% of Georgia’s SNAP households did so between July and September 2020. 12 While the USDA has recently approved more stores to address what was originally one of the largest barriers—limited retailer participation—research highlights additional challenges facing SNAP users from using this program, including: shipping and delivery fees that cannot be covered using SNAP benefits, unfamiliar user-interfaces, lack of sensory interaction with food, lack of internet or device access, or lack of trust in product quality or digital privacy.13-16
This paper investigates associations between county-level program usage (monthly SNAP Online food transactions) in California with county-level demographics, rurality, and retailer availability using generalized estimating equations. Given California’s large and diverse population, analysis was done using state data for the first 7 months of the program’s enactment in late April 2020. SNAP is termed “CalFresh” in California, and the terms are synonymous. During this period, only Amazon and Walmart were operating as approved SNAP Online retailers in California. While SNAP Online has been described as a program to help broaden food access for households with lower income, little information has been published describing if it has actually done so does and whether access is distributed equitably. Therefore, understanding what usage looked like during initial SNAP OPP implementation may provide valuable information for improving the continued implementation of the program and ensuring it is equitable and accessible. Findings from such research can help inform the deployment of significant federal resources dedicated to the SNAP Online program, including $5 million for SNAP Online in the December 2020 COVID-19 Economic Relief Bill and $25 million in the March 2021 American Rescue Plan.17,18 Additionally, this information can be used to improve the introduction and scaling of other nutrition, pilot, and emergency relief programs in the future, such as efforts to envision and implement WIC (Special Supplemental Nutrition Program for Women, Infants, and Children) as an online and more accessible program.
Methods
Sample
Initial requests for data on SNAP Online transactions were submitted to California’s Department of Social Services (CDSS). Data could not be provided without a Freedom of Information Act (FOIA) Public Records Request, so a FOIA request was made in Fall 2020 and Winter 2021 for historical data on SNAP Online usage. The CDSS provided the daily number of transactions and amount spent from all approved SNAP (i.e. CalFresh) online retailers by SNAP participant’s home county, from April 20, 2020 (the first day the program was active in California) through October 25th, 2020. Because it takes several weeks for CDSS to collect and verify transaction SNAP data from each county, the most recent data that was shareable at the time from CDSS was through October 25, 2020.
Data from the U.S. Census’ 2019 American Community Survey (ACS) 5-year estimates were also utilized, including the number of CalFresh households, number of CalFresh participants, and CalFresh household characteristics (such as the number of households that were female-led, with members over 65, with disabled members, and with children, and household members’ race and ethnicity). County-level median income was also gathered from the ACS 5-year estimates. 19 At the time of the analysis, the ACS 5-year estimates were the most recent Census population estimates; however, they might not account for any potential population movement during 2020 due to the pandemic. Using the USDA’s Rural-Urban Continuum Codes (RUCC codes), county-level rurality information was merged into one dataset. 20 This study was deemed exempt from an Institutional Review Board at American private university.
Measures
Outcomes: The primary outcome variable was the number of successful SNAP Online food transactions. SNAP Online transactions from the CDSS Public Records Request were aggregated at the month-level, which is the typical CalFresh allotment periods. Data was filtered to include only ‘successful’ food transactions, therefore excluding returns, reversals, or invalid transactions. Also excluded were: 1) cash EBT purchases, which represents funds from Temporary Assistance for Needy Families (TANF) 21 ; and 2) Pandemic EBT (P-EBT), as P-EBT transaction data were only provided at the state-level. 1
Covariates
To include county-level CalFresh demographics in our analysis, we merged the SNAP Online transaction data received through the Public Records Request with CDSS’s online SNAP Dashboard and the ACS 5-year estimates. 19 Some data was transformed to units that would be more interpretable for analysis. More specifically, median income was transformed to be per $10,000; CalFresh Households per 1000; and SNAP-specific demographic groups (i.e., female-led households) as a percent of the SNAP population.
Level of rurality was defined using the USDA’s RUCC codes. This system classifies counties with RUCC codes 1 - 3 as counties in metro areas, each with differing population thresholds. RUCC 4 – 7 is used to classify nonmetro counties of varying population levels that have urban populations. RUCC 8 – 9 is used for completely rural counties or those with less than 2500 residents. 20 Urban counties were classified as RUCC 1-3, suburban as 4 - 7, and rural as 8 - 9. To capture the differences between counties with urban populations and those that were completely rural or had less than 2500 urban residents, we grouped RUCC 4 – 7 as suburban and RUCC 8 – 9 as rural. 2
As an indicator for store coverage, an availability variable was created for each retailer. For Walmart, this variable measured every store per county using the Walmart directory. 23 All store locations were included because while only a subset of stores offer delivery and curbside pick-up, customers can pay with SNAP Online for pickup from any Walmart location. For Amazon, the ‘availability’ variable represented the percent of zip codes where both shelf-stable and perishable items could be purchased on Amazon in each county. While Amazon does deliver shelf-stable items in most parts of the country, this paper considers ‘Amazon availability’ to include regions that are serviced by Amazon Fresh, the service which delivers fresh grocery items like produce and meat. Therefore, the Amazon availability variable was created by counting the number of zip codes serviced by Amazon Fresh and total number of zip codes per county.21,24
Analysis
Differences in county-level online purchasing trends over time were assessed by demographic characteristics including rurality. Time series data on SNAP Online purchases were correlated by county, so generalized estimating equations (GEE) (‘gee’ package in R) were used to model associations between demographic and rurality characteristics and the online purchasing behavior at SNAP Online retailers in California. 25 Sequential multivariable regressions were used to show the differing association of transactions in a county with the aforementioned variables and to explore if rurality, store availability, or both correlate with program usage. The outcome variable was defined as the monthly number of successful SNAP Online food transactions per county using SNAP Online, stratified by retailer. Clustering was done by county and an exchangeable correlation structure was used to account for clustering. Monthly observations per county was used as a datapoint in the model (n = 406). Analyses were conducted in R (R version 4.0.4) in 2020 and 2021, and code is available on GitHub. 26
Results
CalFresh Demographic Information and SNAP Online Purchasing Characteristics for April - October 2020.

Table 1 shows the county level characteristics of SNAP participants in the state of California. Characteristics are written as the county-level mean with the standard deviation in parentheses in the second column and are presented as the county level median with the IQR (interquartile range [25% value – 75% value]) in brackets in the third column.
Between April 20, 2020 (the first day of program launch in California) and October 25th, 2020, 1 766 498 SNAP Online food transactions were approved (approximately $111, 900, 835.82, representing ∼.9% of the total California SNAP transactions over this period), with a median of 665 online transactions per county each month. During this time, only 2 SNAP Online retailers were approved in California: Amazon and Walmart. The median number of transactions per county per month was 196 at Walmart and 325 at Amazon. Figure 1 shows the weekly SNAP Online purchases in the state, with purchases increasing during the first and second weeks, and decreasing during the third week of each month. Walmart received more transactions (893 369) than Amazon (875 283). Similarly, the average basket size for Walmart ($73) was significantly larger than Amazon’s ($53) (P < .001). Weekly SNAP Online Purchases in California, April through October 2020. Data from California Department of Social Services’ (CDSS) Public Records Request.
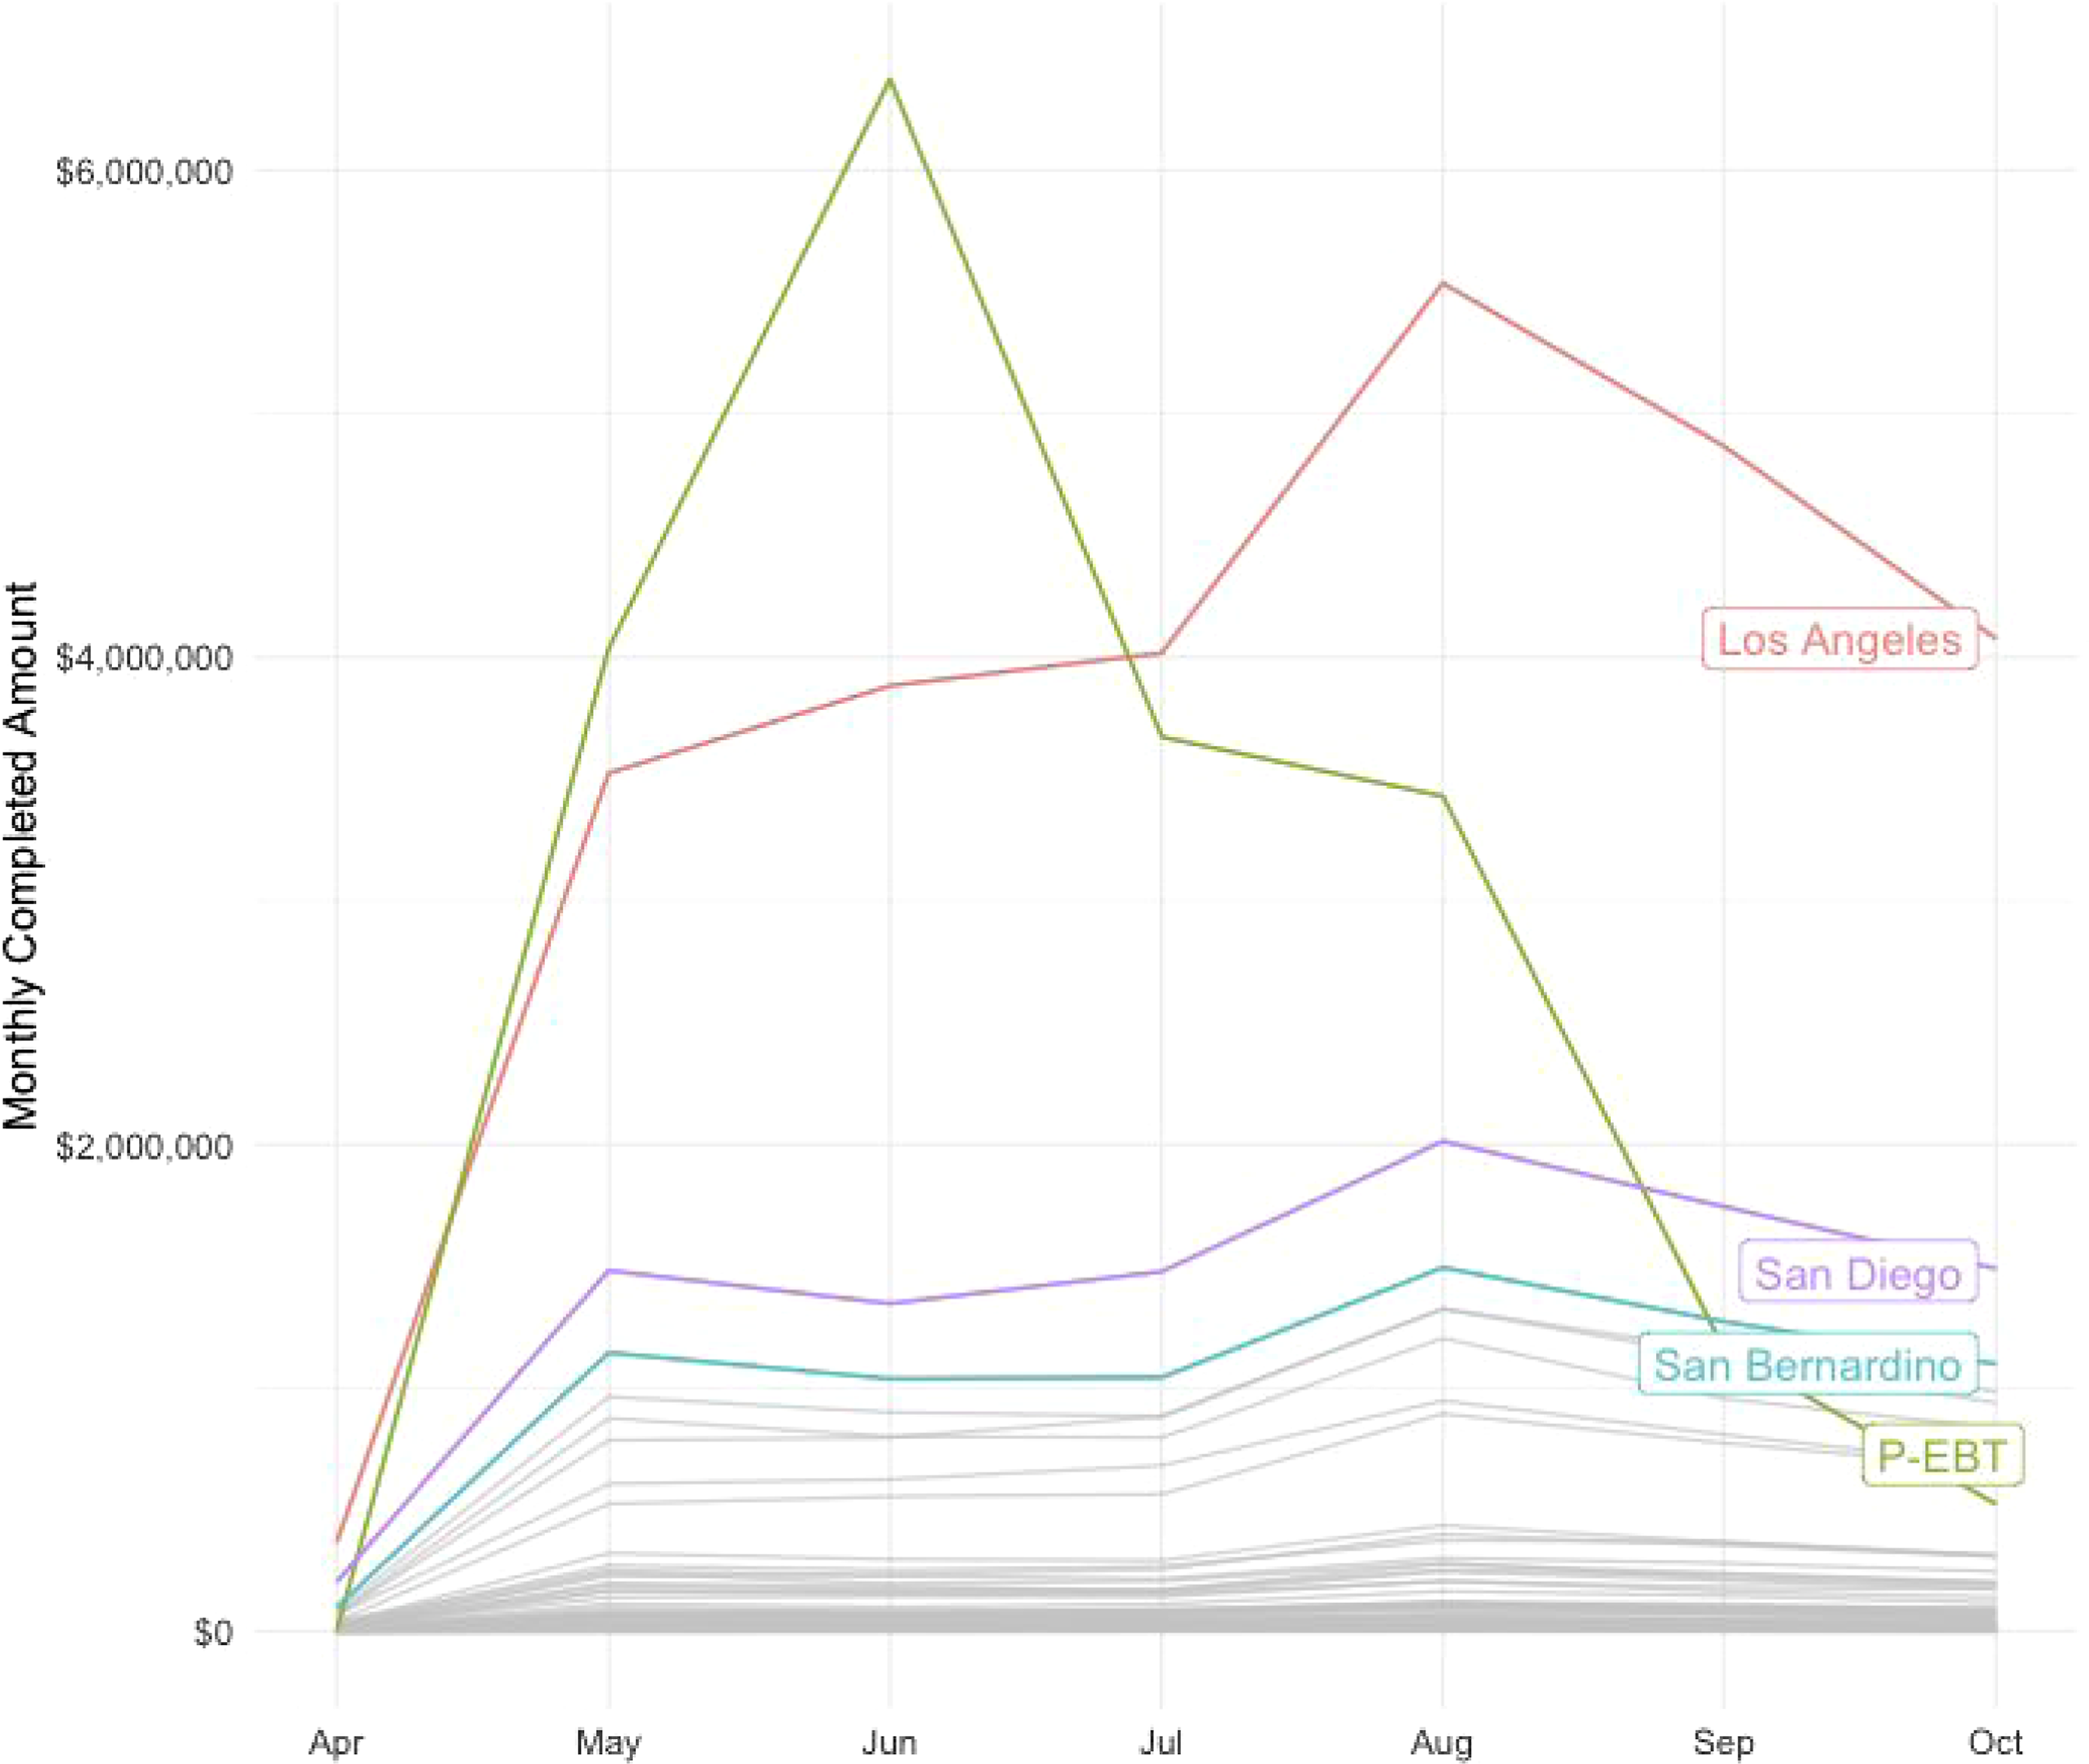
Urban, suburban, and rural program usage all steadily increased during April 2020-August 2020 (Figure 2). After August, the amount spent online per week, per 1000 CalFresh Households continued to increase in urban and suburban areas, whereas rural usage declined. California’s 4 rural counties had the fewest successful food transactions per 1000 SNAP households. While excluded from the analysis and regressions, P-EBT transactions comprised a significant number of total transactions in the early summer (Figure 3, appendix). Amount of SNAP Online dollars spent per 1000 SNAP Households per Week by Region in California, from April to October 2020. Data from California Department of Social Services’ (CDSS) via Public Records Request. SNAP Online Purchases in California. Total Pandemic EBT (P-EBT) monthly transactions (at state-level) compared with other counties, during April to October 2020. Data from California Department of Social Services’ (CDSS) via Public Records Request.
Generalized Estimating Equations (GEE) Analysis on SNAP Online Purchasing Trends, by Retailer and Demographic.

Table 2 shows the Beta coefficients and the standard error of each measured variable in the sequential runs of the generalized estimating equation analysis. Columns with Amazon in in the title have the number of Amazon transactions per month as the outcome measure of interest. Walmart in the title means the number of monthly county level Walmart transactions are the outcome of interest. The first model included the store reach by county, the second model rurality and the third model included both variables. Results significant to the P < .05 level are bolded. The symbol * indicates p ≤ .05, ** means p ≤ .01 and *** corresponds to p ≤ .001.
Discussion
SNAP Online has the potential to unlock greater access to grocery pick-up and delivery for SNAP participants and could play an important role in health promotion and health eating activities. Understanding initial implementation of this program in California during the COVID-19 pandemic provides insight into successes and challenges with launching a new program and the degree to which SNAP Online was first utilized in California. Between April 20th - October 25th, 2020, about $112 million SNAP dollars were spent online as successful food transactions, comprising ∼1.9% of total CalFresh spending in California during that time and 0.9% of total CalFresh transactions (1.77 million total transactions). Despite lack of household-level data, analysis was done using county-level CalFresh demographic and retailer characteristics to assess potential associations with successful transactions.
The strongest indicator of monthly transactions was greater local program access, characterized by additional Walmart stores or Amazon Fresh-serviced zip codes per county. One might initially hypothesize that greater usage would correlate with greater urbanicity, as areas with greater population density generally have higher store count. 27 However, controlling for county-level store availability attenuated the association with rurality and instead suggested that store availability was the largest driver of usage (successful SNAP Online food transactions). This finding is important for promoting wellbeing and healthy eating initiatives as it highlights the importance of store availability itself as a characteristic of SNAP Online usage. Counties with more robust SNAP Online program coverage saw greater program use, whereas areas with less SNAP Online availability used the program less and were more likely to be rural. On average, there were 7.24 Walmart stores per urban county, 0.59 stores per suburban county, and 0.00 stores in the 4 rural counties. Amazon Fresh covered about 30.1% of the total zip codes in urban counties but 0.0% of zip codes in suburban and rural counties.
Overall, Walmart received more transactions than Amazon. This is consistent with in-store purchasing, as Walmart comprises a significant amount of SNAP purchases. It has been reported that prior to SNAP Online’s expansion, Walmart received up to one out of every 5 SNAP dollars. 28 It may have therefore been easier for Walmart to advertise to existing CalFresh customers to shop online. Amazon, lacking brick-and-mortar stores and with potentially fewer initial CalFresh customers than Walmart, may have had to take more steps to acquire new customers. New CalFresh Amazon shoppers would have had to become accustomed to both a new retailer and its online shopping experience.
Analysis using county-level CalFresh characteristics demonstrated usage differences between retailers, county-level demographics, and specific CalFresh populations. A correlation between fewer Walmart transactions and increased county median-income was found, which may reflect the perception that Walmart caters to more low-income shoppers, while Amazon serves more middle- and upper-class shoppers. 29 However, while it was found that counties with higher percentages of demographics with lower average incomes (i.e. female-led, Latino, and disabled SNAP households)30-33 were associated with fewer Amazon purchases, the lack of individual-level data inhibits the ability to draw conclusions on population shopping preferences and requires further investigation. To illustrate, counties with a higher percentage of Asian CalFresh population reported greater Walmart transactions, even though Asian households generally have higher average incomes. 33 No statistically significant differences in SNAP Online utilization were found for county-level percent of Black and White CalFresh households.
Results also revealed observations on transaction timing, a topic that has been closely studied in the literature for regular SNAP transactions. Consistent with in-person purchases, shopping trends at each retailer varied across the benefit month. Spending decreased during the third week of each month, and then increased through the first and second weeks. This likely coincides with California’s benefits issuance timeline, which staggers CalFresh dispersal from the first to the 10th day of the month. 34 Previous studies have found that most SNAP benefits nationwide are spent early in the month, suggesting that online SNAP purchasing habits mirror those of in-person shoppers. 35
Policy Implications
Lessons from the first 7 months of SNAP Online in California are important for understanding what may and may not have worked in the roll-out of this new program, and can inform future social service programs, particularly those designed to improve access to goods or services.
The observation that usage was tied to store availability suggests that special consideration should be given when thinking about ways to support rural and suburban communities in future programs that involve the provision of goods and services. Service provision and infrastructure might be reduced or nonexistent in these areas as compared with urban zones, as was the case for SNAP Online in California, where the approved retailers at the time (Walmart and Amazon Fresh) oriented their logistics around more densely-populated centers. If government programs rely on public-private partnerships, an awareness that private sector companies or services may be less present in less urban areas (as there is likely less of incentive for certain industries to expand operations in areas with fewer people, as it is may be less profitable or economically feasible) is necessary.
At the same time, these initial insights can be considered when evaluating how recent funding designated for SNAP Online—such as the American Rescue Plan of 2021 and the subsequent Consolidated Appropriations Act of 2021 (which included funding for the development of an online platform to facilitate the ability of farmers and small businesses to participate in SNAP Online)—should be allocated in the coming years to ensure that SNAP Online can be most effective and equitable.16,36
The relatively low initial number of SNAP Online transactions as a percent of total SNAP transactions demonstrates that the program served a small segment of the CalFresh households during the first several months, potentially being inaccessible by certain demographics and populations. When considering the introduction of other health promotion programs in the future, establishing partnerships and working with community-based organizations to increase awareness of such programs and provide support for using digital services, as applicable, may be a useful supplement. For example, programs like SNAP-Ed could develop and offer multi-media resources to assist SNAP shoppers with participating in new initiatives and navigate novel platforms and tools, such as online grocery. Certain states did try to work with community organizations to increase awareness of SNAP Online when it was first launched, but efforts were not consistent across states nor uniformly implemented.
Investment and innovation in a similar program to SNAP Online, WIC Online, is also increasing. The Consolidated Appropriations Act of 2021 instituted a Task Force to investigate how developments in WIC online ordering, purchasing, delivery, pick-up, and self-checkout could improve program equity, access, and convenience. 36 The USDA’s Food and Nutrition Service established an accompanying grant in partnership with the Gretchen Swanson Center for Nutrition to fund pilot projects with nationwide public, private, and nonprofit partners, including Walmart. 37 In December 2021, President Joe Biden issued an Executive Order, supporting the rapid and equitable implementation of WIC online shopping. 38 WIC participant demand for online ordering and purchasing is also high. A multi-state survey by the National WIC Association found that the most common reason participants cited for not using all of their benefits in a given month during 2020 was the inability to use WIC to order groceries online, 39 and a mixed methods online ordering pilot study in Tennessee elicited WIC participant satisfaction. 40 Lessons learned from the early implementation of SNAP Online may translate to more effective WIC Online implementation. For both programs, equitable access may be improved by making pick-up and delivery available in as many regions as possible by including more retailers in the program, expanding existing brick-and-mortar store and delivery access, and innovating specific solutions to address access in rural regions. Companies, governments, and researchers could engage SNAP and WIC participants in the design and improvement of digital shopping interfaces, to overcome challenges in limited internet and device access, digital literacy, and trust in online shopping interfaces.
Limitations
SNAP Online transaction data was only available at the county-level. Therefore, it was not possible to assess SNAP Online usage for more specific regions within a county, and only county-level SNAP demographics could be used.. There was also a limited number of rural counties in the state; as such, expanding this analysis to other states with rural regions could help supplement findings. Additionally, since P-EBT data was not disaggregated by county, and all transactions were grouped into a state-level variable, it could not be included in the county-level analysis. In recent months, more stores have been approved for SNAP Online in California. 41 While the aim of this paper was to assess initial program access in California and usage during the weeks in which SNAP Online was first available in the state, repeating this analysis with more recent information could provide further insights into implementation progress after the 7 months of SNAP Online in California.
Further Research Areas
This paper only begins to address many key questions surrounding the new SNAP Online program. These results revealed a significant number of ‘food merchandise’ returns for both retailers, with a higher rate for Walmart. More research is needed to understand the causes of returns and their frequency which could be useful for both finding solutions that dually reduce customer difficulties and retailer losses as well as supplementing the existing literature on online consumer purchasing behavior. 41 There is also the opportunity to replicate this research in additional states with differing demographic and geographic characteristics. Understanding the quantity and type of retailers that provided services in the rural, suburban, and urban regions elsewhere in the United States may help identify where certain retailers might be more likely to participate in the program. Such research could identify how SNAP Online usage by socioeconomic and demographic group might have varied between states due to other characteristics, such as different outreach strategies used by local governments or support efforts offered by community organizations.
At the same time, supplementary qualitative research and interviews would be valuable for augmenting quantitative findings. Such insights would provide greater detail and perspective on the desires and difficulties of SNAP consumers and would greatly enhance the existing literature. Research that employs an implementation science perspective may also help with pinpointing access barriers and consumer preferences that influence program usage and behavior. In particular, digital literacy and access is a major area for further studies. Given that the internet and/or digital device ownership is needed to use this program, research that maps areas lacking digital infrastructure would be useful for highlighting areas where SNAP Online is available but inaccessible. Assessing if or how interventions to improve digital literacy in certain populations—such as the elderly—could impact SNAP Online usage and potentially health outcomes would be an interesting body of research that could support health promotion. Together, these findings could inform the more equitable expansion of SNAP Online and other e-government programs. As program implementation continues, it will also be important to reanalyze purchasing trends over longer time periods. This could enhance the research community’s general understanding of the reach and success of SNAP Online and how external events, such as economic and political shocks, might influence utilization of the program.
Conclusion
This paper contributes to the literature by providing insight into the newly-expanded SNAP Online program during its initial roll-out in 2020. Analysis of the first 7 months of implementation highlights uptake and usage trends in California during the critical roll-out period. Lessons from this analysis may inform future health promotion activities, such as nutrition pilot programs and initiatives—such as WIC Online—and may help policy makers and practitioners consider strategies for making new programs more accessible and equitable, particularly during times of need such as public health emergencies. Preliminary data about SNAP Online usage and uptake has mostly been reported in aggregate—at the national or state level—and rarely highlights differences between retailers. Some research has begun to explore online purchasing habits for the general population, such as the finding that online shoppers tend to spend more per transaction and purchase more items than they would in-store shopping.
41
Initial research has also started to assess potential barriers facing SNAP shoppers when using online interfaces and warns of potential concerns such as targeted marketing and restrictive shipping fees. This article contributes to the literature by providing one of the first analyses that uses county-level SNAP Online transactions data for a state. By assessing the first 7 months of program implementation, this research indicates usage trends by county-level demographics and county characteristics. In doing so, this work suggests potential differences in transactions and retailers based on county median income and county-level percentage of certain CalFresh populations. This research also highlights the importance that store access, rather than just rurality, has in influencing SNAP Online usage rates. Insights from this research are valuable for assessing the reach and usage of this program during its first roll-out and may inform future nutrition and social service initiatives such as WIC Online, particularly during times of crises or health emergencies. Acknowledging that store availability, rather than just rurality, was a driving factor for program usage demonstrates that thought must be given to access points and infrastructure when designing programs that rely on public-private partnerships. Lessons learned from this work may inform the deployment of recently authorized government funding for SNAP Online to make the program as equitable and impactful as possible.‘So what?’ Section
What is already known on this topic?
What Does This Article Add?
What are the Implications for Health Promotion Practice or Research?
Footnotes
Acknowledgments
The authors of this paper would like to thank the Harvard Food Law and Policy Clinic for their legal advice and support in navigating the Public Records Request system and understanding Freedom of Information Act regulations across the country. The authors are also grateful to the unBox community and advisors for their feedback and support throughout the researching process as well as the California’s Department of Social Services and the CalFresh Public Records Request team for their advice and assistance in gathering this public records data.
To access or view our analysis and raw data, please contact the corresponding author.
Author Contributions
ISF conceptualized the study, led the analysis and writing, assisted with data analysis, and revised the manuscript. CL helped lead and conduct data analysis and drafted and revised the manuscript. CTH and AMP contributed to the drafting and revision of the manuscript. CDN contributed to data collection and manuscript revision. SYL helped with data analysis. PER, EJB, and EBR reviewed and revised the manuscript and supervised the study.
Declaration of Conflicting Interests
The author(s) declared no potential conflicts of interest with respect to the research, authorship, and/or publication of this article.
Funding
The author(s) received no financial support for the research, authorship, and/or publication of this article.
Research Ethics
This study and research was deemed exempt from the Institutional Review Board (IRB) at Stanford University.
