
Abstract
This study examines the relationship between growth and economic prosperity in the 100 largest U.S. metropolitan areas to determine whether certain benefits commonly attributed to growth are supported by statistical data. The annual population growth rate of each metro area from 2000 to 2009 is used to compare economic well-being in terms of per capita income, unemployment rate, and poverty rate. The study finds that faster growth rates are associated with lower incomes, greater income declines, and higher poverty rates. Unemployment rates tend to be higher in faster growing areas, though the correlation is not statistically significant at the 95% confidence level. The 25 slowest growing metro areas outperformed the 25 fastest growing in every category and averaged $8,455 more in per capita personal income in 2009.
Introduction
This is a study of how income, unemployment, and poverty are influenced by growth rates in the 100 largest U.S. Metropolitan Statistical Areas (MSAs). The purpose of this research is to obtain a better understanding about the statistical relationship between growth rates and basic measures of the economic well-being of residents of these metro areas.
Most cities and metro areas in the United States are actively pursuing growth through a combination of public policies, investments, tax incentives, and subsidies. Growth has many economic, social, and environmental impacts, but this pursuit of growth is typically based on a stated desire to provide jobs and economic prosperity for people living in the area. “We have to grow to provide jobs” or even “We have to grow or die” are common axioms from local officials. The “grow or die” rhetoric suggests that there are dire economic consequences to not growing. These statements favoring growth are usually made without evidence as to their validity. They seem to be based on the assumption that the additional jobs that may result from expansion of an urban area will benefit existing residents by giving them more employment opportunities and better wages.
Public policies and plans regarding urban growth typically involve trade-offs between costs and benefits. Local residents may view a policy to encourage land development or growth as negatively affecting their quality of life through increased traffic congestion, environmental quality impacts, loss of farm and forest lands, and loss of amenity values (e.g., tranquility, sense of community, or open space). They may also be concerned about higher taxes to fund the cost of the new public infrastructure (roads, schools, sewer and water systems, etc.) required to serve growth. However, the prospect that new growth will bring jobs and economic prosperity that may benefit local residents is often viewed as compelling enough to outweigh these costs. This study seeks to gain insight into whether these employment and economic benefits are supported by empirical data.
In addition to examining how past growth affects recent employment and economic conditions, this study looks at how these 100 metro areas fared during the Great Recession. The Great Recession officially lasted 18 months. It started in December 2007 and ended in June of 2009. 1 Although the effects of this recession continue, the official period of the recession is included within the data reported here. It is possible to compare the impacts of the recession with the pace of growth in each metro area.
The study concludes with a comparison of the 25 slowest growing metro areas with the 25 fastest growing to see which group fared the best in terms of the prosperity indicators used in this study.
For this study, growth rates are based on the average annual rate of population growth over the 9-year period of study from 2000 to 2009. 2 Population growth and some other data series were carried back to 1990 for additional evaluation, as noted in the text. The average annual rate of population growth provides an indication of the pace of growth in each metro area. All population data are from the U.S. Census. 3
Use of the term growth with regard to metro areas could refer to population, land area, number of buildings, or economic product. Measurement of the growth of metro areas, however, typically defaults to population growth as the baseline indicator of size and rate of change. This may be partly because of the accessibility of population statistics. It is also, however, because the number of people present is a very real indicator of the other growth factors associated with people, such as developed land area and total economic activity.
Urban growth is directly linked with population growth, as more people require more housing units and commercial buildings for employment and shopping. There is a strong linear correlation between urban growth (as reflected by change in total housing units) and population growth at the state level, so growth in housing units can be expected to track population growth fairly closely. 4
The 100 largest MSAs were selected based on 2009 population estimates from the U.S. Census for MSAs in the 50 states and District of Columbia. The Office of Budget and Management defines the MSAs, and the most recent listing available from the U.S. Census was used for this study (December 2009). The study sample of 100 MSAs has a total 2009 population of 201,501,813, which represents 78% of the population in all 366 MSAs. This constitutes a substantial study sample representing 66% of the total U.S. population. The 100 MSAs range in size from a population of 510,000 to 19 million.
Background
This study builds on findings from two prior studies. The first study by Molotch (1976) examined growth rate and unemployment in Standard Metropolitan Statistical Areas (SMSAs) in the United States from 1950 to 1970. Molotch compared the 25 fastest growing SMSAs with the 25 slowest growing and found no significant difference in unemployment rates between the two groups. The finding that the faster growing metro areas did not have better employment conditions suggests that growth does not generate employment benefits, as is commonly believed.
The second study by Gottlieb (2002) compared population growth rates with changes in per capita income for the 100 largest MSAs from 1990 to 1998. The rate of income growth was found to have no statistically significant relationship with population growth. This finding suggests that, contrary to conventional wisdom, growth may not be associated with increasing income.
The relationship between poverty and population growth rate in U.S. MSAs has been unclear. Whereas past economic expansion has been associated with the lowering of poverty rates, more recently growth has not had the same beneficial effect on poverty because of increases in income inequality (Gundersen & Ziliak, 2004).
There is the question of what is the best time period to use in evaluating relationships between growth and economic prosperity measures. Studies have examined the impacts of economic development programs on employment over various periods ranging from 1 year to 15 years. There are both short-term and longer-term responses depending upon which variable is being examined (Partridge, Rickman, & Li, 2009). Longer time periods seem most appropriate for studying prosperity measures, as we are interested primarily in sustained results, rather than momentary effects.
The concept of prosperity is commonly associated with economic well-being as measured by factors such as those examined in this study—income, unemployment, and poverty rates. It also may be gauged by the gross domestic product, which measures the total economic activity of a country, state, or region. 5 Other models for prosperity are being advanced that take into account noneconomic factors of human well-being, such as health, satisfaction with life, and happiness (Jackson, 2009).
Population growth of a city or region is commonly thought to be associated with prosperity and well-being (Carr, Bae, & Lu, 2006). Population growth is often equated to prosperity in the popular media (e.g., El Nasser, 2011; Welch, 2011). Economic development efforts can lead to competition between cities to attract residents and businesses (Basolo & Huang, 2001), resulting in population growth.
The relationship between local growth and prosperity has not received a great deal of attention from researchers. The dearth of research is remarkable, given the degree of public investment in growth and the level of controversy often surrounding local growth issues. State and local governments spent $289 billion on capital construction in 2009, according to the U.S. Census. Most of this expenditure went toward building new schools, roads, sewage systems, and water treatment systems that support growth.
Given that growth can profoundly influence communities, we can benefit from learning more about these effects.
The degree to which growth can be influenced by economic development, growth management, and other local government policies is an ongoing debate. Regardless of this debate, there are many local officials and leaders who believe that they can affect growth (Carr et al., 2006). Local officials direct significant government resources, such as tax exemptions and infrastructure provision, toward growth-inducing strategies based on this belief. There are also many examples of policies in state and regional planning programs that mandate growth accommodation through public planning and investment (Zovanyi, 1998). Furthermore, growth management policies have been shown to measurably affect local growth (Nguyen, 2007).
The political campaign finance system in most cities enables wealthy interests to influence local elections. Progrowth constituencies of developers, real estate professionals, financial institutions, and business advocacy organizations can overwhelm individual campaign donors in terms of total funding (Krebs, 2005). One of the results is that city staff tend to align themselves with progrowth politics (Calavita & Caves, 1994).
The progrowth agenda of many cities is apparent when they are examined closely (Carr et al., 2006; Vojnovic, 2003). Growth promotion can be explained by a number of factors (Hammer & Green, 1996). The exact form of growth being promoted is often unclear. Cities may be simultaneously pursuing job and income growth while pursuing population growth and urban expansion.
The “grow or die” rhetoric widely used in the local public policy arena is commonly associated with economic development approaches that involve increasing urban growth through expansions of urban growth boundaries or city limits and the planning, zoning, and permitting of large tracts of additional land for future urban development. Urban growth is directly linked with population growth, as mentioned earlier.
Although economic growth is often the explicitly stated goal of public policies and economic development programs, other political economy influences tend to direct these goals to achieve other purposes (Dewar, 1998). The political economy of the “urban growth machine” effectively characterizes what some of these other purposes might be (Molotch, 1976). Urban growth serves the economic objectives of certain wealthy and politically influential groups. This helps explain why local rhetoric about the need for economic growth tends to manifest itself as programs to promote more urban growth, and hence population growth.
The argument frequently advanced by growth proponents is that urban growth will generate benefits in terms of jobs and economic prosperity for the local residents. It seems more likely, however, that the opposite is true: The creation of new jobs will attract newcomers to move into the area. Similarly, the loss of local jobs will tend to cause people to move away (e.g., El Nasser, 2010). Thus, jobs are a major driver of growth rather than growth creating jobs. This is supported by studies showing that newcomers ultimately end up filling most new jobs (Bartik, 1993). In-migration has been found to be the dominant response to job creation at the metropolitan area and state levels, indicating that newcomers tend to be the primary beneficiaries of new jobs (Partridge et al., 2009).
Some studies have found that the growth of cities may not be associated with greater local prosperity and well-being. Bodley (1999) finds evidence that growth causes the rich to get richer and poor to get poorer and more numerous. According to Bodley, the wealthy elite are often the main beneficiaries of local growth, in addition to being its main proponents. Molotch (1993) finds that “contrary to popular wisdom, there is little evidence that growth eases problems of unemployment, high housing costs, or impoverished city budgets. (p. 32)” And economic development efforts to stimulate local economic growth through business incentives may result in poorer economic performance (Zheng & Warner, 2010).
The idea that cities could grow too much, that there is a limit to social utility from increasing city size, or that there may be an optimal city size has deep roots in the literature (Duncan, 1949; Mumford, 1938). The case that cities, rather than growing to an optimal size, grow to their maximum size (Huszar & Seckler, 1975) provides some rationale for controlling city growth. Further rationale has come from the environmental and sustainability movements seeking to mitigate the impacts of growth (Warner, 2006).
Increasingly researchers are recognizing that there may be limitations to quantitative growth. Population and consumption levels cannot expand endlessly with a finite natural resource base. As human population approaches seven billion, many are asking, “Can we have prosperity without growth?” One approach is to redefine prosperity from traditional economic terms to other measures of well-being (Bergmann, 2010; Jackson, 2009). Such measures of well-being may include health, quality of life, and happiness (Bok, 2010). Another approach is to recognize that growth has significant costs and may not generate all the economic benefits often attributed to it. Moving away from the growth model and toward a sustainability model leads to a new framework for economic development (Greenwood & Holt, 2010).
Some researchers have begun to examine the case of cities with stable or declining populations to see how prosperity and well-being are affected (Delken, 2008; Hollander, 2011). These cities tend to fare better than conventional wisdom would suggest. Residents of cities with stable and shrinking populations have been found to have similar or even higher life satisfaction than those in growing cities.
Income and Growth
Data for 2009 per capita personal income were compared with the average annual population growth rate from 2000 to 2009 for each MSA. Per capita income was selected as the basis for comparing income changes over time because other measures, such as median household and family income, can change over time due to changing household and family composition. The income data from the U.S. Bureau of Economic Analysis (BEA) includes all personal income sources. It is calculated by taking the total personal income for the metro area and dividing it by the total population.
As shown by the graphical data and trend line in Figure 1, there is a strong tendency for income to be lower in faster growing metro areas. This is a strong correlation with a >99% level of confidence. 6 The data show that faster growth corresponds with lower incomes. The slope of the trend line shows a decline of almost $2,500 in per capita income for each 1% increase in growth rate. This finding contradicts the conventional wisdom that more growth will benefit local residents by enabling them to find higher paying jobs.

2009 Per capita personal income compared with 2000-2009 growth rate for the 100 largest U.S. Metropolitan Statistical Areas
Finding 1: Incomes tend to be higher in metro areas with lower growth rates.
To see how personal income changed for each metro area in 2009, the percentage change from the previous period (2008) was compared with growth rates. Most MSAs had a drop in per capita personal income in 2009 because of the recession. Figure 2 shows that faster growing metro areas had a bigger drop in income than did slower growing areas. This correlation is statistically significant at the 99% confidence level.

Change in per capita personal income 2008-2009 compared with 2000-2009 growth rate for the 100 largest U.S. Metropolitan Statistical Areas
Finding 2: Faster growing metro areas tended to have a bigger drop in income in the past year (2009).
The overall drop in personal income is a result of the Great Recession caused by the bursting of the residential real estate bubble and the subprime mortgages and financial derivatives that fueled it. To capture the full impact of the Great Recession, the change in income from 2007 to 2009 was examined. As shown in Figure 3, a very strong correlation exists between faster growth and declining income during the recession (>99% significance level). Metro areas that grew the fastest from 2000 to 2009 had the greatest declines in personal income. Many of the fastest growing MSAs had income declines of 6% over this 2-year period. (The biggest decline in income was for the New Orleans MSA, which was a statistical outlier severely affected by Hurricane Katrina.)
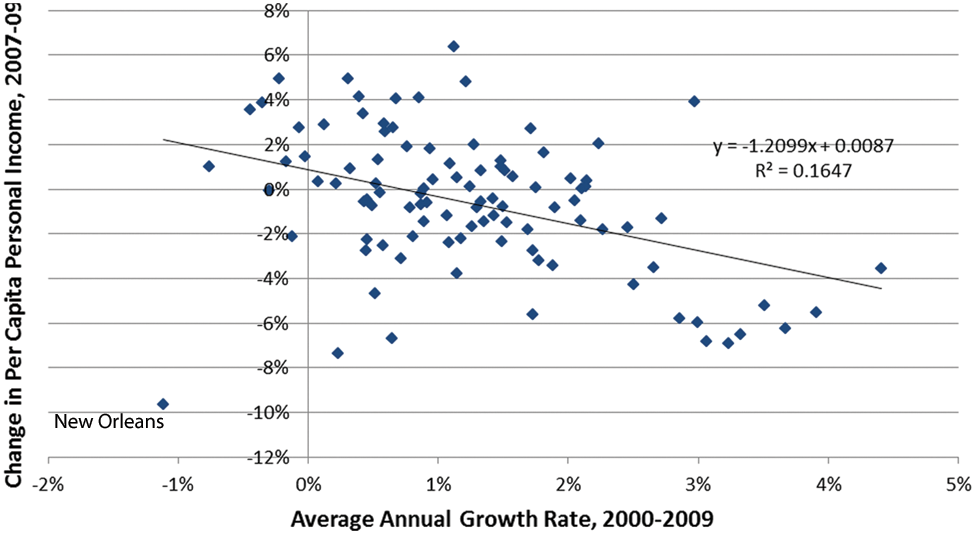
Change in per capita personal income 2007-2009 compared with 2000-2009 growth rate for the 100 largest U.S. Metropolitan Statistical Areas
The data show that the fastest growing metro areas were the hardest hit by the recession. Many of the slower growing areas fared much better. Many areas with stable or declining populations saw increases in personal income.
Finding 3: Metro areas that grew faster from 2000 to 2009 tended to have greater declines in personal income during the Great Recession (2007-2009).
As shown in Figure 4, the percentage change in per capita personal income over the entire 2000 to 2009 period showed a similar statistically significant correlation with growth rates (>99% significance). Although all MSAs showed gains in income over the 2000-2009 period, metro areas with higher growth rates had significantly lower gains than slower growing areas. The linear correlation indicates that a metro area with a stable nongrowing population would tend to see a 43% higher income gain than an area growing at 3% per year.
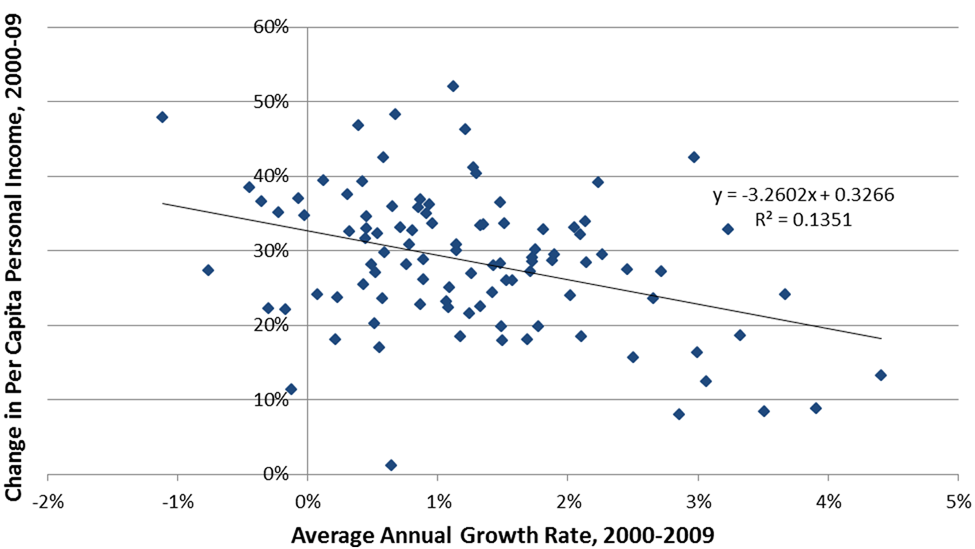
Change in per capita personal income 2000-2009 compared with 2000-2009 growth rate for the 100 largest U.S. Metropolitan Statistical Areas
Finding 4: Metro areas with slower growth had bigger income gains over the 2000 to 2009 period.
The slope of the linear correlation of 2000 to 2009 personal income change with growth rate is not as steep on an annual basis as it is for the income change for either the 2008-2009 or 2007-2009 periods, indicating that faster growing metro areas were more severely affected by the recession.
Finding 5: Per capita personal income in faster growing metro areas was more severely affected by the recession.
A remarkable finding from the statistical analysis of the relationship between personal income and growth rates is that the correlations for income were even stronger with population growth occurring over the longer 1990 to 2009 time period, and stronger still for the prior 1990 to 2000 period. This applied to 2009 income levels and all the income changes described above for the following periods: 2008-2009, 2007-2009, and 2000-2009. All of these correlations were significant at the 99.9% confidence level. This finding indicates that the per capita income levels of a metro area may be strongly influenced by the rate of growth occurring in a prior decade. In this case, growth rates in the 1990 to 2000 period showed the strongest correlation to changes in income even in the most recent 2008-2009 period. Faster growing metro areas during the 1990 to 2000 period had lower income growth over the following 9 years and had bigger declines in income during the 2007-2009 recession.
Finding 6: Higher growth rates occurring 10 or more years in the past have a stronger correlation to lower incomes in 2009 than do more recent periods, indicating that there may be long-term adverse consequences to local residents from faster growth.
Unemployment and Growth
The unemployment rate from the U.S. Bureau of Labor Statistics (BLS) provides an index for the local employment conditions that reflects both the supply and demand for jobs. Both the 2009 unemployment rate and the change in unemployment rate over the 2000-2009 period were compared with growth rates (2000-2009). If growth produced employment benefits for local residents, one would expect to see unemployment rates tend to be lower for metro areas with faster growth.
Figure 5 shows that the 2009 unemployment rate does not correlate closely with growth rate. There is no statistically significant relationship between growth rate and unemployment. The trend line shows there is a slight tendency for metro areas with higher growth rates to have higher unemployment rates.

2009 Unemployment rate compared with 2000-2009 growth rate for the 100 largest U.S. Metropolitan Statistical Areas
Finding 7: Metro areas with faster growth rates do not tend to have lower unemployment rates.
This finding is inconsistent with the belief that more growth will create more jobs, which will help local unemployed persons find work. There is no clear employment benefit shown from faster growth. There may be new jobs created as a result of growth, but apparently there are more newcomers and job seekers moving in than there are new jobs being created. The result is that local unemployment rates remain more or less the same, but the total number of unemployed people increases with growth.
Unemployment data provide a gross indicator of the local job market, but do not provide information about the quality of the new jobs being created, such as salaries and benefits. Given that there is no statistically significant relationship between growth rate and unemployment, the earlier findings that per capita income tends to be lower in faster growing areas suggests that new jobs tend to be lower paying in these areas.
The change in the unemployment rate over the period gives more information about how employment conditions have changed in each metro area. The change in unemployment rate will reflect improving or worsening employment conditions that would not show up in ending period unemployment rates. The change in unemployment rate is calculated as ending period unemployment rate minus starting period unemployment rate. A positive change in the unemployment rate indicates that unemployment has increased (undesirable).
The unemployment rate increased over the 2000-2009 period for all 100 MSAs, reflecting the effects of the recession. As shown in Figure 6, there is a weak tendency for the change in unemployment to be worse (higher) in faster growing metro areas. These results were also not at the statistically significant level. The conclusion from these data is that faster growth is not generating improved employment conditions. Similar to the finding for ending period unemployment, the “conventional wisdom” that more growth will produce improved employment conditions is not supported.
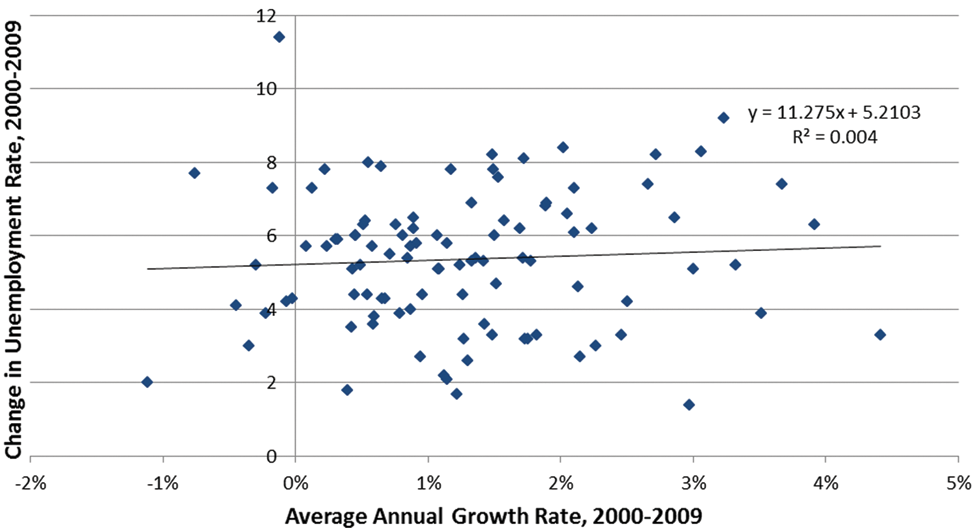
Change in unemployment rate 2000-2009 compared with growth rate for the 100 largest U.S. Metropolitan Statistical Areas
Finding 8: Metro areas with faster growth rates do not tend to see their employment conditions improve more than slower growing areas.
Poverty and Growth
The last statistic examined in this study is the poverty rate, which is the percentage of the population living at or below the official poverty level. 7 Poverty rates for 2009 from the American Community Survey were compared with growth rates for the 2000-2009 period. As shown in Figure 7, higher growth rates correspond to higher poverty rates. The correlation is fairly strong (>90% level) but is not quite significant at the 95% confidence level.
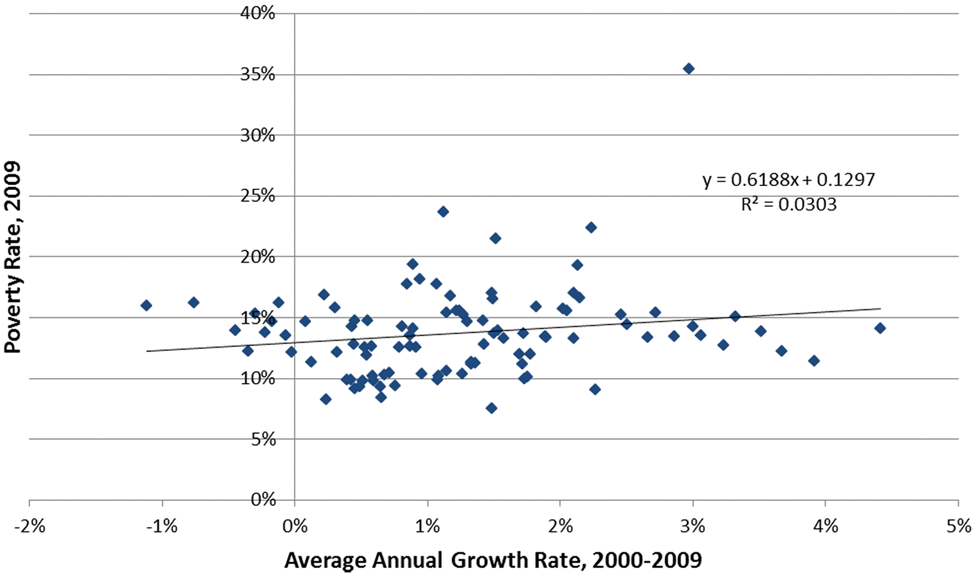
2009 Poverty rate compared with 2000-2009 growth rate for the 100 largest U.S. Metropolitan Statistical Areas
Finding 9: Faster growth rates tend to correspond with higher poverty levels, but not at the statistically significant 95% confidence level.
An interesting result of the statistical analysis is that the 2009 poverty rate correlates more strongly with population growth rates over the longer 1990 to 2009 period and correlates at the 95% confidence level with growth rates over the prior 1990 to 2000 period. The implication of this finding is that current poverty rates may be influenced by past growth—even growth occurring more than a decade ago. If this is the case, policies to encourage more growth could produce longer term adverse consequences for the area 10 or more years into the future.
Finding #10: Metro areas with higher growth rates during the previous decade (1990-2000) tend to have higher poverty rates in 2009.
Fastest Growing Versus Slowest Growing MSAs
To gain more insight into how growth rates affect local economic conditions, the 25 slowest growing MSAs of the 100 largest were compared with the 25 fastest growing MSAs. The 25 slowest growing MSAs represented an essentially stable population, averaging less than 0.1% per year annual growth. The 25 fastest growing MSAs averaged 2.7% per year annual growth. The average growth rate for all 100 MSAs in the study was 1.3% per year.
As shown in Table 1, the slowest growing MSAs outperformed the fastest growing in every category. The 25 slowest growing MSAs averaged almost 1% lower unemployment rates, 2.4% lower poverty rates, and a remarkable $8,455 more in per capita personal income in 2009. They also had larger income gains from 2000 to 2009 and saw significantly lower declines in income from the recession (2007-2009).
Comparison of the 25 Fastest and 25 Slowest Growing of the 100 Largest Metropolitan Statistical Areas for the 2000-2009 Period
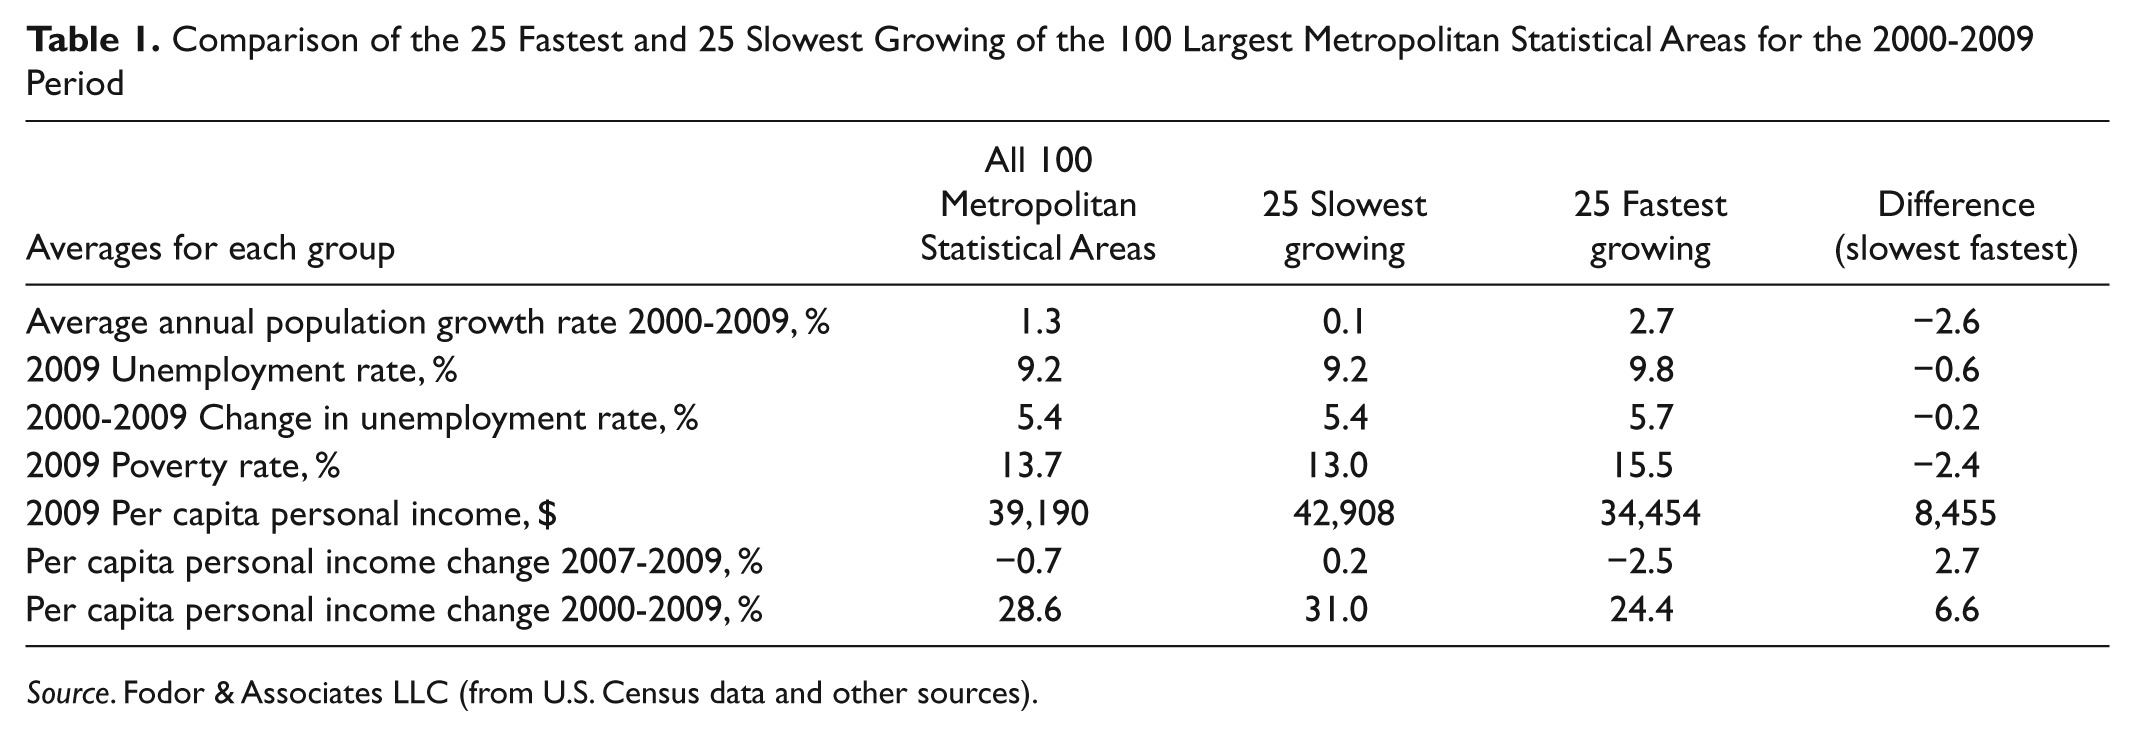
Source. Fodor & Associates LLC (from U.S. Census data and other sources).
Finding 11: The slowest growing metro areas outperformed the fastest growing areas in every category used in this study to reflect the prosperity of local residents. Residents of the slowest growing metro areas averaged $8,455 more per capita in personal income than those of the fastest growing areas.
This finding suggests a need to reevaluate our thinking about growth. The slowest growing group of metro areas had a nearly stable population, yet significantly outperformed the fastest growing group.
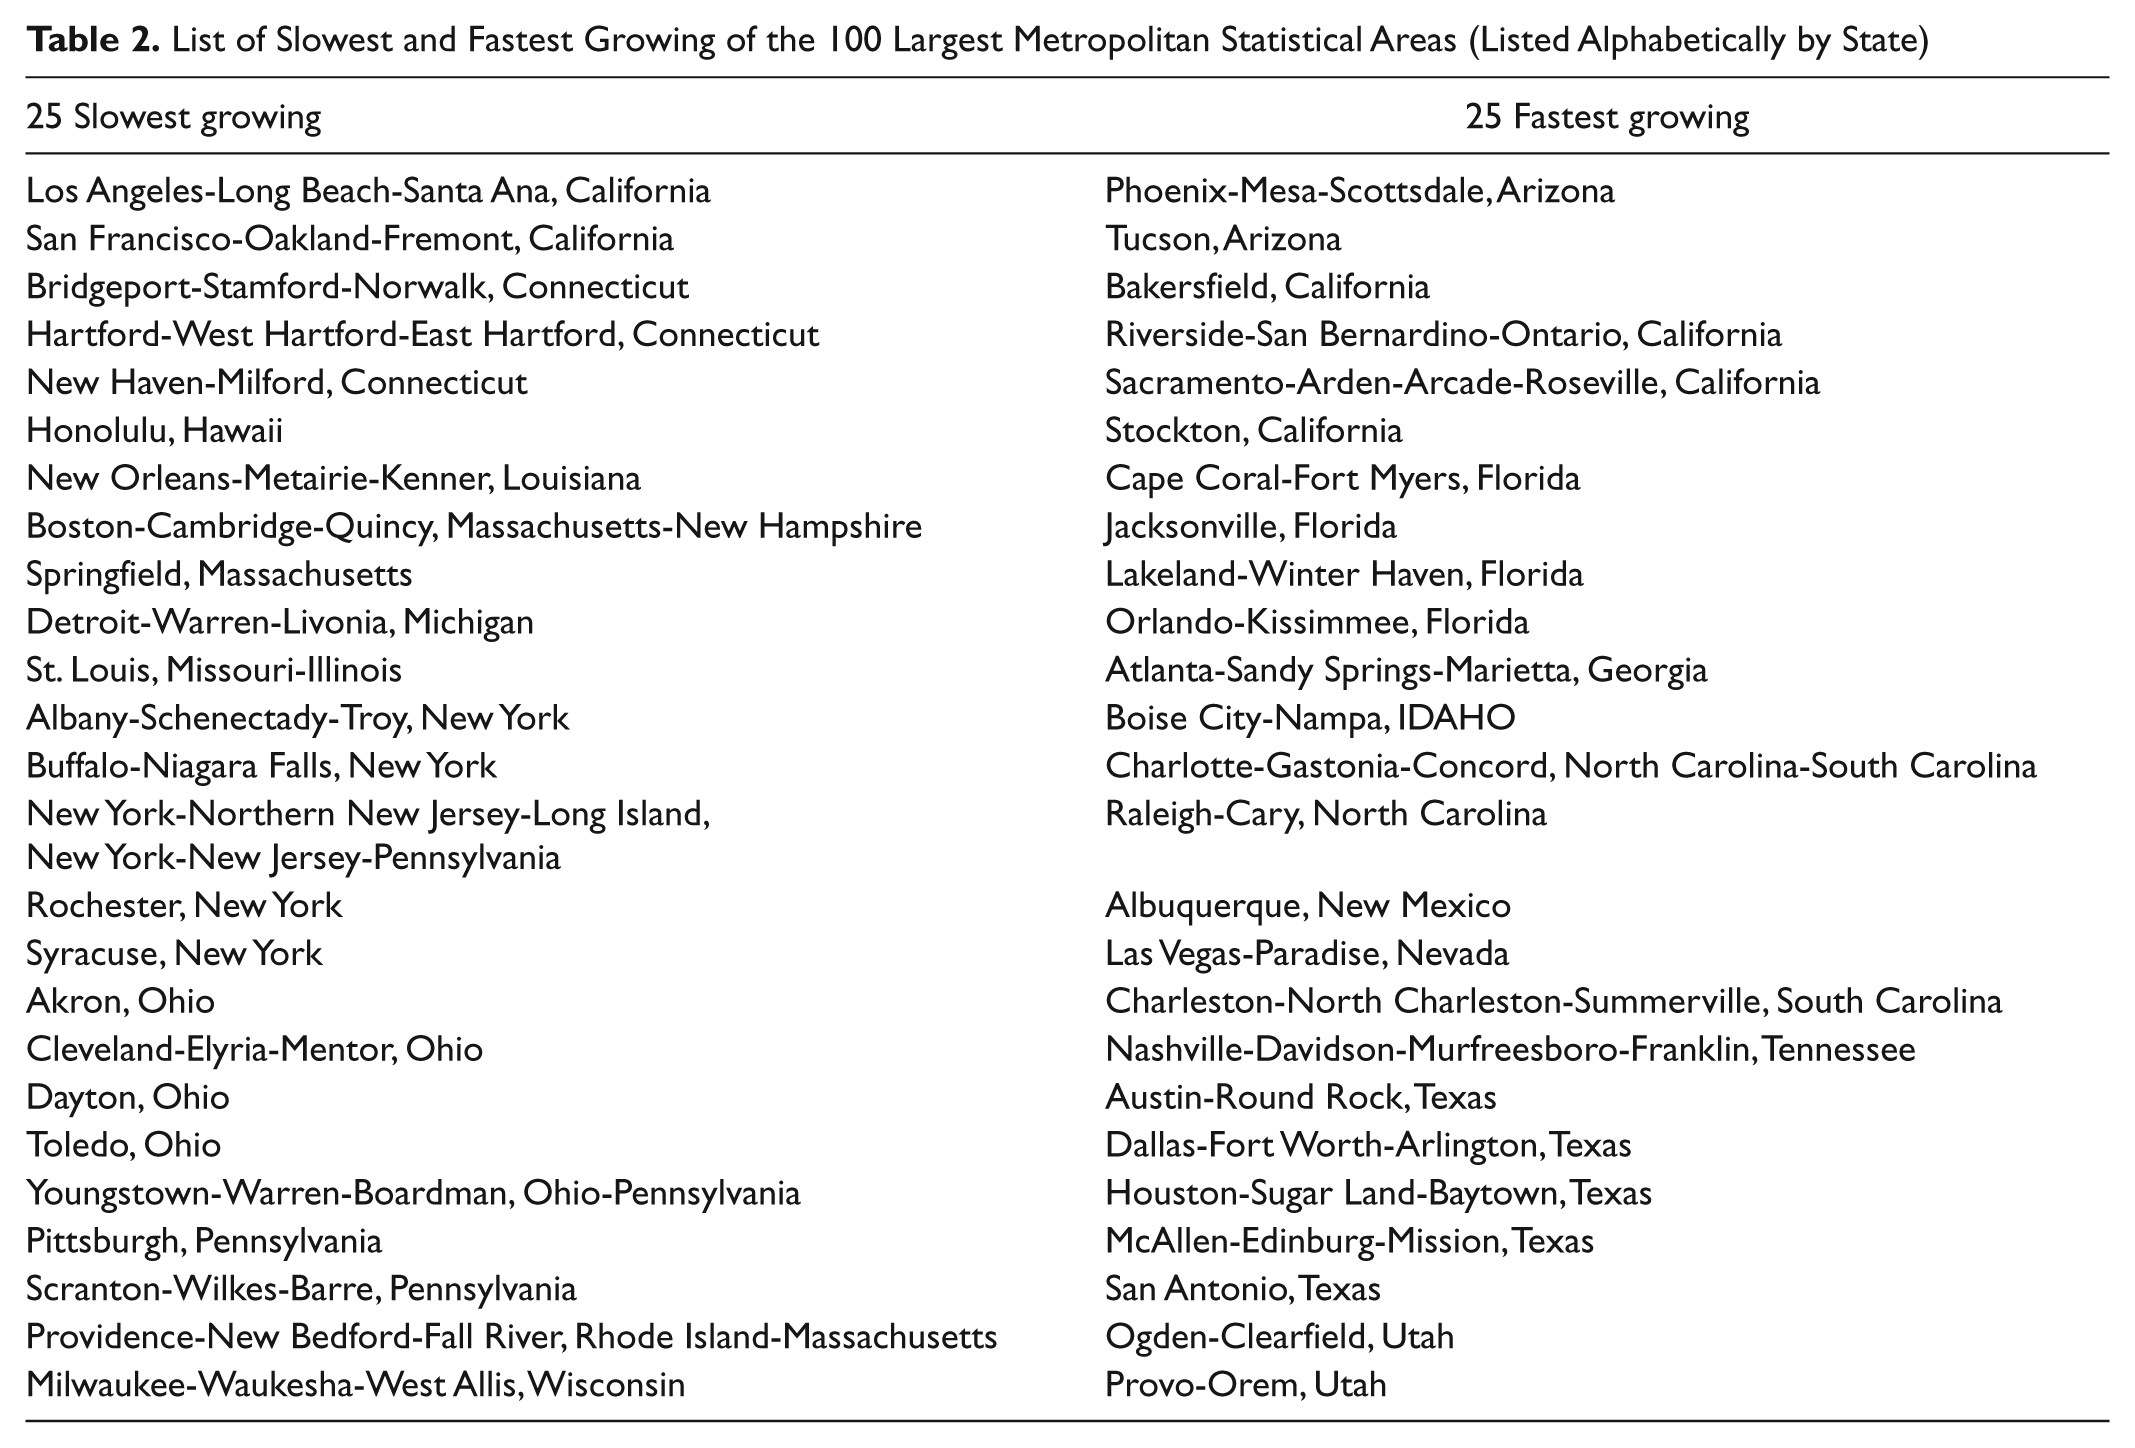
A listing of the 25 slowest and 25 fastest growing MSAs is provided in Table 2. The MSAs are ordered alphabetically by state. The slowest growing MSAs are located in 13 different states, dominated by Connecticut, New York, and Ohio. The fastest growing MSAs are located in 12 different states, dominated by California, Florida, and Texas. The average 2009 population size of the slowest growing MSAs is 1,984,145 and the fastest growing is 2,736,578.
List of Slowest and Fastest Growing of the 100 Largest Metropolitan Statistical Areas (Listed Alphabetically by State)
Conclusions
Most cities in the United States have operated on the assumption that growth is inherently beneficial and that more and faster growth will benefit local residents economically. This examination of the 100 largest metro areas, representing 66% of the total U.S. population, shows those that have fared the best have the lowest growth rates. Even metro areas with stable or declining populations tended to fare better than fast-growing areas.
This study compared income levels, unemployment rates, and poverty rates with growth rates for each metro area. In every category, faster growing metro areas fared worse than slower growing areas. Residents of the 25 slowest growing metro areas averaged $8,455 more personal income per capita than in the 25 fastest growing areas. They also had lower unemployment and poverty rates. The 9-year study period captures the effects of the Great Recession, and changes from 2007 to 2009 show that faster growing metro areas were more severely affected.
These findings clearly indicate that there is more to the economic development equation than merely growth and that growth may not even be a contributing factor. What then accounts for the prosperity advantages found in slower growing metro areas? Reviewers of this study have offered half a dozen possible explanations. These include geographic differences, 8 immigration patterns, industry mixes, labor union influences, housing affordability, and the degree of reliance on real estate development by the local economy.
Another possible explanation is that the dynamics of growth are such that, by itself, it does not promote the general welfare. Instead, other factors often associated with growth may have been responsible for past prosperity. For example, our domestic manufacturing and production capacity that formerly expanded to keep pace with growth is now largely outsourced to other countries. Now, when a U.S. metro area expands and increases its demand for goods, foreign jobs are created to fill that demand and prosperity is generated elsewhere.
The findings of this study may be a result of a combination of the above factors and perhaps others. There is ample room for further discussion and debate to explain these findings and their implications. There is also a need for further research to improve our understanding of this complex topic.
Growth clearly provides benefits to some elements of the local population (see Fodor, 2001; Logan & Molotch, 1987; Molotch, 1976). Foremost among these are the real estate, financial, and land development businesses. Growth generates demand for more housing and commercial space that these businesses build, sell, and finance. Higher demand increases real estate prices, commissions, and loan fees and makes the development business more profitable. These business interests represent a wealthy and politically influential constituency in most cities that advocates in favor of increasing local growth. They are organized and represented through their local trade associations: the home builders associations, the realtors associations, the mortgage bankers associations, and the local chambers of commerce.
Although certain businesses prosper from growth, the balance of the community seems to suffer. The statistics showing that fast-growing areas tend to have lower and declining incomes indicate that any gains by the businesses that directly benefit from growth are more than offset by losses to the balance of the local population. In other words, a small segment of the local population may benefit from faster growth, but the larger population tends to see their prosperity decline.
Growth may be associated with economic development success; however, it is not the cause of that success. The successful economic development program is typically the one that creates new jobs. The new jobs tend to stimulate population growth as people move into the area seeking to take advantage of the new employment opportunities. As a result, growth tends to be stimulated by job creation; but, growth is not creating employment opportunities. Instead, it is reducing them as newcomers fill job openings. Fast-growing metro areas may be viewed as being prosperous simply because people are moving to them, but the data show that these fast-growing areas end up with lower levels of prosperity.
This study found that public policies and economic development strategies that seek quantitative growth of a metro area may have short- and long-term adverse consequences for local residents. A path of high growth today may lead to negative consequences lasting well into the next decade.
Assuming we are interested in promoting the economic welfare of urban residents, we should reevaluate our policy emphasis on growth. The impacts of growth on communities are poorly understood. Given the findings of this study, the magnitude of public investments in growth, and the potential economic consequences for urban residents across the country, more research is clearly warranted on this important topic.
As communities seek the best course for emerging from the recession, new strategies are needed. Continued pursuit of more growth appears unlikely to be the solution. Perhaps the growth model should be replaced by the stable sustainable community model. Under a stable community model, the financial resources formerly required to support growth could be directed to other beneficial investments. Alternative economic development strategies may include localizing economies, restoring local manufacturing and production capacity, and investing in public amenities and quality of life. These strategies could focus on preparing local economies for the future by recognizing global imperatives such as responding to peak oil, addressing climate change, and the need to protect and enhance the natural environment.
Methodology Notes
MSA Description
The general concept of a metropolitan statistical area is that of a core area containing a substantial population nucleus, together with adjacent communities having a high degree of economic and social integration with that core. Each metropolitan statistical area must have at least one urbanized area of 50,000 or more inhabitants. MSAs have fixed geographic boundaries based on counties or their equivalent. For more information, see http://www.census.gov/population/www/metroareas/aboutmetro.html.
Per Capita Personal Income Data Series
Per capita personal income data are obtained from the BEA.
9
According to BEA, “per capita personal income is calculated as the personal income of the residents of a given area divided by the resident population of that area.”
10
These population data are from the Census Bureau’s annual midyear population estimates. According to the BEA,
Personal income is the income received by persons from all sources—that is, from participation in production (such as compensation of employees, income from self-employment, and rental income) and from current transfer receipts from both government (such as Social Security and Medicare benefits) and business (such as pension benefits).
11
All income is in nominal dollars, as reported by the BEA.
Unemployment Data Series
All unemployment data are from the BLS. For unemployment data, the BLS uses a different local area definition for some areas than the Census. Because of the lack of official county designations in some New England states, the BLS classifies 21 metro areas as New England City and Town Areas, or NECTAs. Fifteen of these NECTAs are reported as MSAs by the Census. Unemployment data for the 7 NECTAs included among the largest 100 MSAs in this study represent a slightly different geographic area than the population data for the equivalent MSAs. However, because these data are for the same metro areas and this study focuses on rates of change of each area’s population (rather than absolute values), this geographic difference is unlikely to have a significant effect on the results.
Poverty Data Series
Poverty data were obtained from the 2009 American Community Survey 1-Year Estimates for all MSAs. 12
Statistical Significance
The statistical analysis used in this study is based on the question of whether or not there is a linear relationship between two variables. For example, the question of whether the unemployment rate is related to growth rate is initially examined by graphical representation of the data and fitting of a trend line. The correlation coefficient provides an indication of how well the data match the trend line. The probability that the trend line represents a true correlation is based on the t test for significance. A two-tailed, nondirectional t test is applied to all correlations. A 95% level of confidence in an outcome is the standard research benchmark and is used here (p ho ≤ .05). Some of the correlations in this study have a confidence level of 99% or higher, resulting in particularly strong correlations. Any level of confidence below 95% officially lacks statistical significance. A correlation may exist between two variables below the 95% confidence level, but statistically it is not significant. A finding that the correlation coefficient is very low (close to zero) between two variables is an indication that the two variables are independent of each other.
Footnotes
Declaration of Conflicting Interests
The author(s) declared no potential conflicts of interest with respect to the research, authorship, and/or publication of this article.
Funding
The author(s) received no financial support for the research, authorship, and/or publication of this article.