
Abstract
The contribution of state renewable energy portfolio standards (RPS) to green business and job growth is controversial. This research estimated the contribution of RPS to state green industrial growth empirically by stipulating and econometrically controlling for a range of state economic growth variables and, having done so, adding RPS variables. Our modeling framework assumed that if RPS have any effect on the green economy in a state, the effect occurs after a period of social and economic adjustment processes that began when the RPS were enacted. Our findings indicate that the presence of RPS have no discernible effect one way or the other on green job growth, but the persistence of RPS through time does cause an increase in the number of green businesses.
Introduction
State-level policy developments have in recent years emerged at the leading edge of U.S. energy and environmental policies. Newly established state-level energy policy initiatives have included utility incentive programs, loans and grants for energy innovation, energy audits and retrofits of buildings, and the design, management, and implementation of efficiency and renewable energy programs, among others. The growth and diffusion of such initiatives is attributable to a range of factors including climate change, energy security, energy policy gridlock at the national level, and perceived opportunities for economic development. Carley, Lawrence, Brown, Nourafshan, and Benam (2011) referred to these initiatives collectively as “energy based economic development.”
Among the more popular and widespread state-level energy-based economic development policy initiatives are renewable energy portfolio standards (RPS). RPS policies legislatively promote the adoption of renewable energy technologies in state electricity markets. Typically they establish minimum percentages or amounts of electricity produced or consumed in the state that must, by a given date, come from renewable sources. This minimum as a rule ratchets up over time. Currently, 29 states and the District of Columbia have mandatory RPS programs, and eight have nonbinding programs. 1
Wiser and Barbose (2008) reviewed where RPS policies have been developed, when, and with what design features. They found that RPS vary from state to state in some design features. These include definition of which technologies are eligible to qualify as “renewable,” minimum required amounts of eligible energy, size of increase of obligation over time, and final target levels, as well as the entities under obligation and renewable energy credit market and monitoring and compliance practices. Some states, for instance, mandate a particular mix of biomass, geothermal, solar or wind, whereas others place greater reliance on the market. These differences allow each state to choose the combination of renewable energy sources best suited to its own special circumstances (Carley, 2009; Rabe, 2007; Wiser, Namovicz, Gielecki, & Smith, 2007; Wiser, Porter, & Grace, 2004). At the same time, all RPS are similar in that in one way or another they legislatively set minimum numeric targets for retail electricity suppliers in terms of producing or purchasing certain minimum and increasing amounts of eligible renewable energy over time (Carley et al., 2011; del Rio & Burguillo, 2008; Fischer & Preonas, 2010). They are also similar in that they are typically rationalized and advocated on the basis not only of increasing energy efficiency, reducing carbon emissions, and expanding energy production, but also of stimulating economic development and job creation (Wei, Patadia, & Kammen, 2010). An underlying assumption is usually that continued reliance on fossil fuels is unsustainable, largely because of the large amounts of pollution and waste it produces and the corresponding negative effects on ecosystems, ecoservices, and life support (United Nations Environmental Program, 2008).
Among the state policy goals of RPS are increases in the relative frequency of industries populated by green businesses and jobs that do not generate pollution or waste and that are highly efficient in their use of energy, water, and materials. Although relatively little disagreement occurs in principle over these goals, as a matter of applied public policy widespread consensus is lacking on either the conceptual or operational definition of such businesses or jobs. These definitions carry weighty social, political, and economic implications that stand to shape perceptions, frame debates, and elicit support and criticism. Inasmuch as any particular such definition remains unclear or ambiguous, it risks misleading both theory and practice (Hopson, 2000).
The United Nations Environmental Program defined “green jobs” conceptually as
positions in agriculture, manufacturing, construction, installation, and maintenance, as well as scientific and technical, administrative, and service-related activities that contribute substantially to preserving or restoring environmental quality. Specifically, but not exclusively, this includes jobs that help to protect and restore ecosystems and biodiversity; reduce energy, materials, and water consumption through high-efficiency and avoidance strategies; decarbonizes the economy; and minimize or altogether avoid generation of all forms of waste and pollution. (United Nations Environmental Program, 2008, p. 35)
The U.S. Bureau of Labor Statistics (BLS) later redefined such jobs as ones
in businesses that produce goods or provide services that benefit the environment or conserve natural resources, or “jobs in which workers’ duties involve making their establishment’s production processes more environmentally friendly or use fewer natural resources.” (Federal Register, 2010)
Part of the difficulty in reaching widespread consensus on a single, clear conceptual definition of green jobs is undoubtedly attributable to the broad scope and complexity of considerations involved in conceptually defining and operationalizing the relevant terms. At the same time, however, use of the terms green businesses and green jobs in statements of policy goals without such definition makes it difficult for researchers to establish the empirical findings and factual basis necessary for meaningful policy evaluation and debate.
The clarity and distinctiveness of the definitions of the concept of green jobs is of particular concern in empirical studies such as this one in which inferences are made from sampling particulars to the higher-order policy implications they represent. When in such studies the definitions of the central terms differ from study to study, it becomes practically impossible to make meaningful comparisons between empirical results. In turn, this makes meaningful policy debate out of the question. To be sure, as previously mentioned, some of the prototypical surface similarities of green jobs have been established in the literature. Green businesses and jobs are typically characterized as ones that involve relatively interesting work and produce environmentally benign products. They have been empirically found in industries that employ relatively few production workers for a given level of output and factor usage, provide good compensation, and are export intensive (Becker & Shadbegian, 2009). But at a deeper level it remains difficult to connect the concept of “green jobs” in a clear and referentially transparent way to other established concepts, theories, and uses in social science. Studies may, for instance, differ in terms of what counts as “green,” what counts as a “job,” and what assumptions to use in forecasting and economic modeling (Morriss, Bogart, Dorchak, & Meiners, 2009). As a consequence, detailed empirical assessments of the relative costs and benefits of green jobs policies and programs remain deeply uncertain and contentious (Alvarez, Jara, & Julian 2009; Lesser, 2009, 2010).
In an effort to overcome the host of difficulties involved in the explication of the concept of green jobs, as well as in isolating and counting them, the Brookings Institution together with Battelle Technology Partnership Practice, recently undertook a large-scale multiyear assessment of the magnitude of the “clean economy” in the United States (Muro, Rothwell, & Saha, 2011). Having conceptually defined green jobs as ones that produce or add value to goods and services with an environmental benefit, this assessment aimed to systematically differentiate green jobs from not-green jobs and to count green jobs. The objective was to ensure that the boundaries of the domain of the intended application of the concept of green jobs coincided as closely as possible with the boundaries of the achieved or realized application. Accordingly, green jobs were found to pervade all sectors of the U.S. economy, and there are approximately 2.7 million of them. Moreover, green jobs were found to be disproportionally intensive in manufacturing and export industries and to offer better job opportunities overall than does the national economy as a whole.
RPS supporters variously cite anecdotal and empirical evidence that renewable energy investments and policies create jobs (Barkenbus, Menard, English, & Jensen, 2006; Deyette & Clemmer, 2005; Geller, DeCicco, & Laitner, 1992; Langniss & Wiser, 2003; Menz & Vachon, 2006). They point to research that has found a positive overall relationship between the presence of RPS and the range of components of energy-based economic development, including renewable energy–induced green jobs (Barkenbus et al., 2006; Bezdek, Wendling, & DiPerna, 2008; Deyette & Clemmer, 2005; Laitner & McKinney, 2008). Wei et al. (2010), for instance, found that when industries in the primary renewable energy sectors of the economy are supported by RPS or other state-level renewable energy policy, these sectors tend to generate more jobs on a per unit of energy delivered basis than do primary energy industries in fossil fuel-based sectors. Supporters of RPS policies also variously claim that relative to other policy mechanisms for encouraging deployment of renewable energy technologies, RPS are advantageous in that they place the greatest reliance on market competition and give greater flexibility to market participants who are deciding how to meet the stipulated targets (Espey, 2001). Thus, RPS policies have become increasingly popular drivers of renewable energy capacity throughout a wide range of the world’s industrialized countries (Wiser et al., 2007).
Detractors of RPS, on the other hand, variously argue that RPS policies have selectively provided support for some renewable energy technologies (e.g., solar) while providing inadequate support for others and that other types of policies might bring equal or greater benefits at lower costs (Wiser, Barbose, & Holt, 2011). They also point to the persistence of unclear policy objectives and incorrect economic reasoning (Radar & Norgaard, 1996), as well as research that has found a negative relationship between the presence of RPS and the attainment of these policy goals. Frondel, Ritter, Schmidt, and Vance (2010), for instance, argued that Germany’s RPS imposed unnecessarily high costs on industry without delivering on promises for positive impacts in terms of emissions, employment, energy security, or innovation. Detractors make variously clear and well-reasoned arguments that the presence of RPS in a state increases electricity prices, contributes little or nothing to energy security (Simmons, 2010), or destroys more jobs than it creates (Lesser, 2009, 2010). Detractors also point to uncertainty about the continued willingness of policy makers to sustain support and enforce the long-term contracts needed by renewable energy generators seeking to establish themselves in energy markets.
One of the pivotal questions in the controversies is whether or not in point of empirical fact the presence of RPS contributes significantly to green business and job creation in a state. The results of past empirical assessments of the relationship between RPS policies and measurable outcomes associated with the relevant policy goals to date are mixed and inconclusive (Wiser et al., 2007; Wiser et al., 2011). Carley (2009), for instance, found that RPS policies are not significant predictors of the percentage of the total amount of electricity generated by renewable energy technologies in states, but that the presence of RPS does nevertheless predict increases in the total amount of renewable energy generation. Similarly, Shrimali and Kniefel (2011) found that the presence of RPS is always a significant factor in predicting penetration rates of various renewable electricity sources in states but that the size and direction of the impact varies from technology to technology, even when economic and structural variables (e.g., share of coal-generated electricity in the state) are held constant. Fischer and Preonas (2010) demonstrate that the presence of RPS may under certain conditions interact and work at cross purposes with other policy mechanisms designed for the support of renewable energy technologies. Although some of the factors that determine the success of RPS at achieving the relevant policy goals are beginning to emerge in the quickly growing literature on the topic, considerable uncertainty remains as to the sizes of the effect, as well as to the direction of the relationships involved.
In this research, we focus on the green business and job effects of RPS. We adopt the aforementioned BLS operational definition. Our research question is, “For any two states starting from the same position in terms of their overall economic growth, does the state with RPS experience higher levels of green businesses and job growth?” In other words, does the evidence indicate that once economic growth variables such as tax burden, size of private financial markets, rates of business failure, industry structure, and investments in capital and knowledge are controlled, the implementation of RPS tends to be followed by a significant increase in green businesses and jobs? Given the rate of diffusion of these policies and the rationales presented for them in the literature, our hypothesis is that we will find a direct, statistically significant, and ostensibly causal relationship between the presence of RPS in a state and the number of green businesses and jobs in that state.
Research has clearly established that consideration of the whole of the natural, social, and policy context in which RPS are adopted is necessary for purposes of successfully gauging their true influence (Delmas & Montes-Sancho, 2011; Menz, 2005; Menz & Vachon, 2006; Vachon & Menz, 2006). Thus, a key point to bear in mind is that our interest is in the marginal contribution of RPS once all other relevant factors likely to influence state-level green business and job growth have been held constant.
In the next section, we first describe our method, including our analytical framework and data. Then we present our results, a discussion, and finally our conclusions.
Method
Our primary objective was to determine whether, ceteris paribus, the presence of RPS in a state statistically predicts future growth of green firms and jobs in that state. Our approach was to stipulate and statistically control for a range of variables that have been shown empirically to contribute to state-level economic development and, having done so, to add RPS variables indicative of the year each state adopted its RPS, as well as its stringency.
Our general modeling framework followed Temple (2006), according to which partial adjustment to a long-run equilibrium is combined with a specific model for that equilibrium. Specifically, we assumed that if RPS have any effect on the green economy in a state, the effect occurs after a dynamic period of social and economic adjustment processes that begin when RPS are enacted.
The RPS causal process, in terms of which we built our models, goes something like this. Soon after enactment of RPS, a state’s industrial and other leadership begins to more fully understand the implications of the newly established legislation. This, in turn, soon catalyzes early planning formulation. This is followed by the initial stages of action in which business plans are formulated and locations are selected for whatever industrial activities are decided on. At first relatively few jobs are created. These stages are followed by early-stage plan implementation during which capital is assembled, organizations and supply chains are developed, industrial plant is built, and an initial workforce is hired. During the early implementation stages more jobs are created, but it is not until sometime later that full blown industrial operations actually begin. Only once such operations begin do the full economic impacts of the RPS become discernible. The upper limit of new businesses and jobs directly attributable to the RPS is approximated only once the complete industrial responses to the enacted law have become fully operational.
Model Specification
Our model followed the general outlines of regional economic growth theory (Solow, 1956). The overall conceptual model is shown in Figure 1. Accordingly, green businesses and job growth are determined by five broad categories of variables: economic development, public finance, knowledge stock, RPS, and other policies. This is consistent with past research on state economic growth (Bauer, Schweitzer, & Shane, 2006; Hanushek & Kimko, 2000; Mankiw, Romer, & Weil, 1992). Because we theorized that the variables in all five of these categories could potentially influence green business and job growth, we statistically tested and controlled for them. The design was conceived to avoid confounding the green businesses and jobs attributable directly to RPS with the effects of the variables in these other categories.

Determinants of state-level green business and employment growth.
The functional form of the model was based on the assumption that dynamism exists in the economic and social processes through which increases in the various factors of labor, capital, and technological knowledge, together with energy policy variables, influence the creation of green employment and green jobs. To capture this dynamism, we stipulated and tested a cross-sectional time series model with lagged dependent variables. Our models took the following general form:

where y is the number of green businesses or green jobs per capita in a state, β is a vector of parameters representing the initial reaction of y(t) in time period t,
If having specified and fit this model, the RPS variable remains a positive and significant predictor of green economic development, then we can with some assurance infer that the presence of RPS leads to green economic development in a state. Only if the βs corresponding with the RPS variables are positive and statistically significant is the hypothesis confirmed that RPS are causally associated with the growth of green businesses and jobs in the states. Otherwise, if having statistically controlled these other sets of economic growth variables the presence of RPS does not predict increases in green businesses and jobs; the evidence is equivocal and the policy implications are inconclusive. Such a result would tend to undermine the conventional wisdom advocated by RPS proponents and bolster the objections raised by the opponents.
Data
Dependent Variable
Our state green businesses and jobs data were taken from the “Green Goods and Services” (GGS) category as defined by the U.S. Bureau of Labor Statistics (Federal Register, 2010). We used data measured at the six-digit NAICS code level from the 2012 County Business Patterns database. We included data from 2001 to 2009 for all private-sector sector firms and jobs listed in the 50 states. 2 Our operationalization of green businesses and jobs included those found within three categories of GGS industries: (a) energy from renewable sources, (b) energy efficiency, and (c) pollution reduction and removal, greenhouse gas reduction, and recycling and reuse. The businesses and jobs found in the combination of these categories contain those specifically related to energy from renewable sources, renewable energy, and energy efficiency.
Independent Variables
Renewable portfolio standards
Our RPS variables included four attributes. The first was RPS presence. We measured RPS presence using a dummy variable equal to one if a state had RPS policy in force in a given year, and equal to zero otherwise. The corresponding hypothesis is focused on whether the presence of RPS in any given year and state is related to greater numbers of green businesses or jobs in that year and state.
Second was RPS duration, which we measured using the difference between year of adoption and the current year. Longer duration was indicative of more time for the industrial planning and implementation process to influence green business and job growth. Thus, we hypothesized that RPS duration would have a significant positive relationship with green businesses and job growth.
The third was RPS stringency. We measured this in terms of the state-specific mandate for share of total electricity sales stipulated in the respective state standards. These requirements or goals were based on the “yearly fractional goals of RPS” data reported by the Database of State Incentives for Renewables and Efficiency (DSIRE) and augmented as necessary by data from the Union of Concerned Scientists (2008) 3 and review of each RPS law. We expected that, all else equal, states with more stringent RPS would have more green business and job growth.
Finally, we calculated increments to RPS stringency using a modified version of the method stipulated by Yin and Powers (2010). Specifically, this measure reflected the difference between each state’s RPS goal or requirement in a given year and the RPS compliance capacity of the starting year in that state. The variable was included to control for the fact that RPS stringency ratchets up differentially over time from one state to the next. The RPS compliance capacity of the starting year in a state was calculated by dividing RPS obligation in the first compliance year (MWh) by total sales of electricity in the first compliance year (MWh). We used DSIRE’s data for RPS obligation. Data on the date the RPS were adopted came from the National Renewable Energy Laboratory (Bird & Lokey, 2007) and the Database of State Incentives for Renewables and Efficiency. 4
Economic development
We hypothesized that a range of state economic development variables influence state green business and job growth. First, we expected, all else equal, to find more green business and job growth in cross sections characterized by greater total gross state product. There is every reason to believe that states with otherwise vibrant economies would have more green businesses and jobs independently of whether or not they have enacted RPS.
Second are private financial markets or the size of the private capital stock in a state (Abrams, Clarke, & Settle, 1999). Venture capital funds, for instance, are established for purposes of fueling economic growth and creating jobs, usually in various categories of science, technology, and engineering firms. We therefore included a variable reflecting the amount of venture capital available in each state and each year. The data came from the PricewaterhouseCoopers’ Moneytree Survey Data. 5 In terms of private capital stock, we expected that, all else equal, cross sections with a larger private capital stock would experience greater green business and job growth. Following Bauer et al. (2006), we measured private capital stock within a cross-section by the amount of bank deposits. Bank deposit data by state are available from the Federal Deposit Insurance Corporation (FDIC).
Third, a state’s economic growth is also influenced by its economic dynamism (Montgomery & Washer, 1988). One indicator of this is its business failure rate (Bauer et al., 2006). We anticipated that, all else equal, as more conventional businesses went under, greater numbers of entrepreneurs and employees were likely to be attracted to new and ascendant green economic opportunities. Thus, we expected states with higher business failure rates to enjoy higher levels of green business and job growth. We measured business failure rate by total number of bankruptcy filings in a year divided by the total number of establishments in the state that year. Our bankruptcy data were derived from the Federal Court, 6 and data on the number of establishments came from the County Business Patterns survey.
We also hypothesized that a state’s economic growth was influenced by its industrial structure and, specifically, the composition of its capital and human resource base (Bauer et al., 2006). Industrial structure was measured using the share of gross state product (GSP) for manufacturing, farming, and mining of total GSP in the private sector, respectively. We expected to find an inverse relationship between both manufacturing and mining and green business and job growth, and a direct relationship between farming and green business and job growth. GSP data by industries are available from the Bureau of Economic Analysis.
Public finance
A state’s tax rate is often thought to be related to its economic growth (Phillips & Goss, 1995). We therefore hypothesized that tax rate would be inversely related to green business and job growth. We represented state taxes using income tax rate, which we measured as the proportion of total tax revenue over the state’s personal income. Our data for states’ total internal revenue data were from the Internal Revenue Service 7 and states’ personal income data from the Bureau of Economic Analysis. 8
Governments’ expenditures on public infrastructure are often considered to affect economic growth (Aschauer, 1989; Wylie, 1996). We therefore hypothesized that, all else equal, greater levels of public infrastructure investment would tend to increase green business and job growth. Following Bauer et al. (2006), we used state’s highway spending as a proxy measure for public capital investment. Our data for this came from the State Government Finance survey, which provides expenditures on highways by state governments. 9
Knowledge stock
The endogenous economic growth models stipulate that the knowledge stock of a state is a major determinant of the state’s economic growth (Johansson, Karlsson, & Stough, 2001; Romer, 1986). We hypothesized that a greater knowledge stock in a state would be positively related to the growth of green jobs and businesses. To measure the knowledge stock, we used two indicators of educational attainment. The first of these was the proportion of the population of those 25 years and older with at least a high school degree. The second was the proportion of those 25 years and older with at least a bachelor’s degree. Educational attainment data are available in the annual Current Population Survey.
Another knowledge stock variable that has been shown to influence economic growth is a state’s innovation ability (Bauer et al., 2006). Empirical evidence suggests that patent counts provide a fairly reliable measure of innovative activity (Acs, Anselin, & Varga, 2002). We used a state’s stock of patents as proxy measure of the ability to innovate new products and techniques. We specifically used the number of patents granted for invention by state 10 (i.e., utility patents). 11 Patents count data was collected from the Patent Technology Monitoring Team Report published by the U.S. Patent and Trademark Office (USPTO, 2011). 12 We expected, all else equal, that states with higher levels of innovation to have higher levels of green business and job growth.
Other policies
Besides mandating RPS, state governments have attempted to encourage renewable energy deployment in other ways, some of which may lead to green business and job growth. Some of the policies that have been used for this purpose include Net Metering, Interconnection, Public Benefit Funds, Access Laws, Mandatory Utility Green Power Options, and tax incentives and subsidies. We sought to isolate the impact of RPS on a state’s green industry by statistically controlling for other state policies designed to support or encourage green business and job growth.
One such set of policies are tax incentives for renewable energy development. To control for these, we created a tax incentive index 13 that included all forms of tax incentives for renewable energy development: personal, corporate, sales, and property taxes. These four taxes are weighted equally into the tax index that ranges from zero to four.
Another such set of policies are financial programs and subsidies. Rebates, grants, and loans are sometimes used to encourage the purchase and/or installation of renewable energy technologies, which in turn would be expected to increase the numbers of green businesses and firms. We thus created a subsidy index reflecting the presence of three categories of financial programs designed for this purpose. The index reflects the presence of each category of program in a state in a given year, ranging from zero to three. Historical data indicative of the presence of states’ financial incentives, taxes, and subsidies for renewable energy development were provided by DSIRE.
A listing of all of the independent variables along with the data sources may be found in Table 1.
Conceptual Definition and Source of Independent Variables.
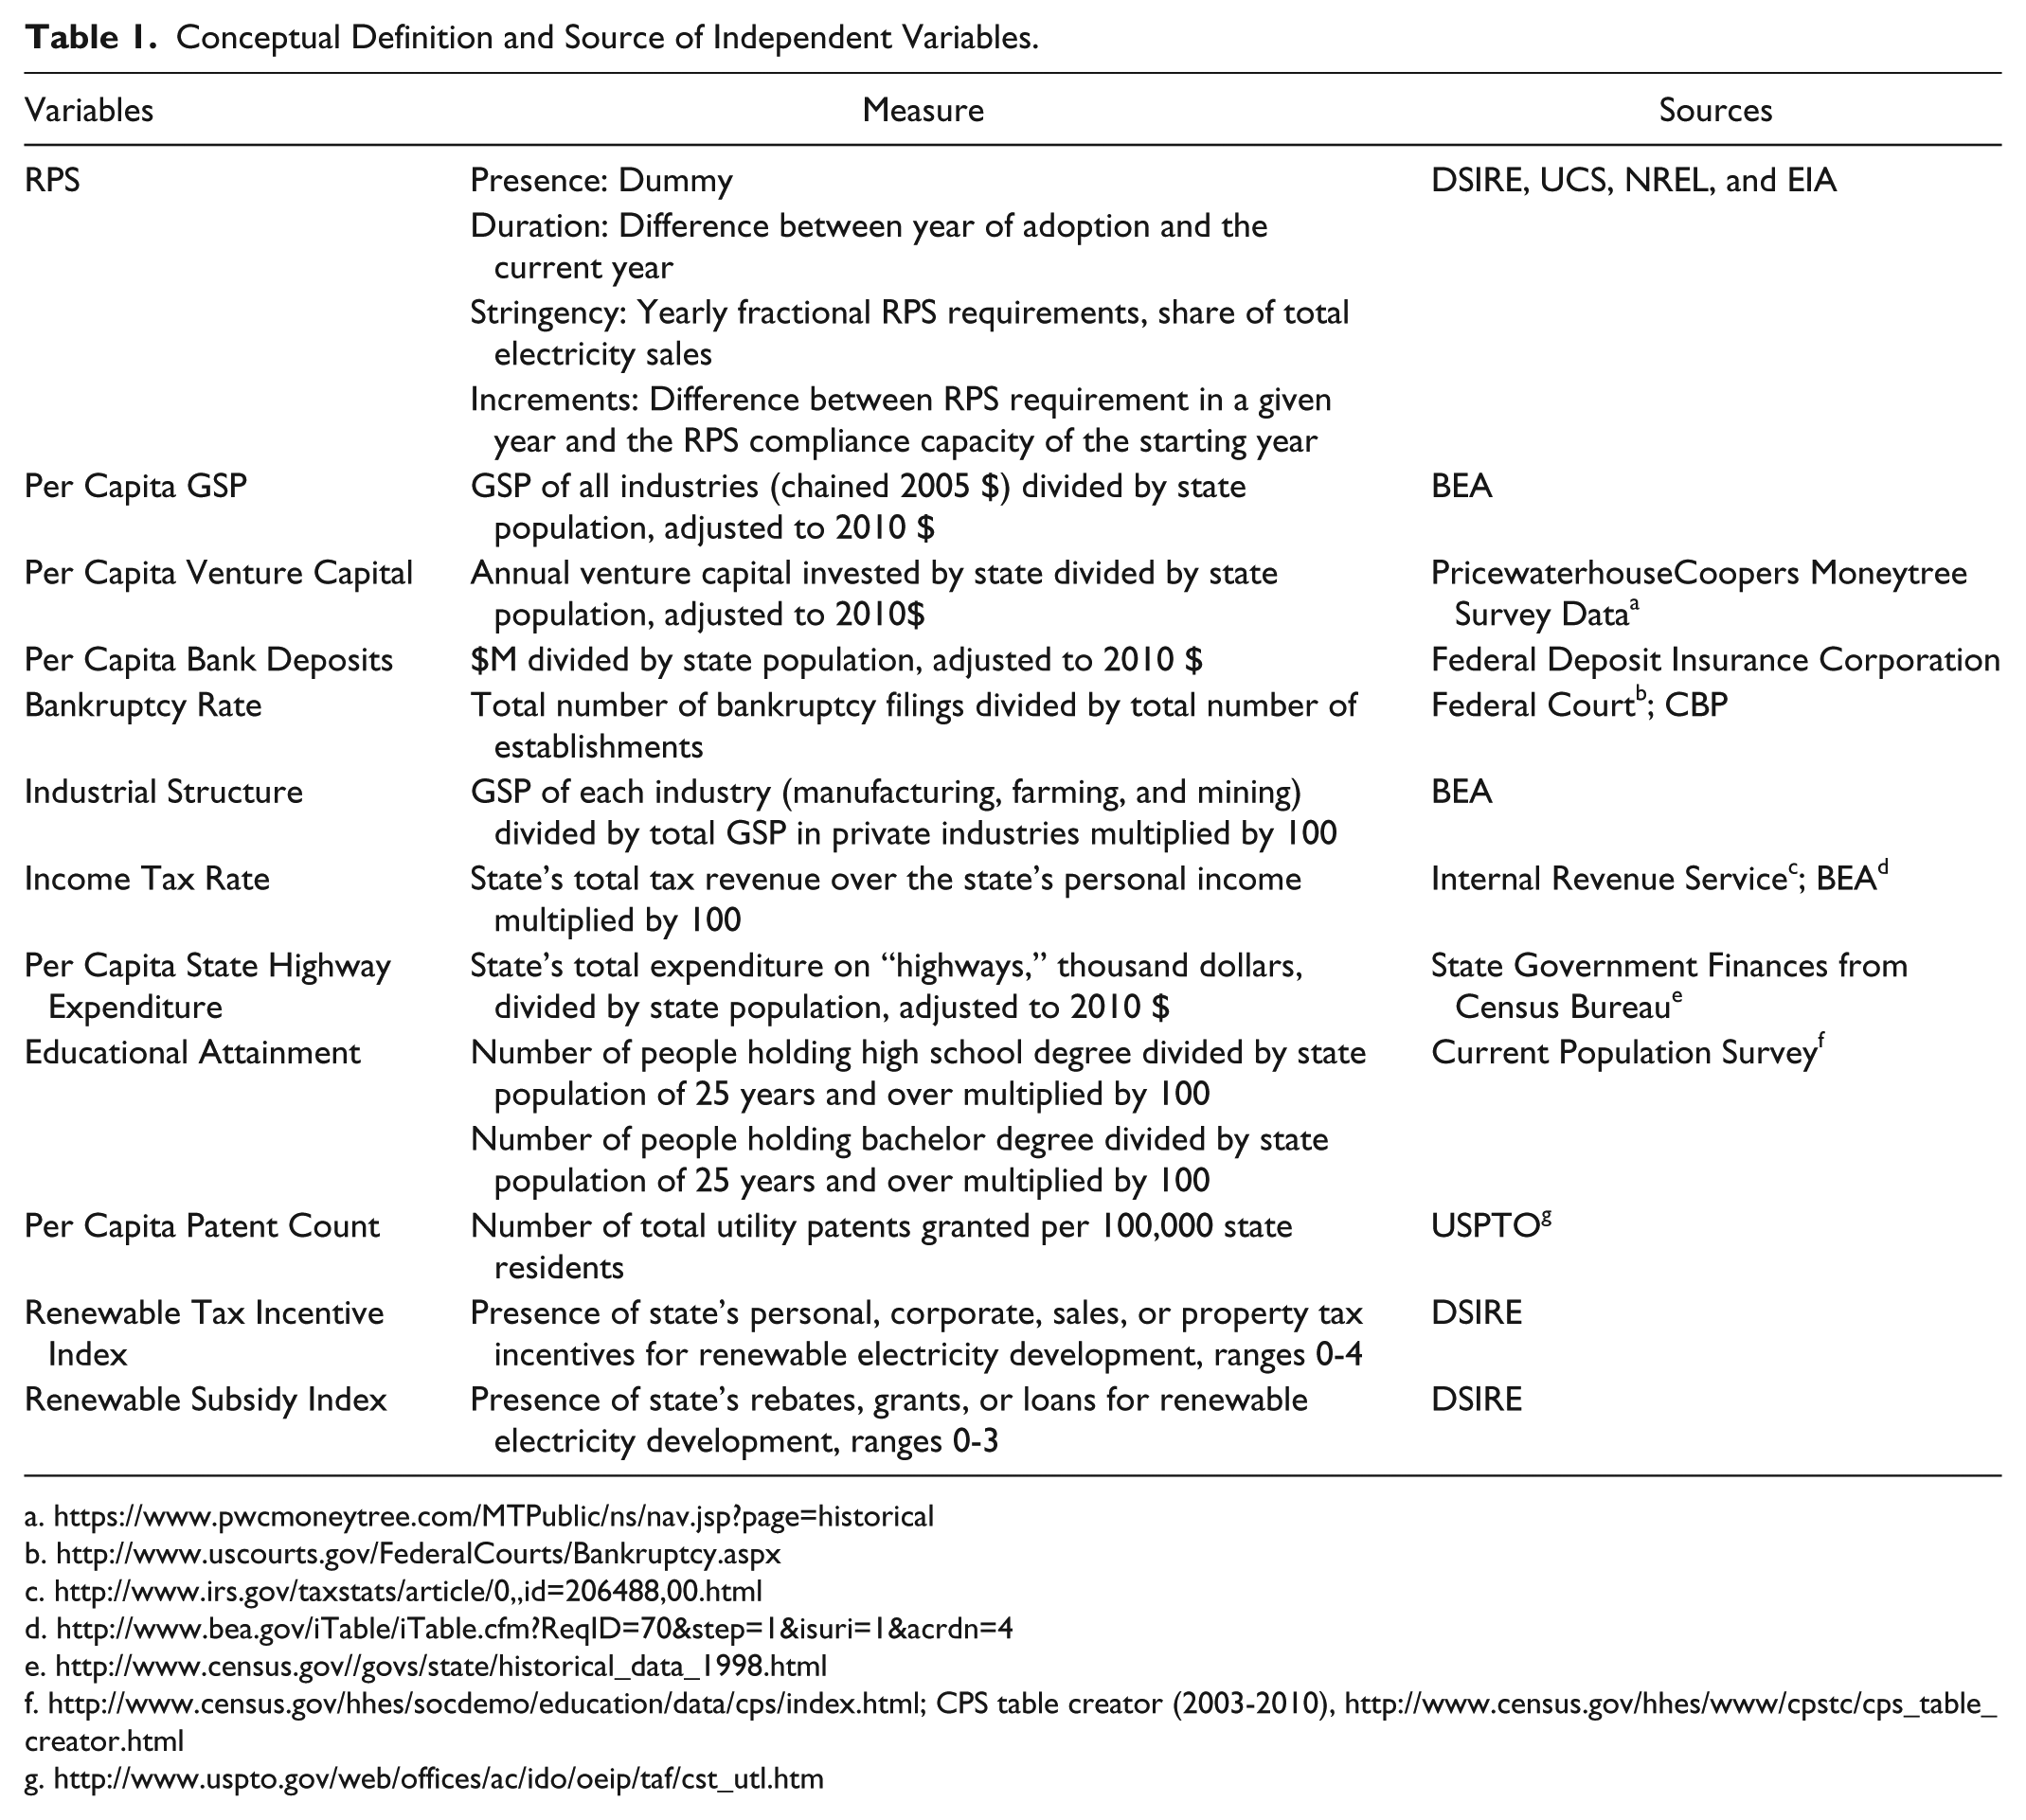
http://www.census.gov/hhes/socdemo/education/data/cps/index.html; CPS table creator (2003-2010), http://www.census.gov/hhes/www/cpstc/cps_table_creator.html
Our models were estimated using the panel procedure in SAS with fixed two-way estimates. Each model was estimated on the basis of 50 cross-sections, one cross-section for each state, and using a time series length of 7 years.
Results
Descriptive Statistics
The overall mean annual rates of green business and job growth across the 50 states from 2001 through 2009 were 17% and 35%, respectively.
Table 2 gives descriptive statistics for all variables used in the analysis.
Descriptive Statistics (N = 350).
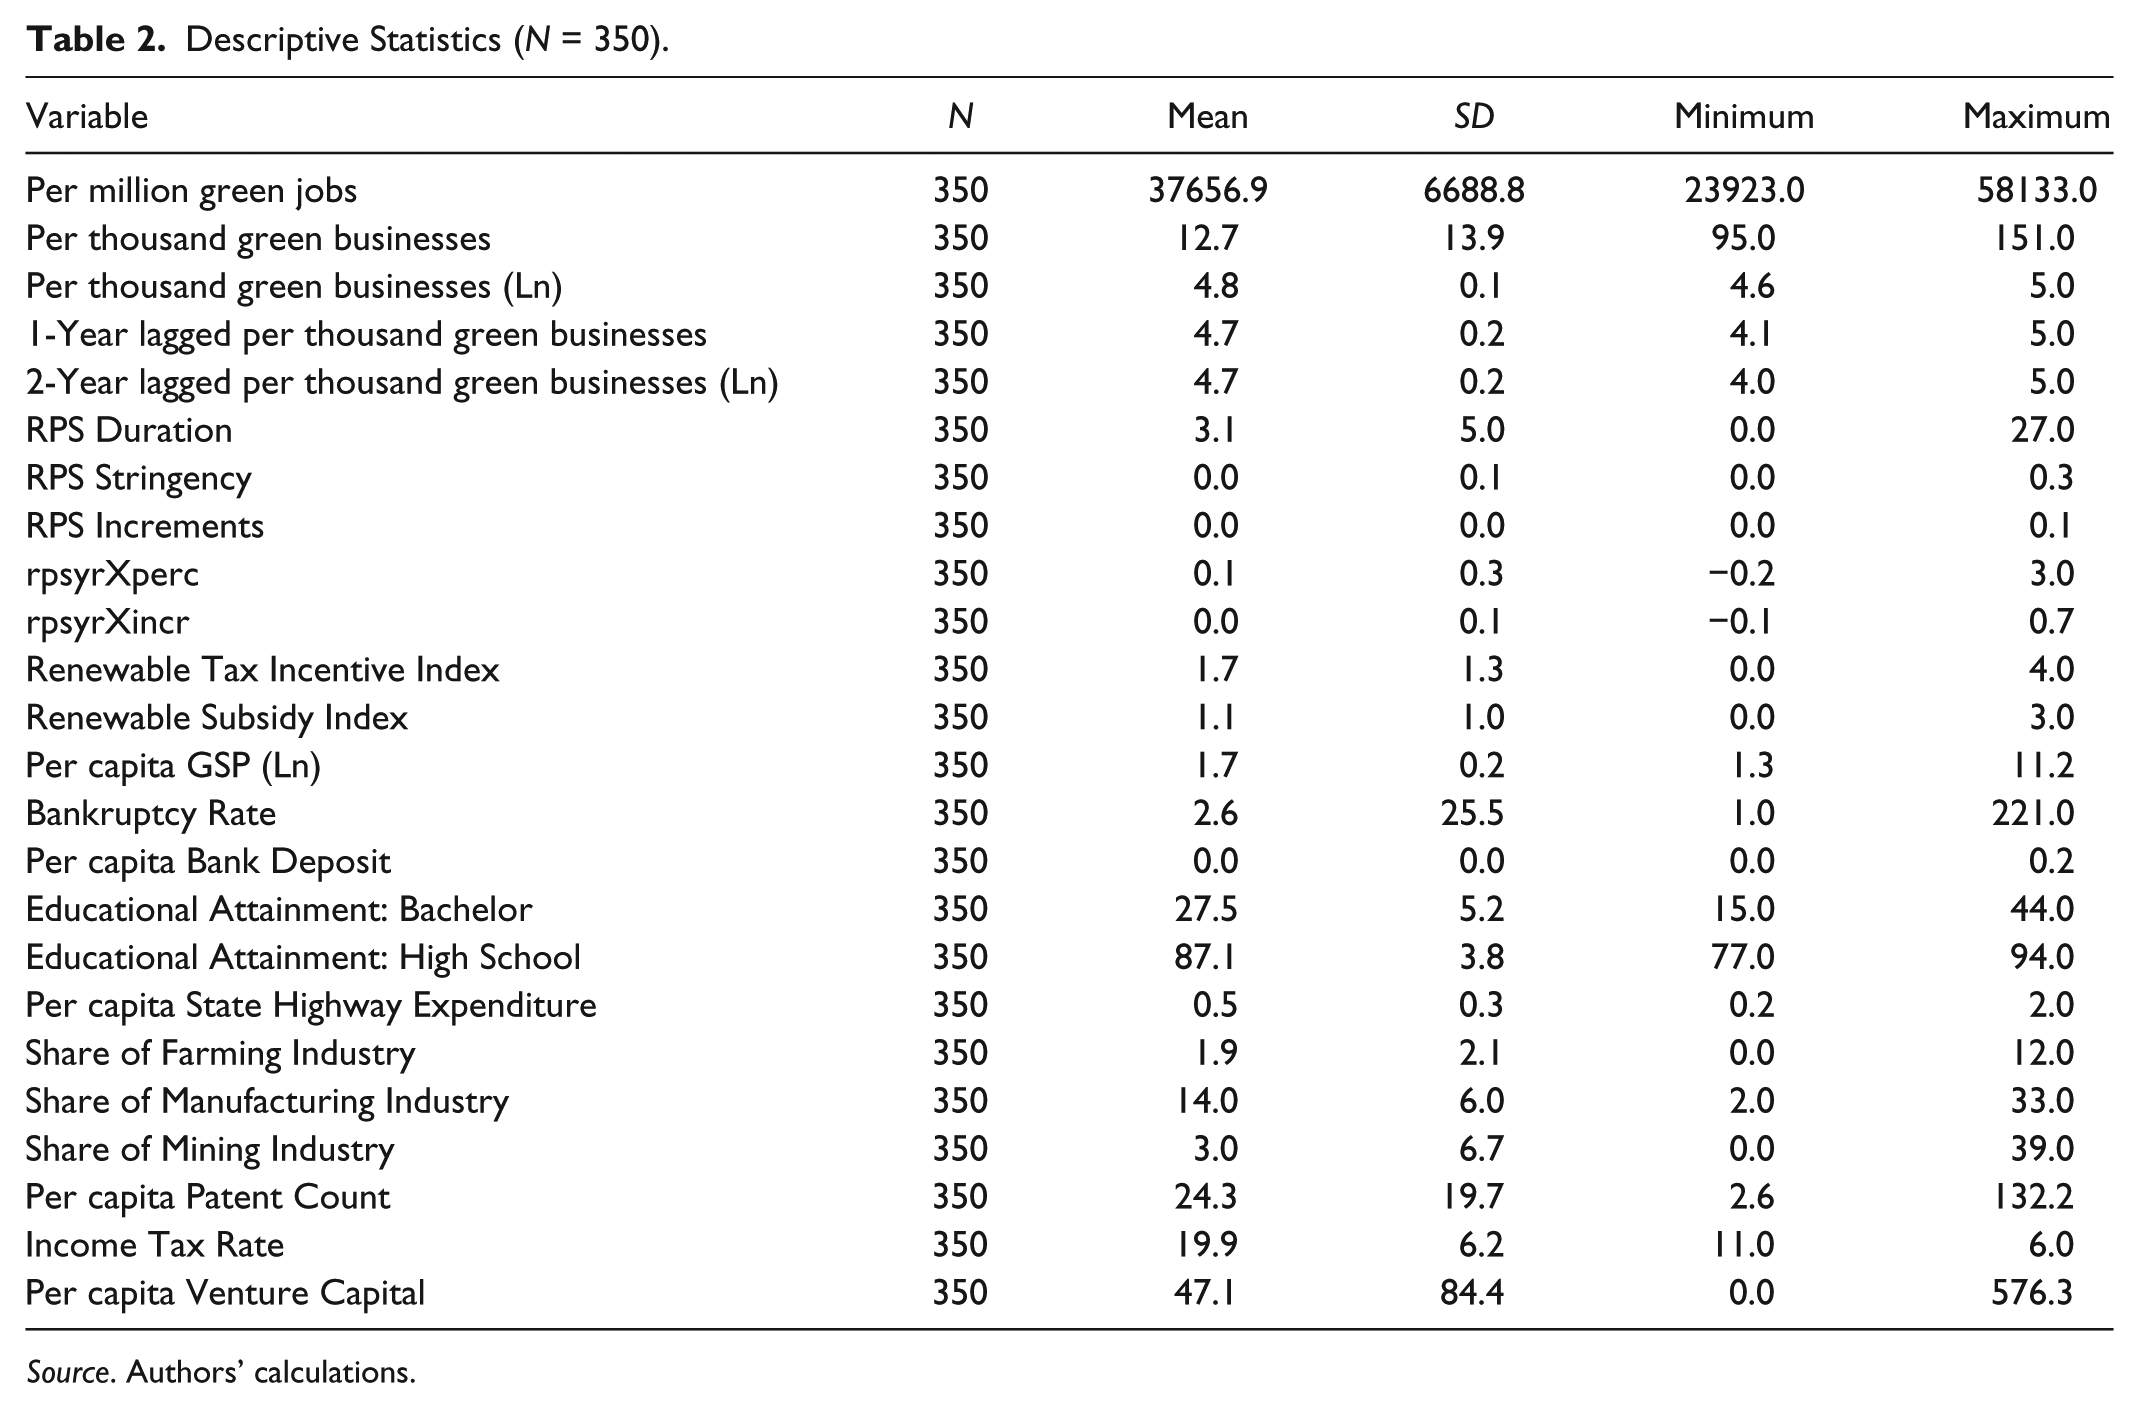
Source. Authors’ calculations.
Table 3 indicates the number of states having adopted RPS by year.
Presence of RPS Adoption on Year Adopted/Enacted.
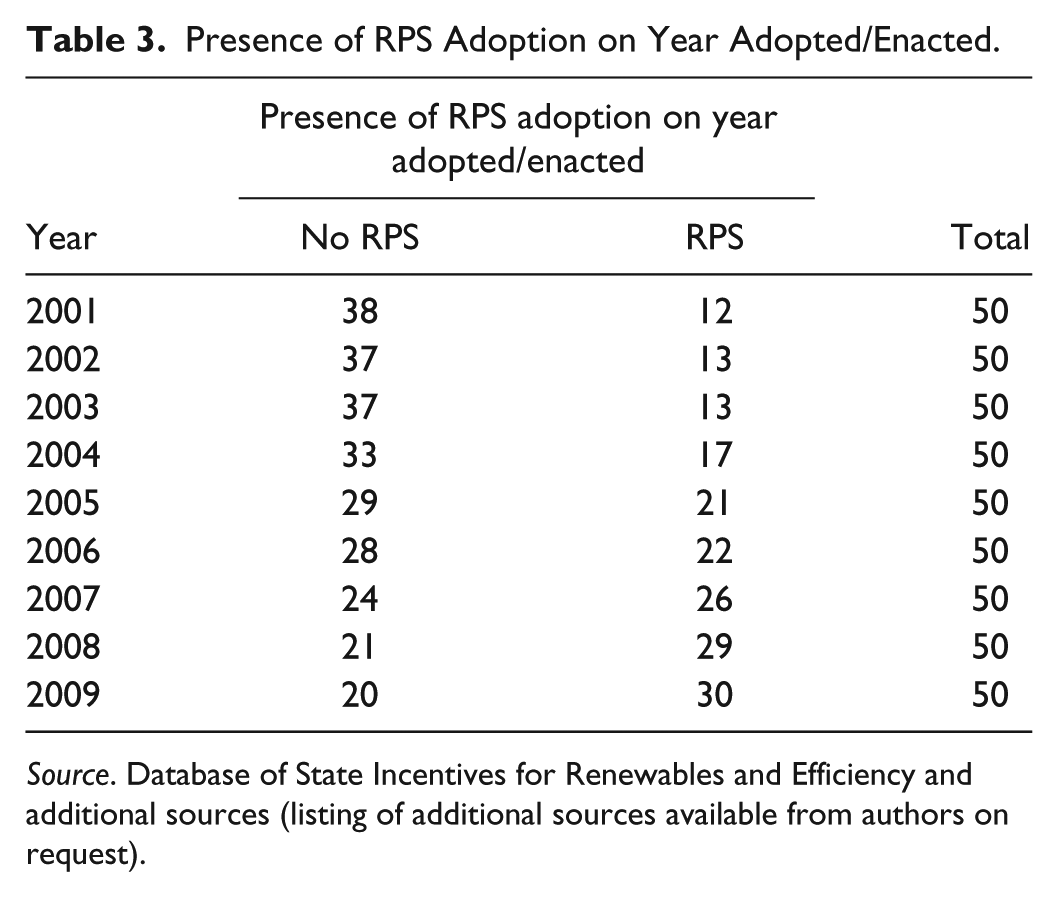
Source. Database of State Incentives for Renewables and Efficiency and additional sources (listing of additional sources available from authors on request).
Figure 2 graphically depicts the states with RPS with reference to the year of initial compliance.
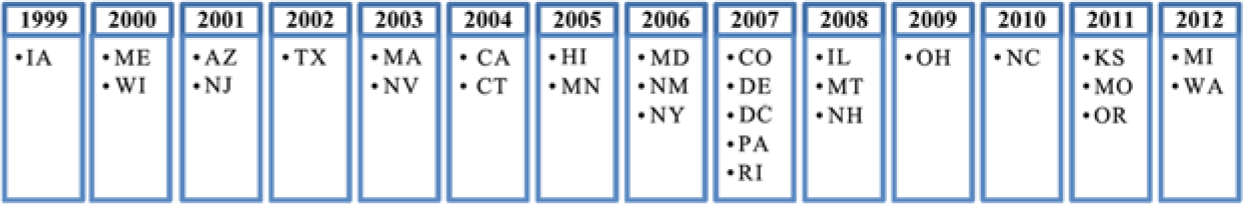
Initial compliance year for state RPS policies.
Inferential Statistics
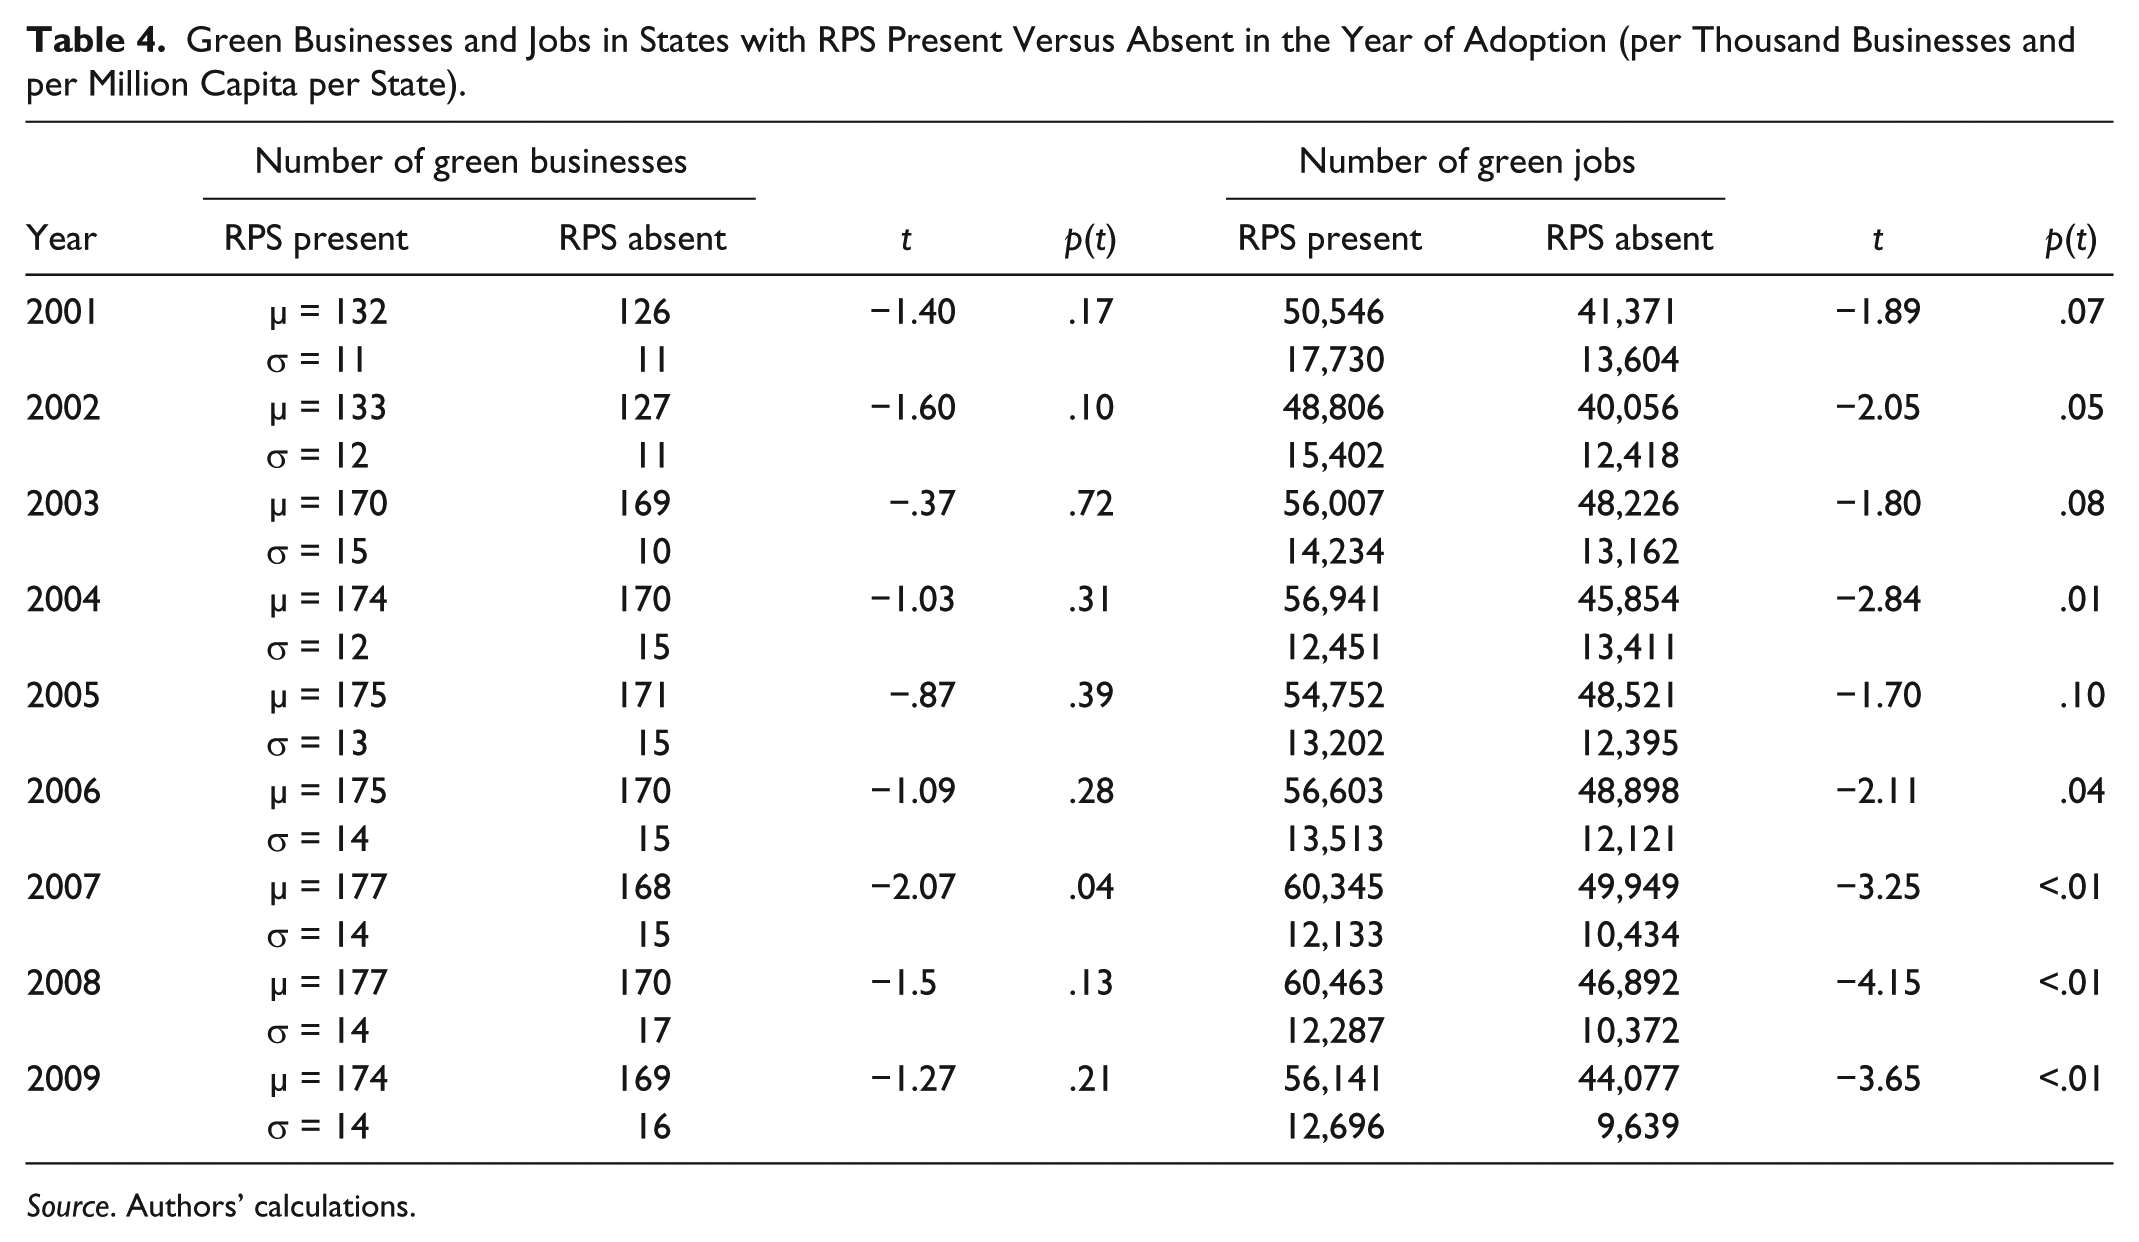
Table 4 presents comparisons of mean numbers of green businesses and jobs in states with RPS to those in states without RPS in the year of initial adoption. With the notable exception of 2007, there is no evident tendency for RPS legislation to pass in states in which the numbers of green businesses were significantly greater in the year of initial compliance. In contrast, there is a strong tendency for RPS legislation to pass in states in which the numbers of green jobs were significantly greater in the year of initial compliance.
Green Businesses and Jobs in States with RPS Present Versus Absent in the Year of Adoption (per Thousand Businesses and per Million Capita per State).
Source. Authors’ calculations.
Table 5 presents the multivariate results for green businesses. 14 Accordingly, the presence of RPS is not directly related in a statistical fashion to green business growth and therefore cannot be a cause of green business growth (p = .939). But the duration of time since RPS were enacted is a statistically significant predictor of the numbers of green businesses in a state (p = .042). Specifically, for states with the average RPS percent and increment, each additional year that an RPS policy has been in place is associated with a 0.2 increase in the number of green businesses per 1,000 businesses. For example, the estimates imply that a state with the average RPS percent and increment and that has had RPS for 5 years would have 1% more green businesses per 1,000 businesses than a state that has never had RPS. This is consistent with the RPS causal process we described earlier.
Model of Green Businesses per Thousand Businesses in State.
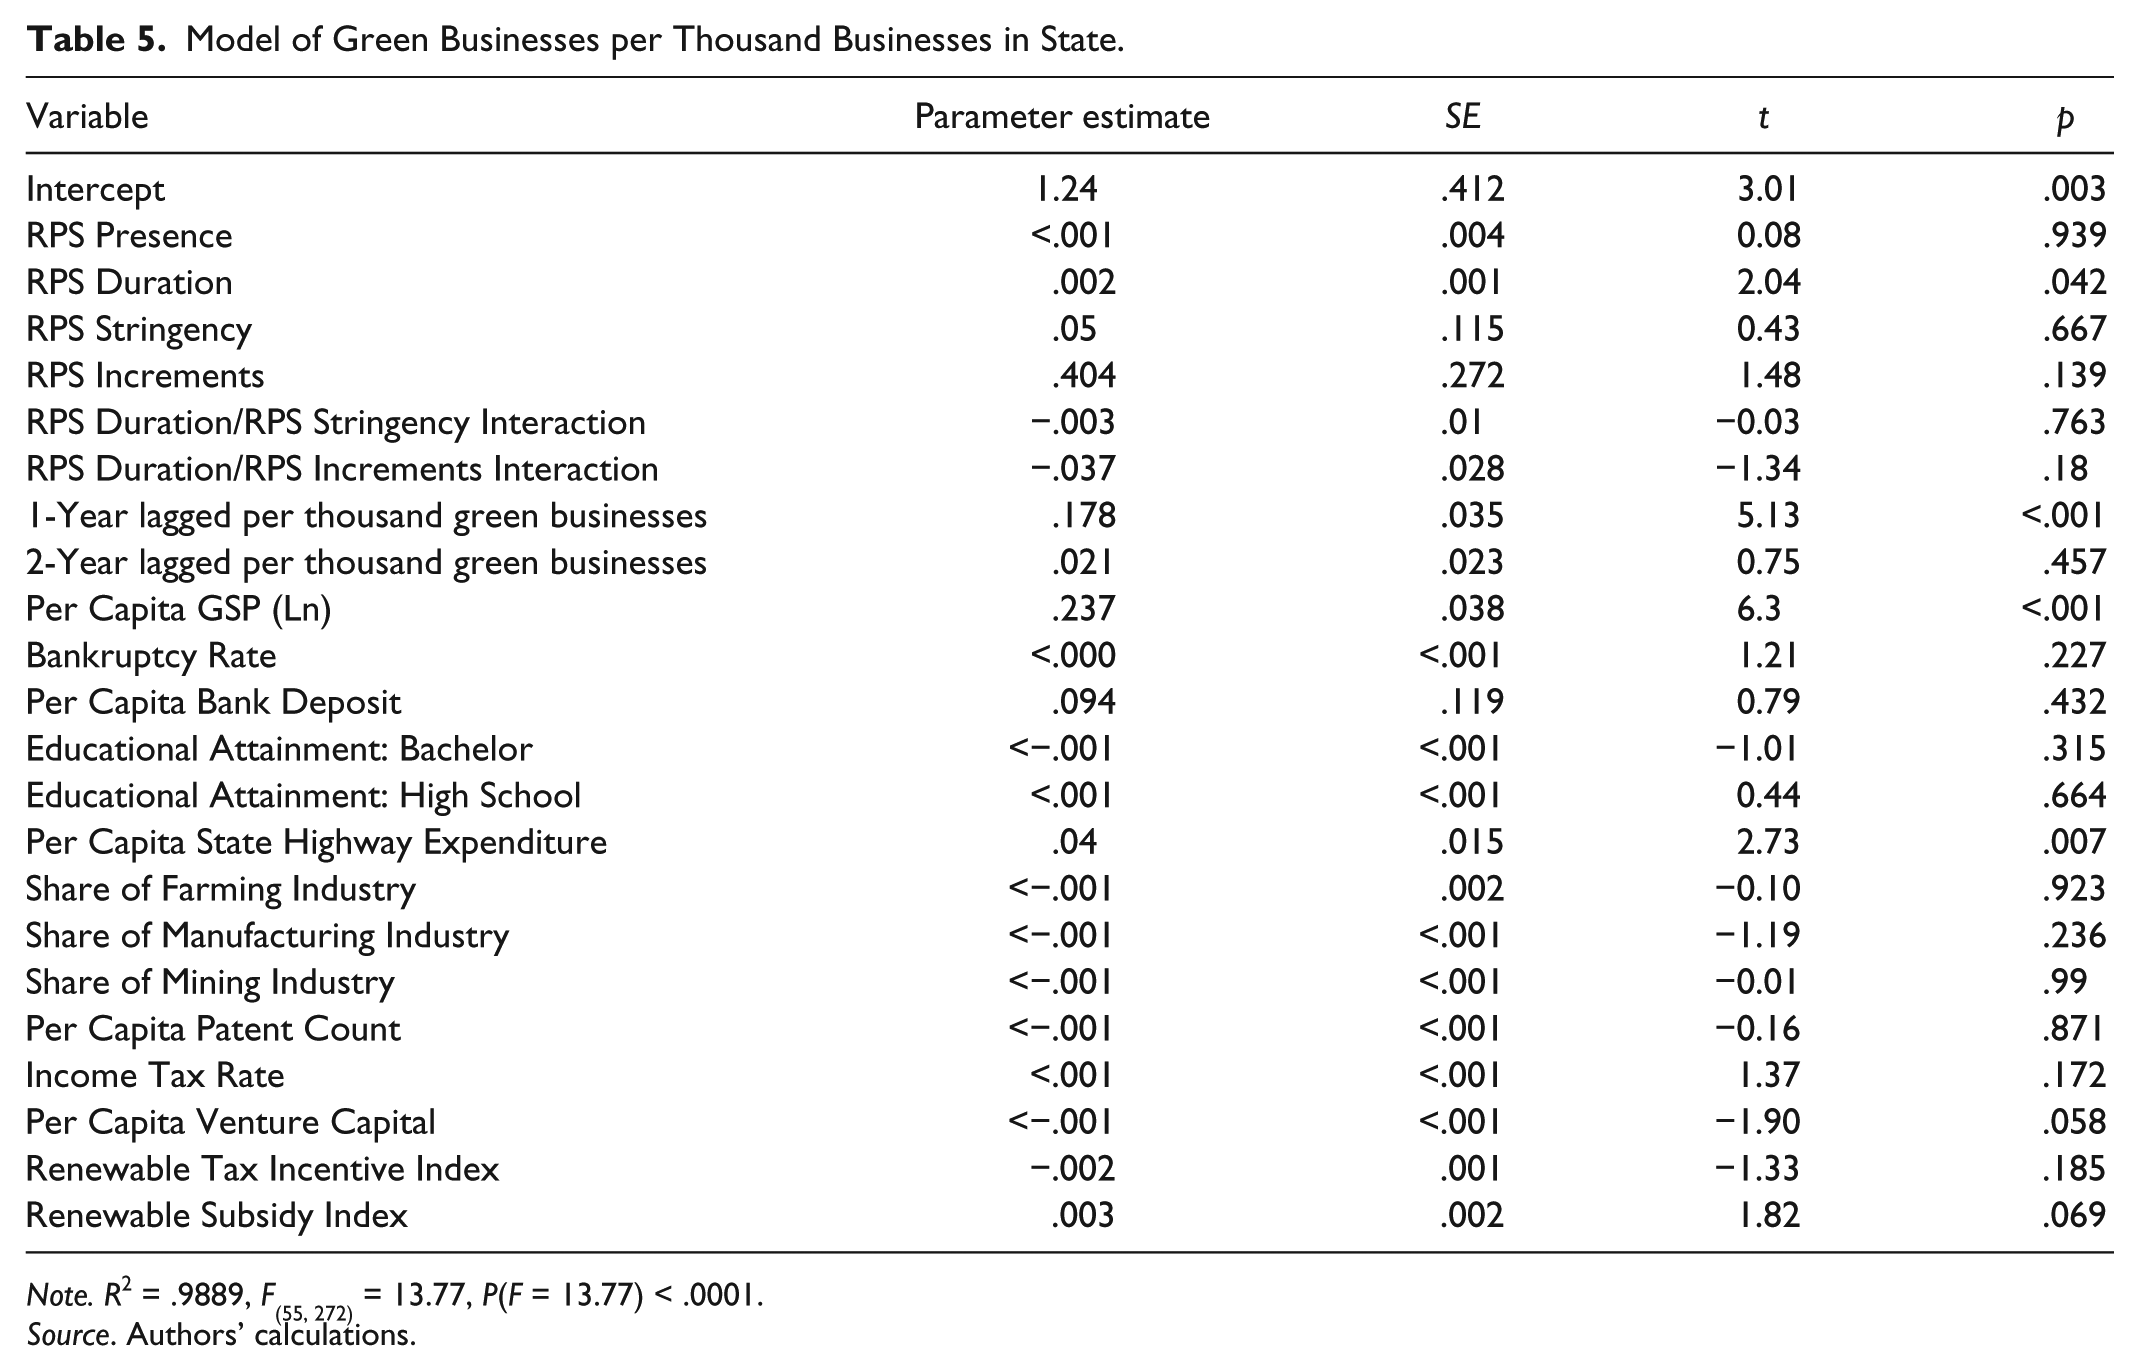
Note. R2 = .9889, F(55, 272) = 13.77, P(F = 13.77) < .0001.
Source. Authors’ calculations.
The numbers of green businesses in states are also directly and significantly related to per capita gross state product (p < .001), state investment in public infrastructure (p = .007), and also less convincingly but nonetheless notably with state energy subsidies (p = .069). Contrary to our hypothesis, the numbers of green businesses are inversely related to the per capita levels of venture capital in a state (p = .058). The significance of the first lag suggests that green industries are in an agglomeration phase: Their growth is strongest where initial levels are the highest (p < .001). It is important that we control for this because there may be a link between size of industry and adoption. The residual plots contained no evidence of heteroskedasticity, influential outliers, or abnormally distributed errors.
Table 6 presents the multivariate results for green jobs. Neither the presence of RPS nor the duration of RPS in a state is a statistically significant predictor of the numbers of green jobs in that state. Rather, the numbers of green jobs are directly and significantly related to per capita gross state product (p < .001), bankruptcy rates (p = .009), investment in public infrastructure (p = .018), and per capita patents (p = .015). The numbers of green jobs are inversely and significantly related to manufacturing’s share of gross state product (p = .015) as well as to per capita venture capital (p = .025). Similarly as in the model of green businesses, the significance of the first lag suggests that the growth of green industries is strongest where initial levels are the highest. The statistical significance of the negative effect of the second lag indicates that states with slow green job growth from t − 2 to t − 1 are expected to have slower growth from t − 1 to t (p = .005). The residual plots contained no evidence of regression pathologies.
Model of Green Jobs per Million Population in State.
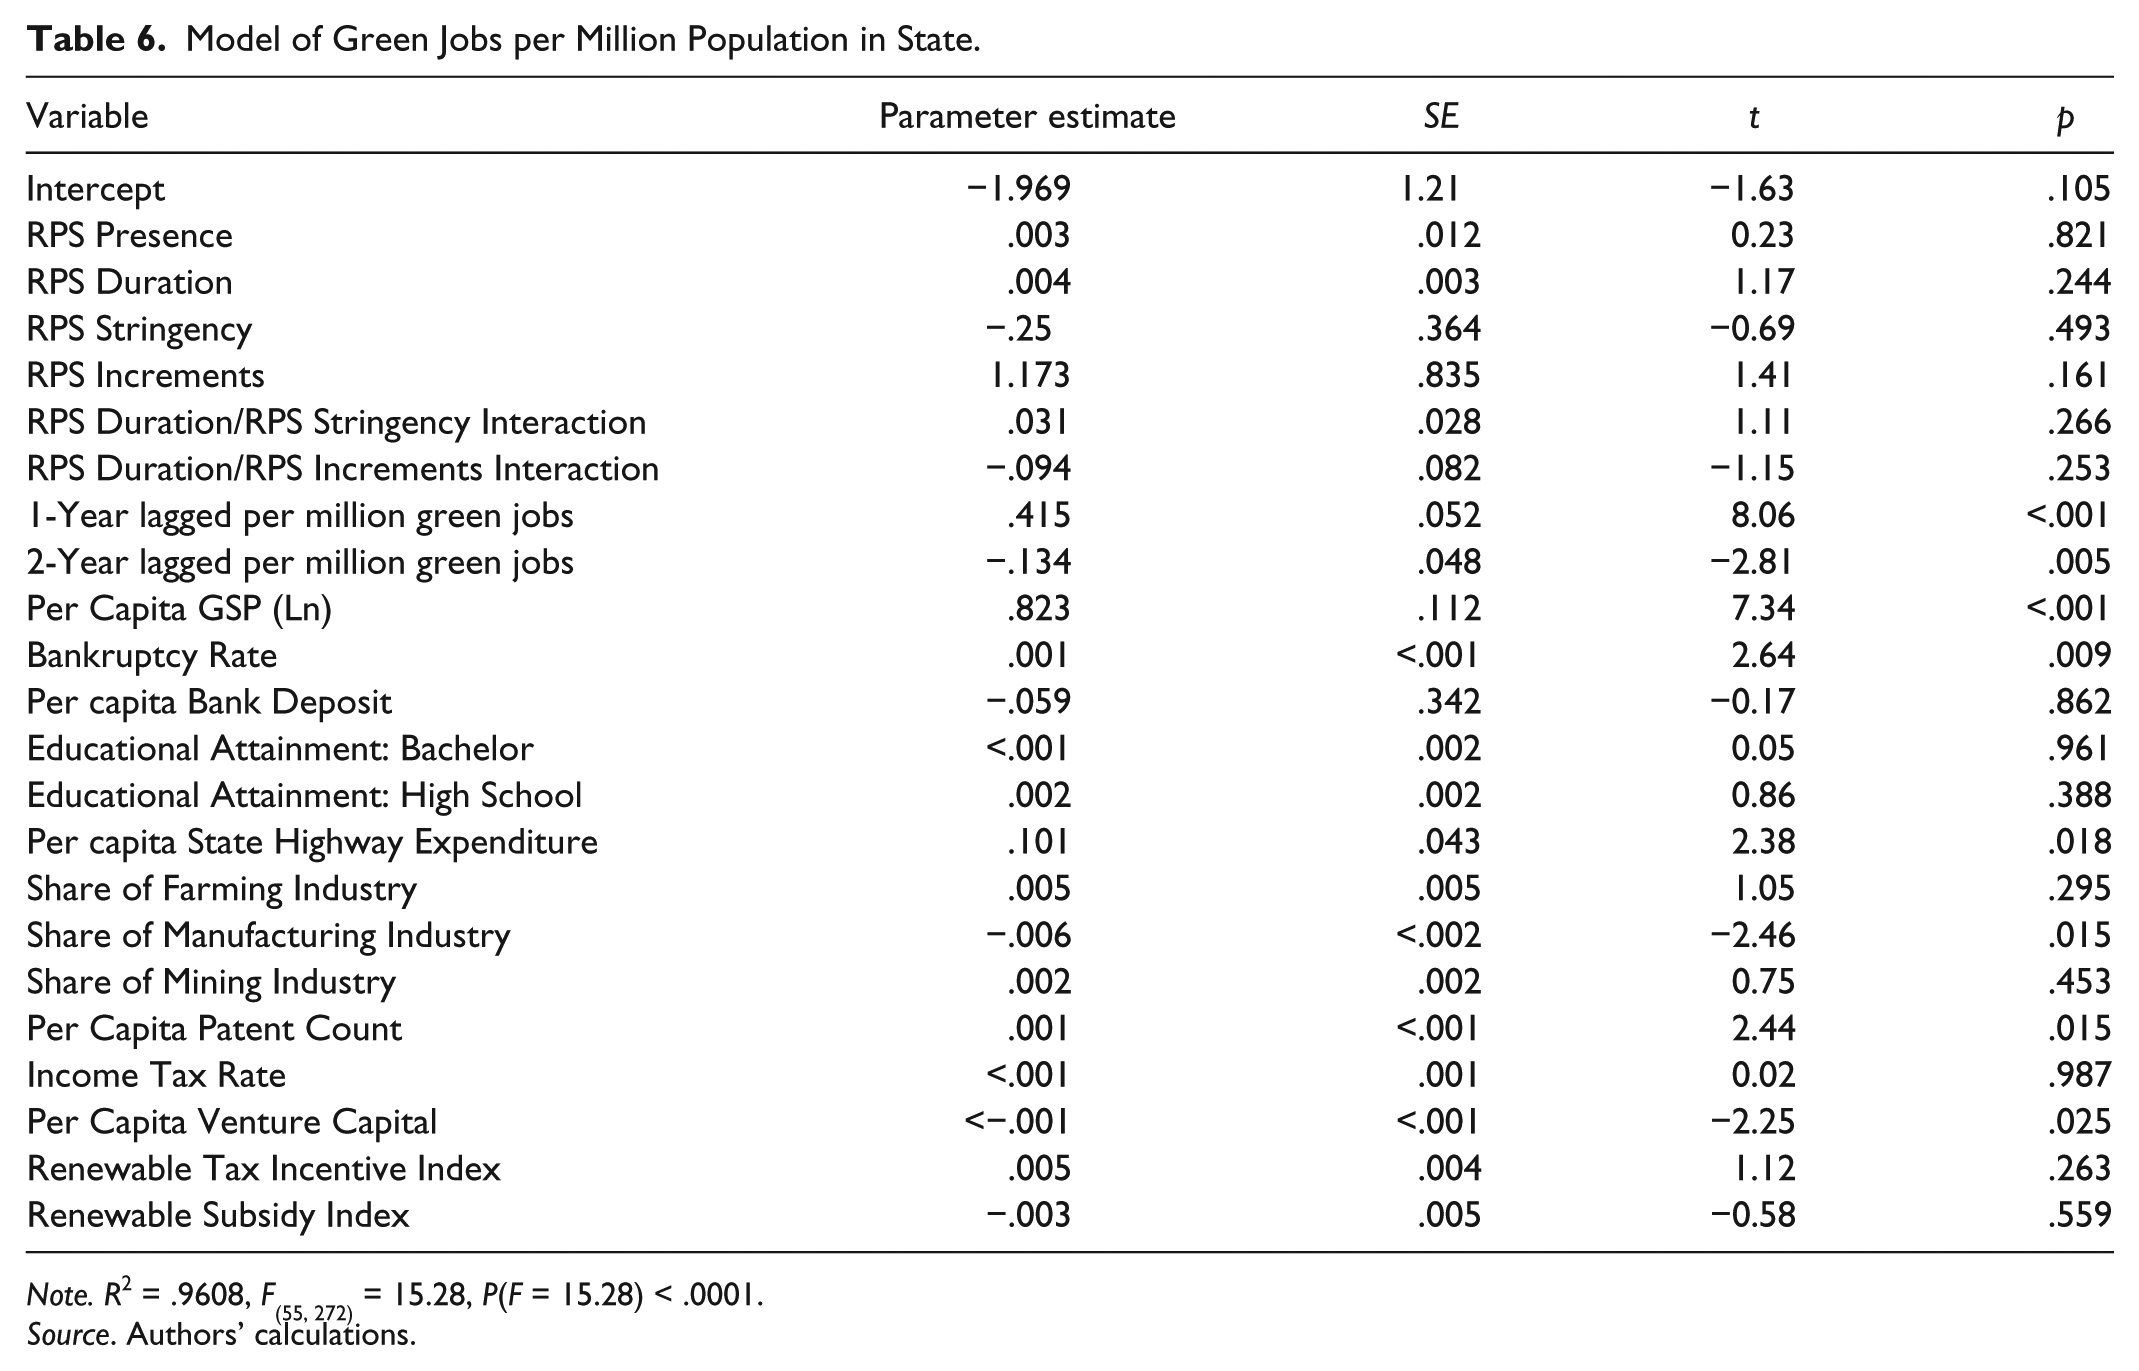
Note. R2 = .9608, F(55, 272) = 15.28, P(F = 15.28) < .0001.
Source. Authors’ calculations.
To determine whether any observed RPS duration effects are attributable to early adopters, which is to say adopters prior to the first year of our data set, we fit two additional (not reported) models (jobs and businesses) for two different samples. The first sample (“nothing before 2001”) excluded all states that had RPS before the study period. The second sample just excluded Iowa and Minnesota because they were especially early adopters. Although the coefficients on RPS and RPS year changed a little between models, the change was not enough to alter interpretation and conclusions. From this we concluded that the observed RPS-duration effects were not due to early adopters.
Discussion
Given the BLS definition of green industry we used in this research, there is no reasonable doubt that there was an overall increase in the number of green businesses and jobs in the United States between 2001 and 2009, whether measured in total numbers per state or measured in total numbers per capita. Moreover, the larger numbers of green jobs and businesses in states with RPS relative to those in states without RPS constitute prima facie empirical evidence consistent with the RPS proponents’ arguments that the presence of RPS in a state causes growth in its green industry. At the same time, however, the force of such arguments for policy rightly and critically hinges on whether or not states with relatively larger numbers of green jobs and businesses would have had such numbers even without RPS. In turn, this determination rests on use of appropriate research design and statistical modeling, informed by economic growth theory, so as to control for theoretically plausible alternative explanations for the larger numbers and to avoid biases attributable to omitted variables and other model specification errors.
Though the objective of this research was to use such a design to empirically estimate the effect of RPS policies on the green economies of states, RPS policies have not been around long enough to make definitive statements regarding their effects. As of this writing, only nine complete years of data are available and of those, many states have had their RPS in place for too short a time to be confident that RPS effects on the green economy are discernible. Definitive statements will have to wait until enough RPS have been around long enough for their influence on the green economy to stabilize. Meanwhile, the approach we have taken in this research is likely to yield the most definitive statements possible given the relatively short period of time since their initial inception.
This said, with respect to green businesses, the multivariate evidence reported herein does clearly indicate that the presence of RPS is not statistically and directly related to green business growth. This absence of relationship may be attributable to variation in RPS design features from state to state, to clusters of industries and associated local or substate regional variation in the green-business effects of RPS, or to other factors. Whatever the explanation, until the presence of RPS is shown to have a statistically significant relationship with an increase in green businesses, RPS cannot be considered to be a cause of green business growth.
At the same time, the statistically significant relationship between the duration of time since RPS were enacted and the number of green businesses in a state suggests the validity of the RPS causal process specifically in terms of which we built our models. In other words, while it is not consistent with logic and the evidence to consider the mere presence of RPS to be enough to cause growth in green businesses in a state, it is consistent to consider its persistence once enacted to be so. Once RPS policy has been enacted, states do well by their green economies to let them remain in force for extended periods of time. Discernible green business growth will evidently occur with some predictability once the industrial responses to the RPS have had enough time to take effect. That the relevant causal process stems from the changes in industry that occur with time in response to the RPS, rather than from its stringency, is evidenced by the fact that neither RPS stringency nor increments to RPS stringency were statistically significant in our models.
Another possible interpretation of the significance of the RPS duration variable in the green business model stems from recognition of the fact that implementation experience varies. This is illustrated in Figure 2. Some states have far more experience than others. The effect of variation in implementation experience on our models may be to increase variation in the effectiveness with which the RPS cause green economic development. Accordingly, once the RPS policies have been in effect for a longer period of time, the influence on the estimated parameters attributable to differences between states in terms of implementation experience may become relatively smaller. In turn, this would stabilize the effects of the RPS as reflected in the models, allowing more reliable estimates.
It comes as no surprise that the number of green businesses and jobs in states are directly related to per capita gross state product. States with higher per capita gross state product are likely to be more economically productive and prosperous, thus making green business and job creation more likely. Indeed, it stands to reason that any established statistical relationship between the attributes of RPS and any sort of state-level business or job growth that does not control for the magnitude of the overall state economy is likely to be spurious. Nor on the basis of economic growth theory is the result surprising that growth in green businesses is related to both state investments in public infrastructure and energy subsidies. Investment in public infrastructure is widely considered to be a way to increase the aggregate production function (Leven, 1985), thus indirectly stimulating all sorts of economic development including green businesses. The purpose of state-level energy subsidies is often to stimulate growth in green businesses.
Less intuitive is the significant inverse relationship between number of green businesses and jobs, on one hand, and per capita levels of venture capital, on the other hand. Recognizing that we measured venture capital in general—not venture capital specifically designed to spur green industry—this may be interpreted a couple of ways. First, if the available venture capital is more readily accessible to larger, established businesses relative to newer, smaller energy firms, one would expect to find this result. Certainly at least in some states there are abundant anecdotes available suggesting that the likes of major medical care and biotech firms have greater access to venture capital relative to smaller wind turbine and fuel cell production firms. Second, insofar as venture capital in a state does not so much spur new industry as develop in response to the presence of successful previously existing industry, this negative inverse relationship would again be the expected result. Finally, insofar as green industrial growth is linked to certain geo-morphological features such as deserts, plains, lakes, and rivers, and insofar as the states that have these features also have low venture capital levels, a negative relationship between green industry and venture capital could result.
The t tests in Table 4 can provide some insight into the causal relationship between RPS and growth in green businesses and jobs. Causes must come before effects in time. So increases in numbers of green businesses or jobs in a state can only be attributed causally to RPS if the RPS were enacted prior to the increases. In respect to green business growth, the numbers of green businesses were not significantly higher during the year of enactment in states where RPS are present, relative to states without RPS. Thus, on the face of things, the significant growth in green businesses attributable to the duration of RPS discerned in the regression model must follow enactment of RPS in time. Accordingly, the possibility of a causal link between RPS and growth in green businesses appears feasible. In contrast, there is a strong tendency for RPS legislation to pass in states in which the numbers of green jobs were already greater in the year of initial compliance. Moreover, the green jobs model revealed no statistically significant relationships between any of our measures of RPS and the number of green jobs in a state. Thus, evidently some part of the total green job growth in states either leads RPS adoption in time or else occurs contemporaneously with it. By implication, the evidence clearly counterindicates the possibility of a causal link between RPS and growth in green jobs.
One of the clear limitations of our analysis stems from the fact that we did not examine any RPS causal effects on any businesses or jobs other than those included in the three aforementioned categories of GGS industries as defined by the U.S. Bureau of Labor Statistics. We also fit, but did not report on, several other models based on only the first two as well as all five categories of businesses and jobs in these industries. The five categories included not only the three industry categories in our models but also those in (d) natural resources, as well as (e) environmental compliance, education, and training, and public awareness. Although the results were substantially similar regardless of the number of industrial categories we included in our operational definition of green industry, we decided to use the businesses and jobs found only in the three specifically because they are so clearly aligned conceptually with green energy industries.
At the same time, our decision to define green industry in terms of a combination of the first three categories of GGS industries restricts the scope of applicability of our results in terms of policy. Although the results obtained on the basis of this definition provide conditional support for the arguments of RPS supporters, specifically in terms of spurring green business growth, use of this definition at the same time specifically precludes us from providing empirically meaningful responses to several of the arguments made by RPS detractors. Although explicitly supporting the detractor’s arguments by implying that enacting RPS for purposes of increasing the number of green jobs is misguided, they contain no logical and empirical implications whatsoever for any arguments about the effects of RPS either between green industry and other industry or within the categories of green industries thus defined. The results have nothing to say, for instance, about whether any increases in the number of green businesses attributable to RPS come at the expense of even greater numbers of other businesses in, say, the coal industries. Nor have they any bearing on the detractor’s concerns regarding whether or to what degree other types of policies might bring equal or greater benefits at lower costs.
Our models are also limited in a few notable ways. First, we operationally defined green industry in terms of the BLS categories. Other operational definitions might possibly have produced different results. Second, our models did not capture local or substate regional variation in the labor market effects of RPS. Insofar as within any given state, one region specializes or has a cluster in an industry or group of industries that benefit from RPS, whereas another does not, the models in this research could not be expected to discern it. Especially given that the focus of so much economic development is local and substate regional, further research that investigates the effects of RPS at a smaller geographical scale would be useful. Third, although our models included measures of RPS stringency that reflect the size and timing of targets, they did not include an array of key RPS variable design features such as what resources count toward the RPS, limits to ratepayer costs, and enforcement provisions. More complete evaluation of the effects of RPS on green economies awaits collection of the requisite data. Fourth, given our approach of using econometric growth models, it was not feasible for us to explicitly consider any sort of indirect or induced effects on other jobs or businesses affected secondarily by the RPS. Estimation of the indirect or induced effects would require additional analysis using an input–output model.
Conclusions
One of the pivotal questions in the controversies over renewable energy portfolio standards is whether or not in point of empirical fact the presence of RPS contributes significantly to green business and job creation in a state. Our research suggests that, all else equal, the presence of RPS will have no discernible effect one way or the other on state green job growth. The RPS will, on the other hand, help create green businesses if they are allowed to persist in force for a number of years. One interpretation of this is that the enactment of RPS sends signals suggesting that state policy makers actively support green entrepreneurship. As a result, individuals previously employed in other green industries leave and start their own small businesses while remaining within the green industries.
A range of factors other than the presence of RPS do evidently influence state green business and job growth. Among these, the single most important state economic development factor is the health and vibrancy of overall state economic markets. More green industry is found in states with greater total gross state products. Also, as economic growth theory would suggest, our research provides some indication that more green jobs are found in states with greater knowledge stock and more investment in public infrastructure. States can thus evidently help create green businesses and jobs indirectly to be sure, but reliably by making public investments in their educational systems and public infrastructure.
Footnotes
Authors’ Note
The views stated in this article are those of the authors and are not necessarily those of the Federal Reserve Bank of Cleveland or of the Board of Governors of the Federal Reserve System.
Declaration of Conflicting Interests
The authors declared no potential conflicts of interest with respect to the research, authorship, and/or publication of this article.
Funding
The authors received no financial support for the research, authorship, and/or publication of this article.