
Abstract
Results are reported from a Latino immigrant entrepreneur needs assessment survey. The research project was conducted to identify barriers to business formation and continuation within the target population. A total of 171 surveys representing more than 200 businesses from 39 communities in 21 counties in western Arkansas were collected. Nearly 42% of respondents cited start-up capital as their biggest barrier with another 15% naming it as the second biggest barrier. Understanding government regulations and tax information rated as the second biggest barrier that Latinos encountered. This barrier is more pronounced in rural areas than in urban areas. Other top concerns include advertising, location, and obtaining licenses and permits. A closer examination of barriers finds nuanced differences between rural and urban entrepreneurs. Outreach programs and materials developed in response to research findings are presented.
Introduction
Researchers supported by public funding and private foundations have made substantial efforts to understand the complexities surrounding the recent wave of Latino 1 migration to the United States. What is unique about the current wave of in-migration is that the destinations now extend beyond the historical gateway locations to many other areas, many of which are located in rural communities and regions (Dalla, DeLeon, Stuhmer, & Carreno, 2010; Durand, Massey, & Charvet, 2000; Farmer & Moon, 2011a, 2011b; Kandel & Cromartie, 2004; Lichter & Johnson, 2006). These nontraditional migration destination states have come to be called “New Destination” states. This new spatial distribution of Latino migrants has social and economic implications for both new residents and the communities in which they reside.
It is becoming increasingly clear that many communities experiencing a relatively rapid influx of new residents face an array of opportunities as well as challenges related to the arrival of these migrants. There are many communities (particularly in the rural areas) that would have lost population in recent years were it not for in-migration of workers and families from Mexico, El Salvador, Guatemala, and other Central American countries (Kandel & Cromartie, 2004). These in-migrants have met demands for labor, become consumers of local goods and services, contributed to the local tax base, and in general expanded the local economy. In addition, the in-migrants have added richness and vibrancy to the social and cultural mosaic of many communities; however, many of those communities with large influxes of in-migrants face a dilemma. Although the new community members bring “new life” to the local area, they also may have needs that differ from long-term residents or in-migrants from other areas of the United States. As Lichter (2012) noted, “Communities are attracting newcomers with little exposure to American society and fewer interpersonal and community resources to easily adapt to their new environment” (p.14). For example, many in-migrants may require language assistance. Another example is evident in a closer examination of the population structure of the growing Latino population. Because this population is generally younger and more likely to have children, educational services and services to families will be in greater demand. In short, the new community members often struggle to understand the social, institutional, and cultural nuances that are part of their new location, while the communities may struggle to address the needs of the new residents.
One area of particular interest to migrants and the larger community alike is business ownership. As part of the migration-based growth, concomitant efforts have arisen in entrepreneurial activities that originate within the migrant population. The current focus on understanding migrants and their businesses is driven by two key factors. First is that many small towns and rural areas have experienced economic decline and population loss in the last decade. This pattern of decline has resulted in many efforts at local area development to stabilize the population and economy (Dalla et al., 2010). The in-migration of Latinos has stabilized, and in some cases, increased population. Population trends in rural counties over the past several years have shifted as amenity-driven and international migrations have tapered off. At the end of the 2000s, the number of nonmetropolitan counties losing population grew to 1,123 from 995 in the mid-2000s (Economic Research Service, 2010). The number would have been higher without the continued, though slowing, influx of Latino migrants (Farmer, Miller, Moon, & Goforth, 2010; Farmer, Moon, & Miller, 2007; Mather & Pollard, 2007). This in-migration of Latinos represents a potential avenue for local area development efforts.
A second reason for the current focus on businesses is the scarcity of information and literature on Latino entrepreneurship in general and rural entrepreneurs specifically. In addition, recent findings on the Latino migrant population suggest substantial differences between those living in rural versus urban areas and suggest a need to address this question related to Latino entrepreneurs. Migrants arriving in rural areas since the American Free Trade Agreement of 1994 are much more likely to be single, have more education but less English fluency, come from small towns and rural areas, and have less work experience and less family experience with migration to the United States (Farmer & Moon, 2009). These results suggest a need to better understand the similarities and differences in Latino entrepreneurs across rural and urban areas to develop programs tailored to the specific needs/characteristics of the entrepreneurs. Furthermore, recent research (Farmer & Moon, 2011b) has also demonstrated the likelihood that Mexican migrants arriving in rural areas will have previous business ownership experience, a characteristic linked to additional business creation.
This study reports descriptive results of a survey designed to assess barriers to entrepreneurship encountered by Latino migrant business owners. Specifically, the target population was Latino migrant business owners in rural and emerging urban areas within a New Destination state. The article reports the efforts to develop tailored outreach programs to help address barriers identified by the target population. The article first provides a very brief overview of the recent trends in Latino migration and the circumstances of rural communities in particular. Next is a description of the study area, the sample, and the survey. This is followed by a reporting of descriptive results of the survey. The article concludes with a description of educational resources developed and a pilot outreach program designed to assist in the attenuation of the identified barriers.
Data
To provide insight into the characteristics of the migrant entrepreneurs and their perceptions of barriers to entrepreneurship, this study uses primary data from “Entrepreneurial Development Targeting Rural Hispanic Immigrants: A Collaborative Research and Extension Project” (Farmer, Miller, Moon, Abreo, & McCullough, 2012). Originally the project included 26 counties in western and central Arkansas. Responses to the surveys were collected in 39 communities in 21 of the original 26 counties in rural and urban Arkansas (see Figure 1).
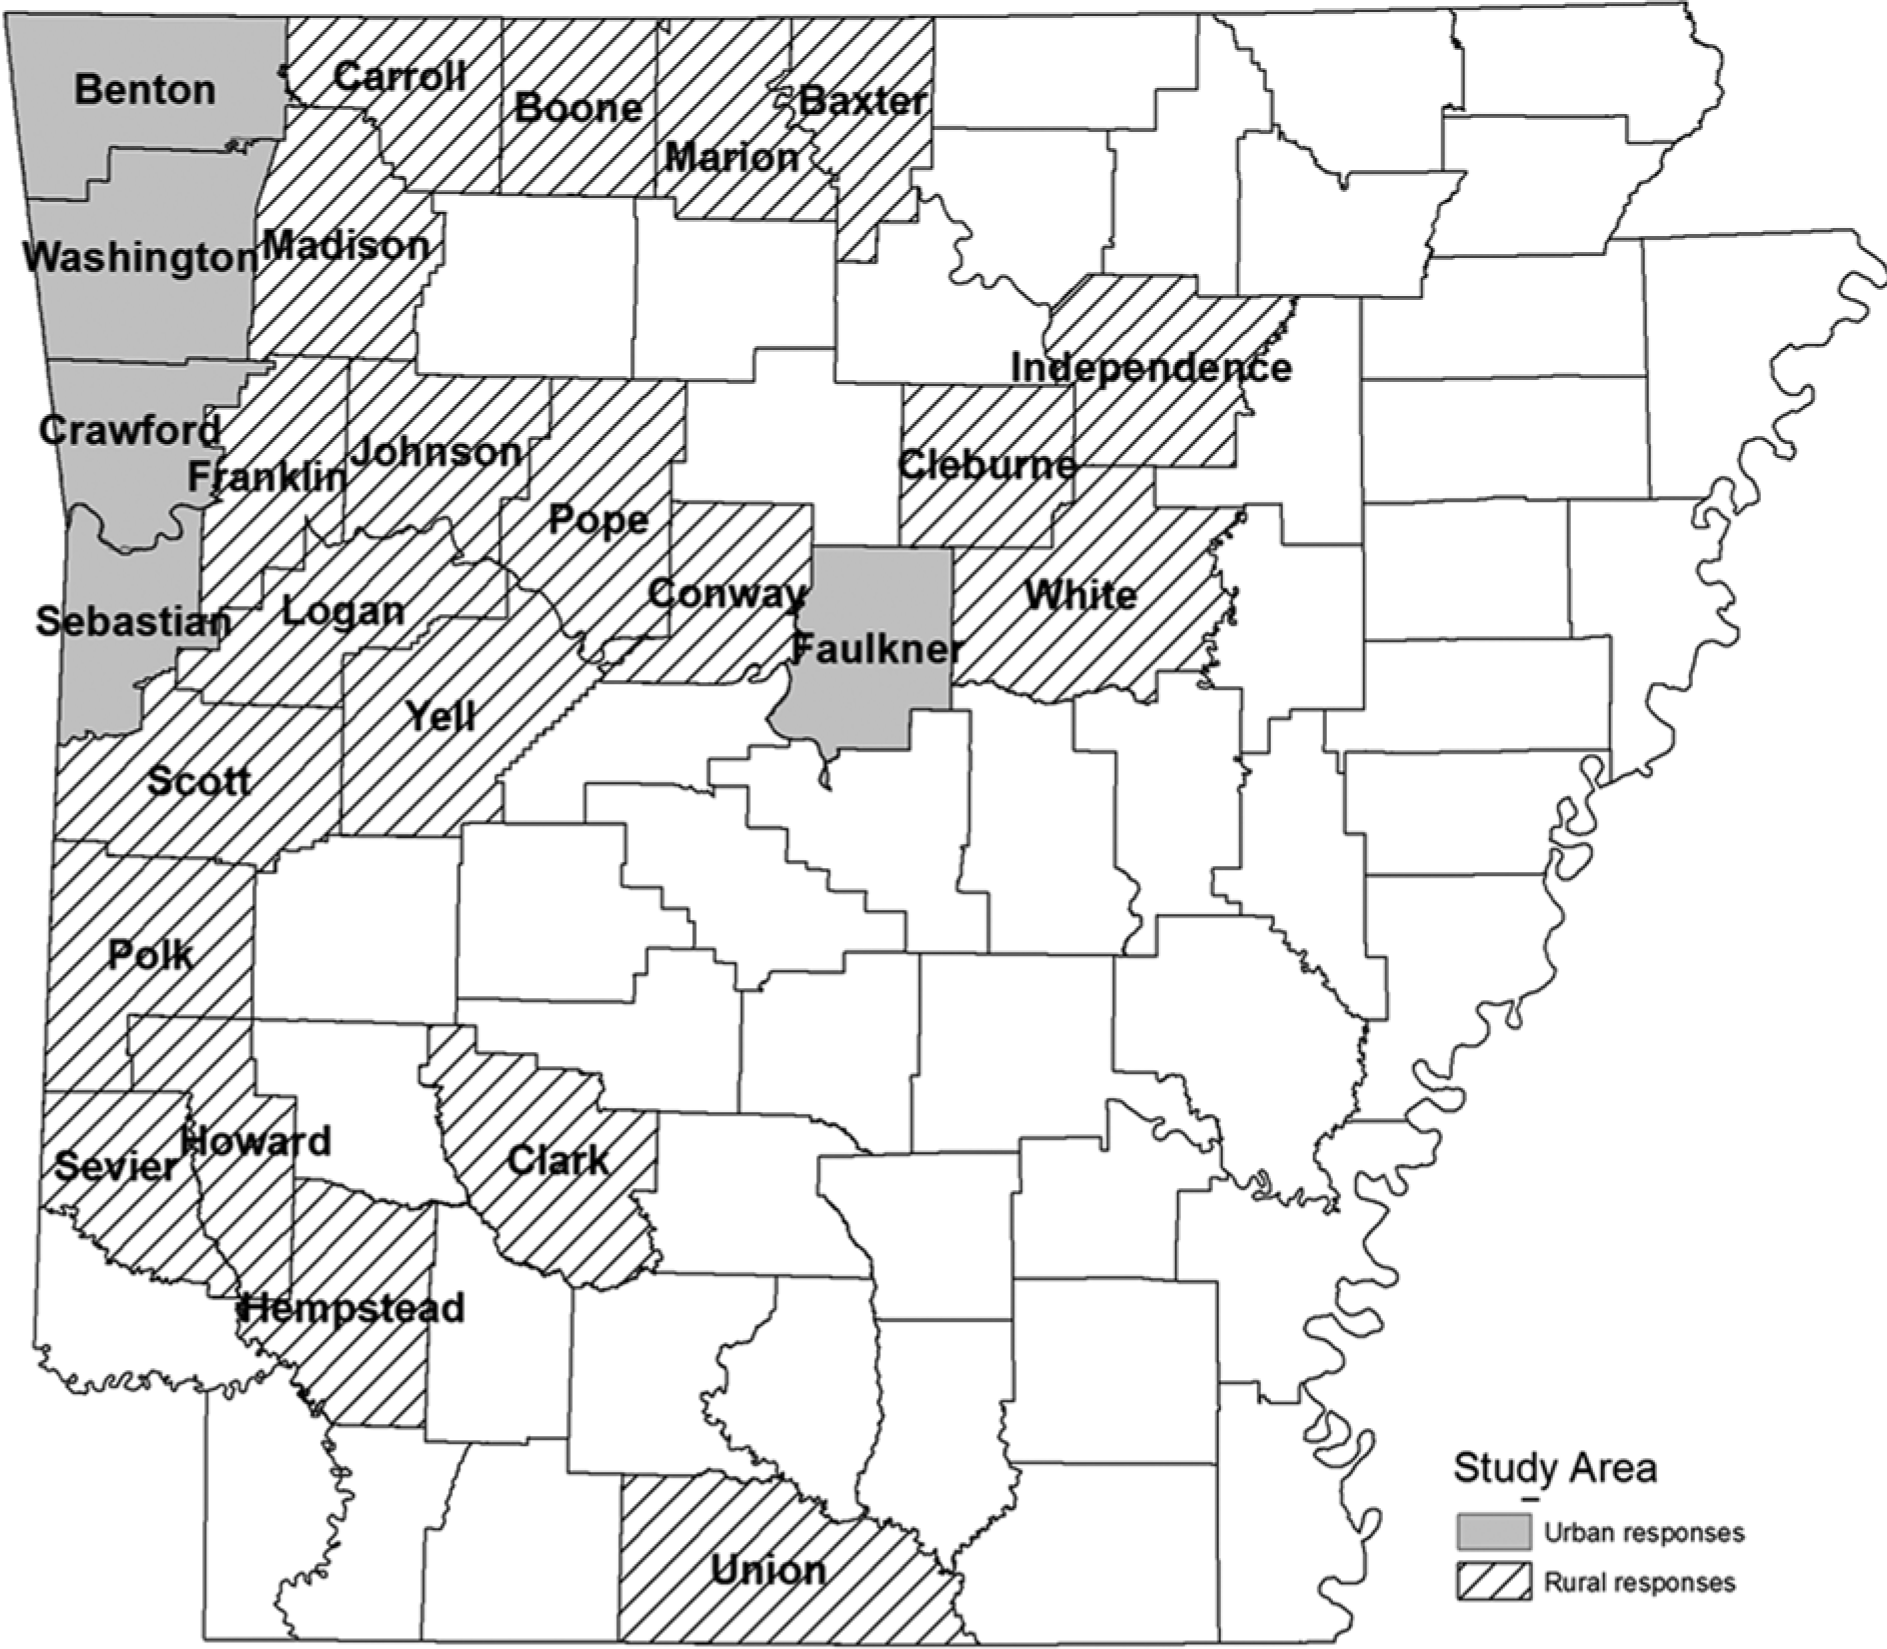
Study area.
Latino immigrant–owned businesses were identified and located with help from area cooperative extension service (CES) and chamber of commerce personnel. Additional information on Latino businesses was obtained from the state food license list that was provided by the Arkansas Department of Health. The list was used to identify businesses with Spanish language names and/or that clearly targeted a Latin American customer base (e.g., loncherias, panaderias, taquerias, carnecerias, tiendas, mercados, and dispensas) within the study area. In conjunction with these methods, a physical survey of the downtown business area of a community was conducted. Businesses with Spanish-language names and/or that clearly targeted a Latin American customer base were contacted to determine if the business was eligible for inclusion in the survey (migrant owned and Latin American origin) and, if so, would be willing to participate. Failed or discontinued businesses were not included.
An additional qualification for inclusion in the survey was having a “formal” business presence in the form of a storefront, participating in local business associations, being known to regulatory agencies, or using public advertisement. Under this definition, a business such as a food street vendor or taco truck would be eligible, but running a construction crew would not be unless the business could be located through publicly available resources such as phone books, Internet listings, or physical surveys of office spaces. Limiting the sample to “formal” businesses or primarily “bricks-and-mortar” businesses was taken to clarify eligibility and align with formal economic and community development goals in the state, which include both business creation and business continuation. Researchers acknowledge that an unknown number of “informal” enterprises may be in operation in the study area and that these informal operations often are of importance for marginalized populations. Examination of these informal operations, however, is beyond the scope of this research.
A description of the relatively rare and difficult-to-access target population was an explicit objective of the research project. In Arkansas, no comprehensive list or database of immigrant-owned businesses existed from which to design a random sampling frame. As a consequence, the goal was to survey as many businesses as could be located that met the definitional criteria and would also agree to be included in the project and to do so within the limits of the resources of the project. A final explicit research goal was to survey businesses within emerging urban areas as well as rural areas to enable comparison of needs and characteristics within these two categories.
Survey sample demographics were compared to federal government data (Small Business Administration, County Business Patterns). These data sources do not include citizenship status but were used for all businesses as well as for the subset of Hispanic-owned businesses. The survey data were also compared to recently released Public Use Microdata Sample Survey of Business Owners 2007 data that do include information about ethnicity, nativity, and gender but only at a multicounty, state, or regionally aggregated level. In addition, the data were compared data from the Kaufmann Foundation Survey, 2 which includes variables for nativity as well as race/ethnicity. Comparisons to these larger data sets indicate that this survey may slightly oversample women-owned businesses and have slightly lower educational attainment rates among the owners. However, other demographic comparisons (age, years of operation of business, previous ownership, legal ownership type) are within range of these data sets. Compared to demographics from a larger multistage random sample survey conducted in Iowa communities (Bird et al., 2001), the businesses are overall smaller and have been in business fewer years. The percentage of female ownership, mean owner age, previous business ownership, and measures of civic involvement are similar.
The survey instrument was developed in an iterative process and pretested among Latino business owners. The instrument was delivered in a semistructured interview format. The choice of the semistructured face-to-face approach, as opposed to a mail or telephone survey, was dictated by the lack of addresses and phone numbers of the target population and the need to establish a rapport and trust with the business owners. Each interview was conducted in the language preferred by the respondent.
Arkansas represents an ideal natural laboratory for this research in that the state has experienced an extremely rapid influx of Latinos into both rural and urban communities. Since 2000, the estimated Hispanic population has grown by more than 54,000 persons, a 114% growth in this time period. This explosive growth, however, has been geographically concentrated. Two out of three Hispanics (67%) live in the 26 counties included in the study area for this project. Communities were selected based on the size of the Latino population, to ensure the presence of current and potential entrepreneurs, and on the percentage of recently arrived Latino migrants. A primary objective of the project was to identify entrepreneurs’ needs and barriers to business creation and continuation. A characterization of the surveyed owners and businesses is given next, followed by the results of questions on needs and barriers.
The Entrepreneurs
Table 1 presents selected personal, business, and ownership characteristics, comparing businesses found in rural versus urban communities. An unexpected finding was the lack of significant differences between businesses in smaller and larger communities. Only four of the characteristics shown were statistically different (p < .10) along the dimension of community size. The percentages by rural and urban are provided for additional information and because of the nuances in interpretation of selected barriers presented later.
Distribution of Selected Characteristics of Respondents and Businesses.

Significantly different at p < .10.
As can be seen in Table 1, the “typical” Latino immigrant entrepreneur in the survey data is a sole proprietor and male. Two thirds of the survey participants (61%) are between 40 and 65 years of age with an average age of 44 years (see Table 1). This finding is similar to results elsewhere for Latino entrepreneurs (Zarrugh, 2007) and matches trends among the broader U.S. population (Stangler, 2009), suggesting the possibility that this age bracket is more entrepreneurial than younger age groups. The majority of these entrepreneurs have two to three children, with approximately another quarter of the sample having four to five children. More than 75% report having children currently in the local public school. Nearly all of these entrepreneurs (81%) own their own home.
A key finding in the project is the relatively high level of educational attainment of the entrepreneurs surveyed. More than 20% of the participants have completed the U.S. equivalent of a high school education in their home country (Grade 9). Nearly 17% have completed 12 years of education or the equivalent of U.S. college preparatory or vocational technical training; another 15% have education beyond this level. Of the total sample, more than two thirds have the U.S. equivalent of a high school diploma or more. This contradicts the stereotypical image of Latin American immigrants as poorly educated, unskilled laborers.
Not surprisingly, more than two thirds of the businesses included in the sample are owned by Mexican-born migrants. This mirrors the dominance of the migration flows into the United States in general and Arkansas in particular by Mexicans. However, it is noteworthy that Salvadorans make up nearly 20% of the sample. This is a higher incidence than the presence of Salvadorans in the broader immigrant population in the state (Pew Hispanic Center, 2009, 2010).
The typical storefront entrepreneur is also from an urban community in Mexico. Of the overall sample, only 40% of the respondents originated in a rural area. However, among businesses located in rural communities in the study area, 43% originated in a rural area compared to 34% for businesses located in urban communities. Other research (Farmer & Moon, 2009) confirms this pattern of rural-to-rural migration from Mexico.
On average, these entrepreneurs have spent slightly more than 20 years in the United States and have visited their home countries numerous times. About half of them arrived in the United States prior to the Immigration Reform and Control Act of 1986, with another 24% arriving between the Immigration Reform and Control Act and the North American Free Trade Agreement of 1994.
Over one third of the survey respondents reported speaking and understanding English, although almost all of the interviews were conducted in Spanish. Very few reported no understanding of English, and slightly more than 40% reported some understanding of English but were not able to speak the language.
The Businesses
The surveys included 221 businesses or an average of almost 6 businesses per community. Only about one fourth of the owners surveyed owned multiple businesses. Fewer than 29% reported owning a business in their home country. Most of the businesses, nearly 80%, are sole proprietorships. One unexpected finding was the large number of businesses owned by women. Twenty-eight percent of the businesses in the survey are female owned 3 ; contrast this with 33% owned by males and 22% owned by couples. The remaining 16% of the businesses are owned by siblings, friends, or other combinations of persons.
On average, the businesses employ slightly more than three people besides the owner with almost 40% reporting no employees beside themselves. The majority of the businesses would be classed as a microenterprise, which is defined as having 10 or fewer employees.
In an effort to elucidate whether the storefront business owner perceived their business as operating within an ethnic enclave or within the broader community, the survey asked questions about the business’s clientele and use of language. When asked to characterize the ethnicity of their clientele, only 13% responded Latino only. Urban businesses had a statistically significant higher rate of Latino-only customer base, as might be expected given emerging enclaves in the urban areas. The majority of storefront businesses, however, serve both Latino and other customers. Only 40% reported using Spanish only in dealing with their clientele.
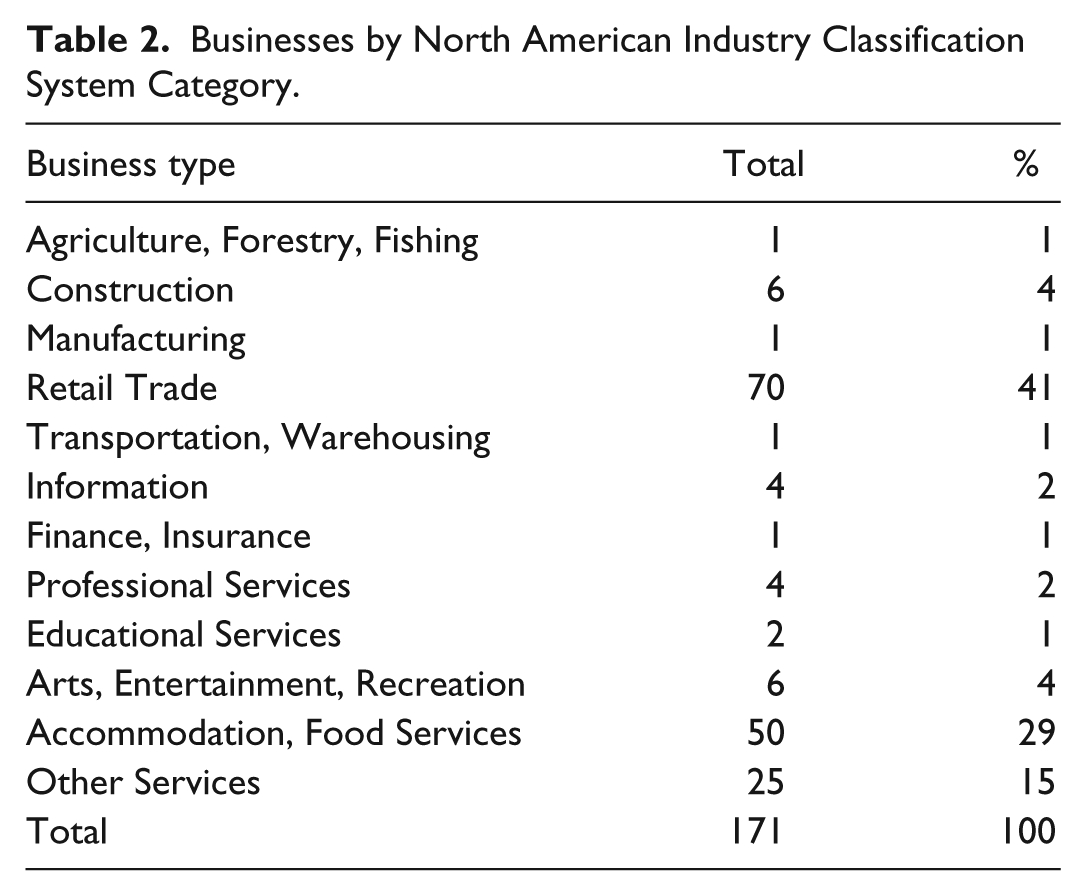
Businesses are classified using the official U.S. government North American Industry Classification System. Under this system, approximately 70% of the Latino businesses surveyed fall into either the Accommodation and Food Services (AFS) or the Retail Trade categories. As can be seen in Table 2, almost 30% of the businesses fall into the category of AFS and slightly more than 40% are classified as Retail Trade. The AFS category contains businesses that serve and sell food and includes establishments that provide lodging or other services. About two thirds of this category comprise restaurants. Since grocery and specialty food stores account for approximately 60% of the businesses classified as Retail Trade, grocery stores and restaurants account for 45% of the establishments in this study. A large share of the businesses, not classified as Retail Trade or AFS, are classified as Other Services and make up 15% of the sample. Construction makes up fewer than 4% of the number of businesses.
Businesses by North American Industry Classification System Category.
Barriers and Needs
One of the primary goals of the study was to identify barriers to storefront business formation and continuation. As can be seen in Table 3, business owners identified start-up capital, understanding regulations and taxes, advertising, licensing processes and requirements, and finding a location as barriers to entry and/or business continuation. In general, although language barriers are not specifically implicated in the findings as might be expected given the length of time of these entrepreneurs in the United States, cultural differences are apparent in the nuances of the findings below.
Primary Barriers Experienced by Latino Storefront Businesses in Arkansas.
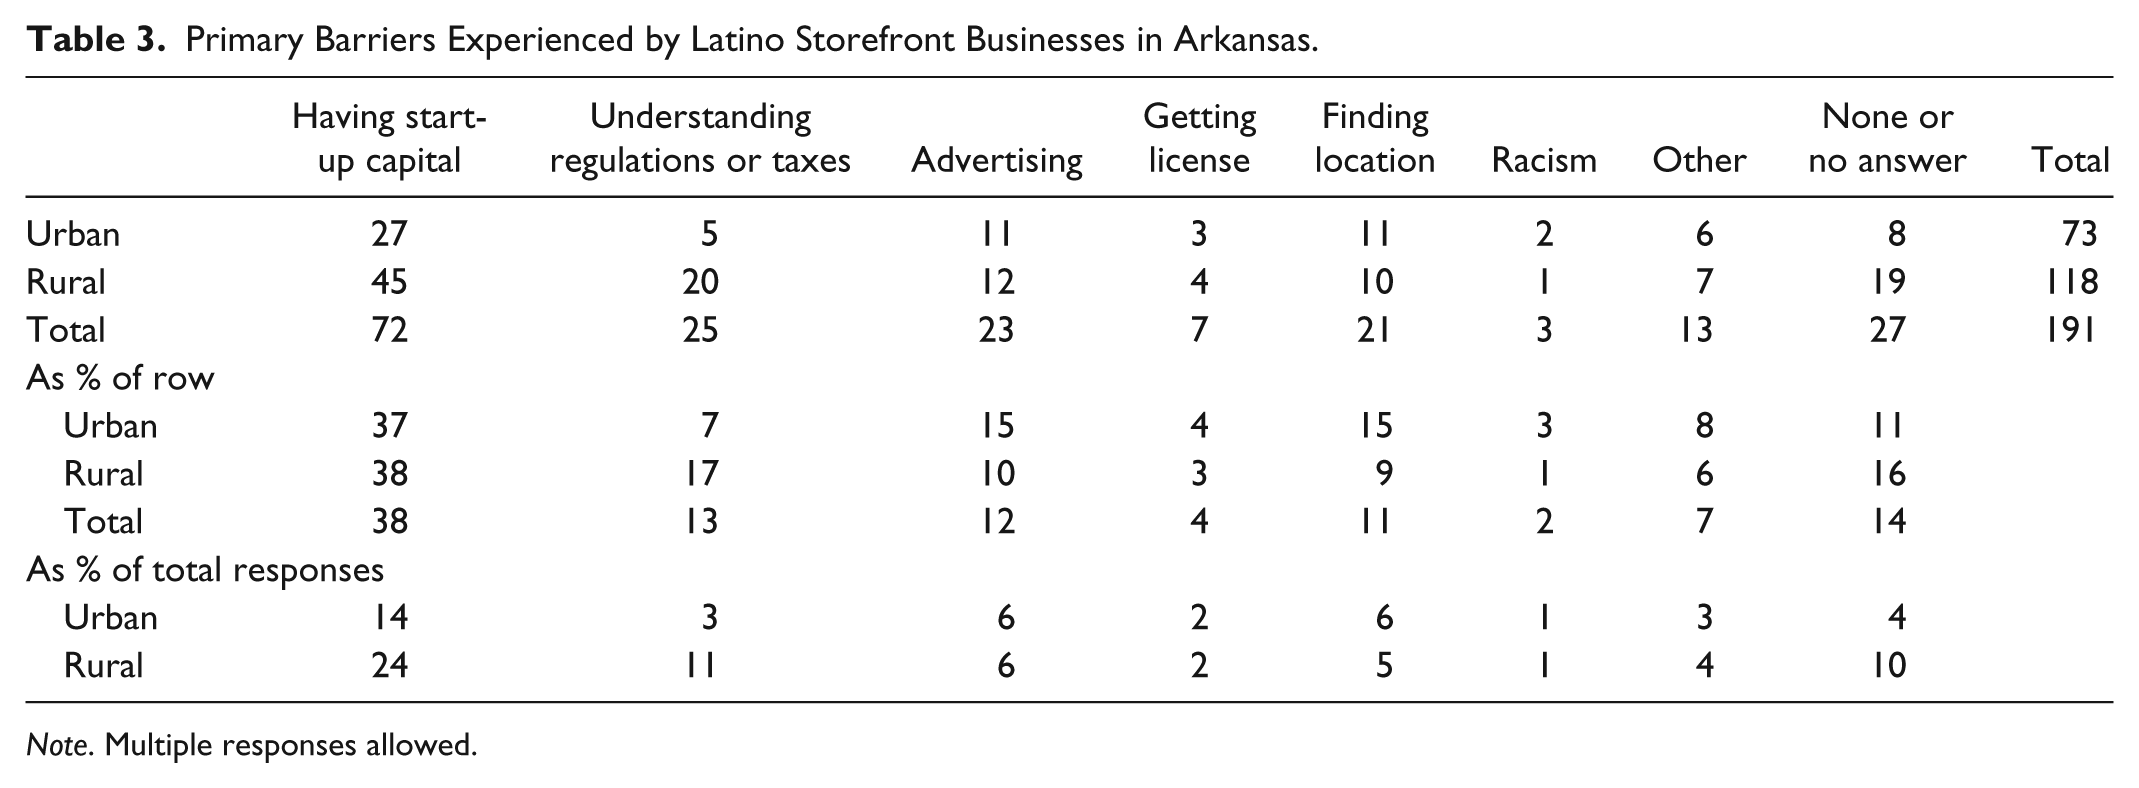
Note. Multiple responses allowed.
As is common with many small businesses, insufficient start-up capital was named as the biggest barrier facing surveyed owners when trying to establish their business in Arkansas. Nearly 42% of respondents cited start-up capital as their biggest barrier, with another 15% naming it as the second biggest barrier. Successfully obtaining a business loan seems to be difficult for Latinos in the sample. Only 28 (16%) of respondents indicated they had received a loan to start their businesses. Although many previous studies have identified capital as a primary constraint for Latinos in starting or expanding their businesses (Bitler, Robb, & Wolken, 2001; Blanchflower, Levine, & Zimmerman, 2003; Cavalluzzo, Cavalluzzo, & Wolken, 2002; Cavalluzzo & Wolken, 2005; Craig, Jackson, & Thomson, 2006), this study observed some reasons why Latino entrepreneurs were unable to obtain capital from institutional sources. Survey participants reported not understanding the requirements to obtain capital and therefore were ill-prepared when meeting with lending officials. Survey participants also reported feeling ignored, discouraged, or rejected at local banks when attempting to speak to a loan officer regarding a loan. Many storefront Latino business owners reported being shocked and confused when finally speaking to a loan officer and learning that their home could not be used as collateral, as approximately 80% of respondents own their home.
Linked to this problem, however, is a need to know how to write an acceptable business plan and even understanding that a written business plan is generally required before making a loan application. Many business owners reported learning first about business plans from loan officers, but they did not feel that the officer provided additional information about how to create it or where to seek assistance in writing one. Specifically, 17% of those surveyed reported needing assistance with business plan writing and 11% asked specifically for information on how to get a loan.
Those business owners who were able to create a business plan reported that their loan applications were rejected on the basis that the financial estimates did not include potential costs incurred for regulatory compliancy requirements. Miscalculated expenses related to poor planning and lack of knowledge of the regulatory system are other obstacles that Latino immigrant business owners cite as preventing them from having enough start-up capital. Some participants explained that as soon as they thought that they had collected enough money to start their businesses or had paid all of the necessary fees to open their businesses, they learned of another costly license/permit/regulation that delayed their start date.
Federal, state, and local regulations required for operating a business legally presented another barrier. Approximately 13% of respondents reported understanding regulations or taxes as their biggest barrier, with another 16% reporting it as the second biggest barrier. In smaller communities, more respondents reported this as a barrier (17% of rural respondents) than did their urban counterparts (7% of urban respondents). Only a small percentage (4%) cited obtaining a required license as having been the biggest barrier.
Respondents cited the following obstacles in understanding regulations, taxes, and the licensing process:
Lack of information about local, county, state, and/or federal licensing requirements
Lack of information about licensing requirements for different businesses and occupations
Lack of organized information sources about licensing process (step-by-step)
Difficulty obtaining regulatory information from government agents
Difficulty locating/contacting appropriate regulatory agency, contact person, or application
The processes of understanding regulations and obtaining licenses are closely related and seem to be directly correlated with community size. Respondents in rural communities have more problems learning about and understanding regulations and taxes but fewer problems in obtaining licenses. It seems that once entrepreneurs in rural areas find that they need a license and learn how to obtain it, then the actual licensing process is much less difficult than the experience of urban respondents.
Understanding regulations, and by extension getting a license, is a much more critical issue in urban areas. Several urban business owners felt that regulatory agencies place undue obstacles or create unjustifiable confusion by not releasing sufficient or relevant information from the very beginning of the licensing process. For example, business owners explained that when they were able to obtain a list of required licenses, they were not told that receipt of one was dependent on approval of another, or that one license can be taken away if another was rejected (e.g., a city business license can be revoked if the fire code inspection failed).
Another barrier reported by respondents was advertising. Twelve percent reported this as their biggest barrier; approximately 13% cited advertising as the second biggest problem. Advertising is slightly more problematic in urban areas than in rural ones. Fifteen percent of urban area respondents indicated that this was their biggest barrier, compared to 10% for rural respondents. The differences in the “barrier” of advertising between rural and urban areas are nuanced. In urban areas, business owners rely more heavily on mass media but reported feeling relegated to Spanish-only outlets. In rural areas, the difficulty with advertising was due to a lack of knowledge about creating advertising and few outlets through which to distribute their advertising.
Finding a location was problematic for both rural and urban businesses. Approximately 11% of the participants reported this as their biggest problem, whereas 15% reported it as their second biggest problem. However, the barrier of “location” is different for rural owners than urban ones. Finding a location is reported as being a problem more often by urban respondents (15%) than rural ones (8.5%). For rural areas, lack of space (buildings) was usually the obstacle. For urban areas, lack of information about understanding and negotiating lease agreements along with understanding the rights and responsibilities of the lessees and lessors was more often reported as the underlying issue with location barriers.
Other barriers were mentioned by a few businesses, but racism was not mentioned as an explicit barrier except by three respondents. Just fewer than 16% of those surveyed either chose “None” or did not provide a response. The majority of those were rural businesses.
In addition to barriers, participants were asked about information or training that would have been helpful prior to starting their business. The identified needs mirror in many ways the identified barriers (Table 4). Assistance with business plans and regulations were the two most common responses at over 17% each. Management training was only slightly behind these two with just under 17%. Some of the particular comments regarding management training indicated that management of human resources (employees) as a particular focus would be very helpful. Information or training about obtaining a loan received about 8% of the responses. Language classes or assistance followed with about 7%. These responses were coupled with the findings on identified barriers to design the outreach programs.
Information Needs of Storefront Business Owners in Arkansas.
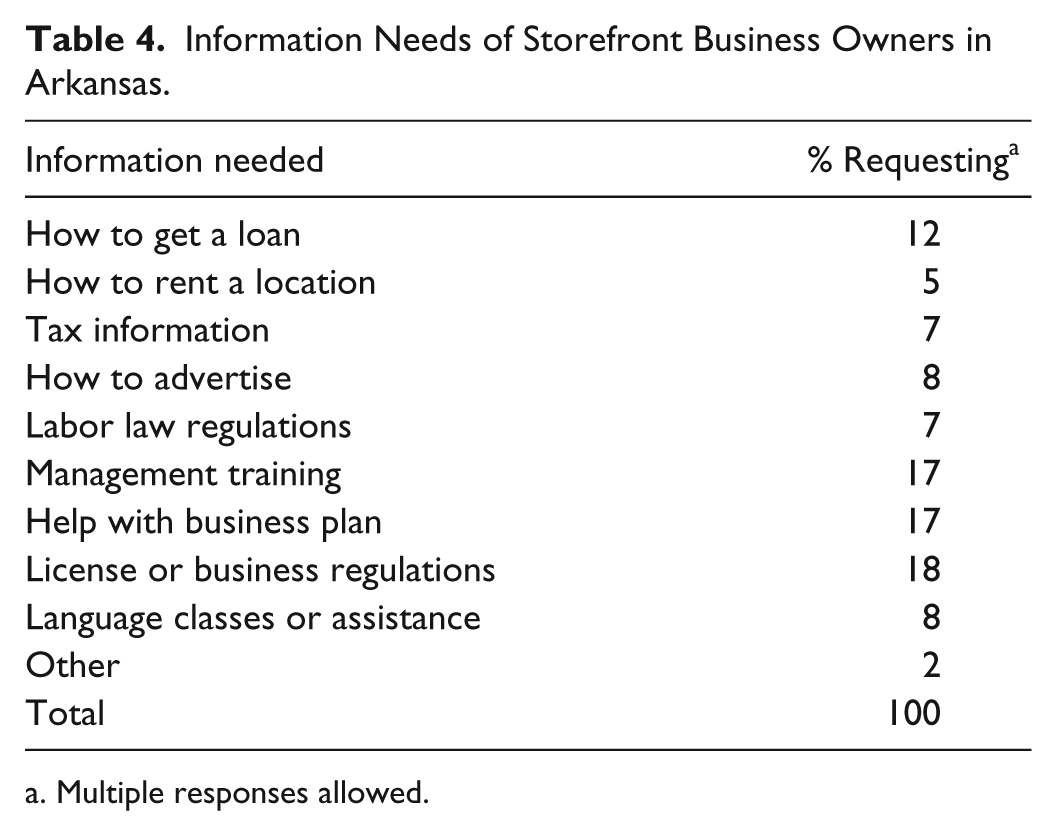
Multiple responses allowed.
Resource Materials Developed
Using the information collected from the survey on barriers to business start-up and growth and the information and training needs of Latino storefront businesses, the following resource materials were developed to address these needs 4 :
A Resource Guide to Latino Entrepreneurship Training Materials
Latinos Immigrant’s Guide to Starting a Business in Arkansas: A Handbook for Entrepreneurs
Business Owner’s Record Portfolio: A Handbook for Entrepreneurs
Checklists for licensing a new business
The first step in developing resource materials was to identify existing resources and training materials that could be used to address the needs of Latino immigrant entrepreneurs in Arkansas. The information collected was published in a document titled A Resource Guide to Latino Entrepreneurship Training Materials. This guide presents resources on entrepreneurship information, advice, and training from various U.S. for-profit and nonprofit associations. The resources include activities, worksheets, videos, workshops, self-assessments, websites, glossaries, and checklists.
The guide focuses on materials in Spanish that have broad relevance and applicability and are available for public use. The selected references do not form an exhaustive list of all available literature, but rather provide a representative sample of print and Internet resources that are available to Latino immigrant entrepreneurs. The selection also focuses on those resources that could be easily adapted for classroom and/or workshop use. The documents selected are available from suppliers at little or no cost.
The next step was to develop a training manual that addresses the identified needs of Latino entrepreneurs and provides a complete guide to starting and growing a business. The Latino Immigrant’s Guide to Starting a Business in Arkansas: A Handbook for Entrepreneurs was developed by adapting and combining existing resources with original material to address the needs of Latino entrepreneurs in Arkansas. The guide, which is published in Spanish and English, is designed to provide information to Latin American immigrants who are considering starting a small business in Arkansas as well as established storefront business owners who want to learn more about successful business practices. The goal is to help Latino entrepreneurs start a business in Arkansas by providing information about each step of the start-up process. The step-by-step process is also designed to help develop a business plan by using worksheets and activities to collect and organize information. Most of the material included in this publication was developed in direct response to survey results collected from Latino immigrant entrepreneurs in Arkansas about special training or information they would like to receive.
A Business Owner’s Record Portfolio was developed to provide Latino immigrant entrepreneurs with a folder to keep their business papers. The portfolio consists of a single folder that keeps their business papers organized and easy to find. It also serves as a reminder if all necessary papers are not in the portfolio.
Finally, checklists for licensing new businesses were developed in response to the expressed need for “a single piece of paper” to list the requirements for starting a business and where to go to obtain the necessary licenses and permits. Checklists were developed for 37 communities in 26 counties in western and central Arkansas. The checklists are community specific and contain information on the regulatory requirements for starting a business and contact information in addition to a sequential checklist of things to be done before starting a business.
Pilot Outreach Program
Two pilot training programs were conducted to provide the information and resources to help Latino entrepreneurs overcome barriers in starting and growing their businesses. Primary objectives of the pilot training programs were to obtain evaluation and feedback of the resource materials and training program to make future materials and programs more helpful for Latino entrepreneurs. The workshops were conducted in two rural communities with relatively large Latino populations, DeQueen (Sevier County) and Danville (Yell County; see Figure 1), using the My Own Business, Inc., training materials in combination with the resource and training materials developed by this program. The pilot training programs consisted of three 2-hour workshops covering three topics: business organization, writing a business plan, and accounting and cash flow. These three topics were identified as the highest priority training needs by Latino entrepreneurs.
All workshops were conducted in Spanish to encourage Latino immigrant participation. The resource and training materials were in English, except for the Latinos Immigrant’s Guide to Starting a Business in Arkansas: A Handbook for Entrepreneurs, which was available in both Spanish and English.
Seventeen people attended at least one of the DeQueen workshops, with 9 attending all three. Similarly, 12 people attended at least one of the Danville workshops, with 8 attending all three. We went beyond the usual extension service advertising media to obtain Latino participation in the workshops. For both DeQueen and Danville workshops, we had Spanish-speaking people who were respected by the Latino community make personal visits and invitations to entrepreneurs. The workshops were also advertised in local Latino news outlets including church newsletters. Although these numbers appear small, Yell County (Danville) had so few Hispanic-owned businesses that the count of them was suppressed in the 2007 Survey of Business Owners data (U.S. Department of Commerce, 2010), and Sevier County (De Queen) was listed as having only 33. Comparably then, the workshops reached a larger proportion of the intended audience than may be suggested by the apparently small attendance.
Most of the participants in the Danville workshop and about half in the DeQueen workshop owned businesses and attended to improve their knowledge and business skills. Their businesses included restaurants, grocery, construction, clothing, and other retail stores. About one third of the participants attended to learn more about starting their own businesses. Their business interests included opening grocery, meat market, clothing, decorating for social events, beauty, Laundromat, and restaurant stores. An interest was expressed, especially among the women, in diversifying into more retail and service businesses other than traditional restaurants and grocery stores.
The workshop participants rated the training and training materials to be relevant and greatly beneficial. Many suggested that additional training and assistance be provided to them on a wide range of topics. Although less than a year elapsed since the final pilot workshops in Danville, several of the DeQueen participants implemented business practices learned from the training and two opened new businesses.
In addition to the business knowledge and skills gained, the pilot workshops facilitated communication between the Latino community and local business and community leaders, including the CES. Local leaders described the services available to local businesses, interacted with the participants, and invited them to use local services. Also, stronger linkages were developed with the local Small Business and Technology Development Center (SBTDC) personnel. SBTDC personnel attended the workshops and served as resource professionals answering technical questions. Several participants indicated that they were going to use the SBTDC services on completion of the workshops. Many participants also said that they were going to use the resources of the CES now that they knew more about the organization.
Conclusion
Local businesses are central to the health of communities. The recent growth in the Latino population in many communities across the United States represents one of the most dramatic demographic events in recent decades. The results presented above clearly indicate that within this pool of migrants there is a vibrant and active group of entrepreneurs. The importance of this group of individuals to local communities cannot be understated. Furthermore, the importance of creating a local business environment that supports the growth of local businesses, attenuates barriers, and enhances opportunities for entrepreneurs is a key element in local area development. Latino entrepreneurs represent an important component in the revitalization of many communities (both rural and urban) and represent a pool of human capital that, in many cases, is a gain for the receiving communities.
This suggests that creating an environment that supports the growth of neighborhood businesses and provides opportunities for entrepreneurs will be a bonus for individuals and communities. In several of the communities in the study area, Latin American migrant owners cited their businesses in struggling downtown business districts as contributing to a revitalization of these districts. Growing local businesses will provide additional revenue to local governments for the development of facilities and infrastructure needed to maintain and enhance the viability of these communities. Starting and maintaining a business means job creation, economic vitality and diversity, and expansion of the tax base for local and state governments. Just as important, it also means increased interactions with a wider set of community residents. As originally suggested by Allport (1954), positive effects of intergroup contact occur under four key conditions: equal group status within the situation, common goals, intergroup cooperation, and the support of authorities, law, or custom. Although business exchanges do not necessarily meet all four key conditions, the processes of creating, running, and maintaining a business are likely to help foster situations within which these key conditions may occur between business owners, vendors, and suppliers and customers.
This project developed resources for Latino immigrant storefront entrepreneurs that have helped them better manage their existing businesses and start new businesses in communities that were losing their native populations. The two pilot workshops have not only increased the business knowledge and skills of Latino immigrant entrepreneurs, but have established more linkages and better understanding between the Latino communities and local leaders. The Latino workshop participants expressed appreciation for having the opportunity to interact with local leaders and learn more about services available to Latino entrepreneurs. They indicated their interest in using more of the local services including the CES and the SBTDC. The relationship between CES and SBTDC was strengthened and is seen as complementary rather than competitive.
Footnotes
Declaration of Conflicting Interests
The authors declared no potential conflicts of interest with respect to the research, authorship, and/or publication of this article.
Funding
The authors disclosed receipt of the following financial support for the research, authorship, and/or publication of this article: This research was funded by USDA’s National Institute of Food and Agriculture, the Arkansas Division of Agriculture and Arkansas Agricultural Experiment Station. The authors are entirely responsible for the design, collection, analyses, and interpretation of data, writing of report or decision to submit this paper.