
Abstract
The existing literature on the relationship between employment growth and firm characteristics (such as firm age, size, and sector) has been used to justify a variety of economic development policies and job creation programs. Some of the programs highlight the importance of small firms, others emphasize the importance of young firms, and others highlight the importance of older, more established firms. The fact that each of these programs can find something in the literature that supports its particular focus suggests problems in the connection between the literature and policy formation. The authors find that the empirical support for such programs is weak. The statistical significance of firm characteristics depends critically on the model specification and/or data set used. Moreover, these characteristics explain only a small fraction of the variation in job growth, leaving policy makers with relatively weak policy tools.
“You can get anything you want . . . ”
Which firms grow fastest? New ones or old ones? Does size matter? There are a number of reasons, aside from pure academic curiosity, why we might want to know the answers to these questions. Investors are always searching for clues to direct them to where the best returns on financial investments can be found. Researchers interested in entrepreneurship ask questions about the determinants of firm growth rates in an attempt to gain insight into successful strategies for start-ups. Economic development efforts undertaken by state and local governments make use of existing knowledge about firm size–age–growth relationships to design development and job creation strategies. Indeed, the existing literature has led to a variety of different policies and job creation programs.
In this study, we examine the relationships among firm size, firm growth rates, and local employment growth from the perspective of economic development. We are concerned about how effective different job creation programs are likely to be when they focus on specific firm characteristics such as firm age, firm size, and industry sector. Agencies tasked with economic development activities must use variables under their control—financing assistance, management and workforce training expenditures, and business attraction and retention activities—to carry out their tasks, and it would seem useful to know how they might structure these activities to result in the greatest improvements in the goals of job and income growth.
The literature provides a wide array of stories about how job growth is linked to firm age or size. We illustrate why the literature is so frayed and highlight a point often overlooked in attempts to explain job creation. Specifically, we worry that the lack of discussion about what the different studies show, and why, can lead to poorly designed policies and public programs. We also worry that not enough attention is given to the difference between finding that something is statistically significant in a model versus demonstrating it is truly meaningful or economically significant. We believe that economic development practitioners who might read an article should be told whether a model has very little overall explanatory power—not just that a particular variable is statistically significant. In the end, we worry that many public programs in economic development do not have any theoretical underpinnings or solid empirical foundation.
Background and Literature Review
In “The Job Generation Process,” David Birch (1979) offered that small businesses were the engine of job growth. His findings generated a wave of research and debates about the contributions of large versus small firms to economic growth. One associated line of inquiry is the determinants of firm growth, and in particular, how the size or age of a firm affects its growth rate. For example, Hall (1987), Stam (2010), and others analyzed patterns in employment growth at the firm level and tested Gibrat’s Law—that much of the change in firm size is due to chance. Birch’s early work also encouraged research into the role of entrepreneurs, agglomeration, and knowledge spillovers in the job creation process, as well as the geography of growth.
Birch acknowledged in later publications some of the uncertainty in his seminal work. For example, he noted a decade after “The Job Generation Process” that the share of net new jobs created by small businesses varies by time and industry (Birch, 1989). Davis, Haltiwanger, and Schuh (1996) also found that “Conventional wisdom about the job-creation prowess of small businesses rests on misleading interpretations of the data” (p. 297). They focused on businesses in the manufacturing sector and, like Birch, found periods of time where larger firms create most net new jobs. Dennis, Phillips, and Starr (1994) found support for Birch’s original claim, but cautioned that such findings do not suggest that “big is bad” or that “small businesses deserve special treatment.”
Edmiston (2007) also found that small firms account for a relatively large share of employment in the United States, but argued that this fact needs to be kept in perspective. Small firms are also responsible for most dislocations, tend to pay lower wages, and offer fewer benefits. These latter points echo the literature on wage differentials across different-sized firms, which documents the tendency of large firms to pay higher wages (see, e.g., Brown & Medoff, 1989; Gerlach & Schmidt, 1990; Hettler, 2007). Moreover, those writing about firm growth have often found that innovation and spillovers resulting from business location decisions may be more important than firm size when it comes to job creation (Birch, 1989; Porter, 1990). In addition, Phelps, Fallon, and Williams (2001) used the expression “borrowed size,” which could suggest that small firms in many places may perhaps do well because of linkages to larger firms, or vice versa. The growth of one firm or type of firm may depend on the existence of the other, making a conversation about whether one type is somehow better much less meaningful.
Neumark, Wall, and Zhang (2005) found that the births of new business establishments and expansions of existing ones are the prime determinants of employment growth. However, Acs, Parsons, and Tracy (2008) found that high-impact firms, those that add the most to growth, are on average 25 years old. This finding invites questions about the relative value of younger firms, which may also be smaller. The result is also supported by an article in The Economist (2012) magazine titled “The Mighty Middle” that highlighted the strong relative performance of midsized firms, which have an average age of 31 years. The article also noted the performance and reputation of midsized firms in Germany, known as Mittelstand firms. Finally, Haltiwanger, Jarmin, and Miranda (2010) found that:
If one looks at the simple relationship between firm size and net growth rates, there is evidence that net growth rates tend to be higher for smaller as opposed to larger businesses . . . We find that once we control for firm age, the negative relationship between firm size and net growth disappears. (pp. 28-29)
These findings highlight the value of start-ups in net job creation, noting that start-ups can be small or large.
Haltiwanger et al. (2010), Haltiwanger (2011), Neumark et al. (2005), Acs et al. (2008), Edmiston (2007), and others explained the churning that occurs with small businesses—as those businesses are often responsible for more job creation and separations than larger businesses. The authors also mentioned time as an important variable and noted that the job creation process is not the same in every business cycle. Even with the explanations and caveats in the different articles, however, the range of results and ideas about job creation is rather striking.
The blogosphere also offers countless posts with different perspectives, many of which question whether small firms really do generate most jobs. For example, Eastman (2010) noted that, “ . . . companies with 50-499 employees, and 500 employees or more, accounted for more than twice the job creation as companies with 10 employees or less from 1992 to 2008.” And Rampell (2011) noted a decline in entrepreneurial activity and related employment following the recession of 2008. On the other hand, organizations such as the Kauffman Foundation (as exemplified by Wiens & Jackson, 2014) state that start-ups and entrepreneurs are the drivers of economic growth, echoing the work of Haltiwanger et al. (2010).
In some sense, the disparate findings relating firm growth to size or age all appear to be valid. Depending on how you measure growth and account for time, and what you include in the analysis, you can get most any result. At the same time, Daniel Kahneman’s (2011) theory of “What you see is all there is” may be relevant. Economic development specialists and others seem to be making far too much out of the relationship between firm size or age and firm growth. In fact, as we show below, firm size and age explain very, very little of the job creation we observe.
It may also be worth noting that there is little in the way of economic theory to support the models used in the exploration of how job creation depends on firm size and other factors. While many of the efforts are statistical explorations and/or are purely descriptive, 2 theory deserves consideration. Hoover (2013) reminded us that economics is not always an inductive science based on clear hypotheses and tests, so maybe the statistical explorations are to be expected.
Kennedy (2002) also recognized that applied econometrics cannot always be as clean and pure as one might hope, but he still highlighted the idea that economic theory should be obvious in the work. He offered a list of rules in applied econometrics, which includes paying attention to both the broader message that is being conveyed and to the question being asked. Finding that a particular firm characteristic is statistically significant in a model of employment growth may miss the mark in both cases, as implied by his Rule #9: Do not confuse statistical significance with meaningful magnitude. The fact that a variable is statistically significant does not mean it will necessarily be a good policy instrument. We note that there is existing literature on this topic and it is not our intent to review it here (see, e.g., Engsted, 2009; McCloskey & Ziliak, 1996).
Data and Analysis
Authors who publish research in this area often rely on different data for their analyses. Haltiwanger et al. (2010) and Haltiwanger (2011) used data from the U.S. Census Bureau, especially the Longitudinal Employer-Household Dynamic data and microdata available within the Census Bureau’s Center for Economic Studies. Other authors have used data that build on those collected by Dunn and Bradstreet. For example, Acs et al. (2008) used data from the American Corporate Statistical Library—developed by the Corporate Research Board 3 —based on data from Dunn and Bradstreet. The Edward Lowe Foundation has also used data from Dunn and Bradstreet, but modified by Wall and Associates. 4 Other authors have used different data. In addition, various authors have used data from differing time periods, often using different model specifications.
In an effort to make sense of the often conflicting results and to untangle the effects of data versus specification, we compare several modeling approaches using the same data set. We use data from the Washington State Employment Security Department (ESD), merged with data from the state Department of Revenue (DOR). The DOR data cover all 706,477 firms that operated in Washington State from 2004 through 2010, for a total of 2,445,050 firm-year observations. For each year during which a firm operated, the data file provides information on the firm’s North American Industry Classification System (NAICS) code, average number of employees, payroll, the date on which the firm opened or closed an account with DOR, and the various taxes paid by the firm. The ESD file provides a listing of each establishment in the state and the county in which it is located. We merged the DOR and ESD data using the Uniform Business Indicator, which allowed us to determine the number of establishments for each firm in each county. Our merged data set initially contained 1,270,730 firm-year observations. After eliminating those having obvious coding errors and other inexplicable anomalies, 5 we are left with 1,004,037 observations on 234,257 firms. Of these, 37,261 firms are observed only once during the 7-year period so that changes in employment are impossible to calculate, and others have missing data on key variables used in the analysis. This leaves 761,787 observations on 195,798 firms in our final estimation sample.
To review the differing claims about the importance of firm characteristics and other factors in job growth, we estimate a variety of model specifications used in the literature. For the dependent variable, we use three different measures of growth. First, we estimate a series of models using the percentage change in employment. Haltiwanger et al. (2010) have pointed out that using the previous year’s employment as the base for calculating the percentage change results in a bias due to reversion toward the mean. Hence, following their recommendation, we calculate the year-to-year percentage change in employment using the average of the 2 years. Specifically, letting Yt and Yt−1 be current and lagged employment, respectively, the percentage change in employment (pctdempavg) is defined as:

One objection to the use of the growth rate of employment as the dependent variable is that from an economic development perspective, planners might be more interested in the number of jobs created. Hence, we estimate a second specification using the firm’s change in employment from year to year, which is simply:

Acs et al. (2008) noted that measuring growth in terms of percentage change necessarily biases the results toward smaller firms, whereas measuring growth in absolute terms would favor larger firms. They proposed a measure of firm growth that they called the “employment growth quantifier” (EGQ), which is the product of the absolute and percentage change in employment. We define this as:

To avoid imposing an arbitrary functional form on the relationship between growth and age or size, we regress the growth rate on a set of dummy variables that indicate the firm’s size and age. We estimate all models by ordinary least squares to be consistent with the standard approach in this literature.
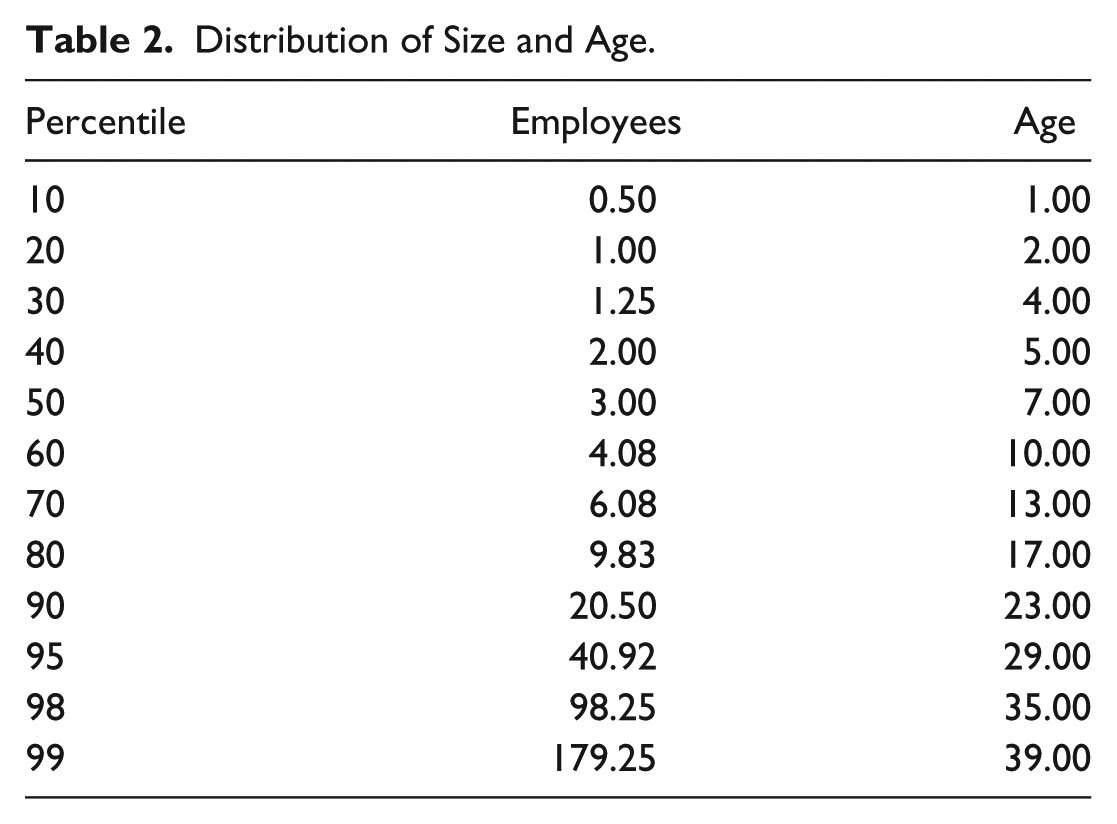
Table 1 provides summary statistics for all variables used in the analysis. It is not surprising that employment fell overall by 2%, given the severity of the recession in the past 3 years of the sample period. The average size of firms in the sample is about 16 employees and the average age is 11 years. These means, however, belie the highly skewed distributions of size and age for which percentiles are given in Table 2. Most firms are less than 7 years old and have three or fewer employees. This raises the possibility that results might be sensitive to a few influential observations in the upper tails of the distributions. The use of dummy variables for size and age classes mitigates this concern. The variables size1 through size10 are defined in Table 1, and conform to the definitions used by the U.S. Bureau of Labor Statistics and the Washington State DOR.
Summary Statistics.
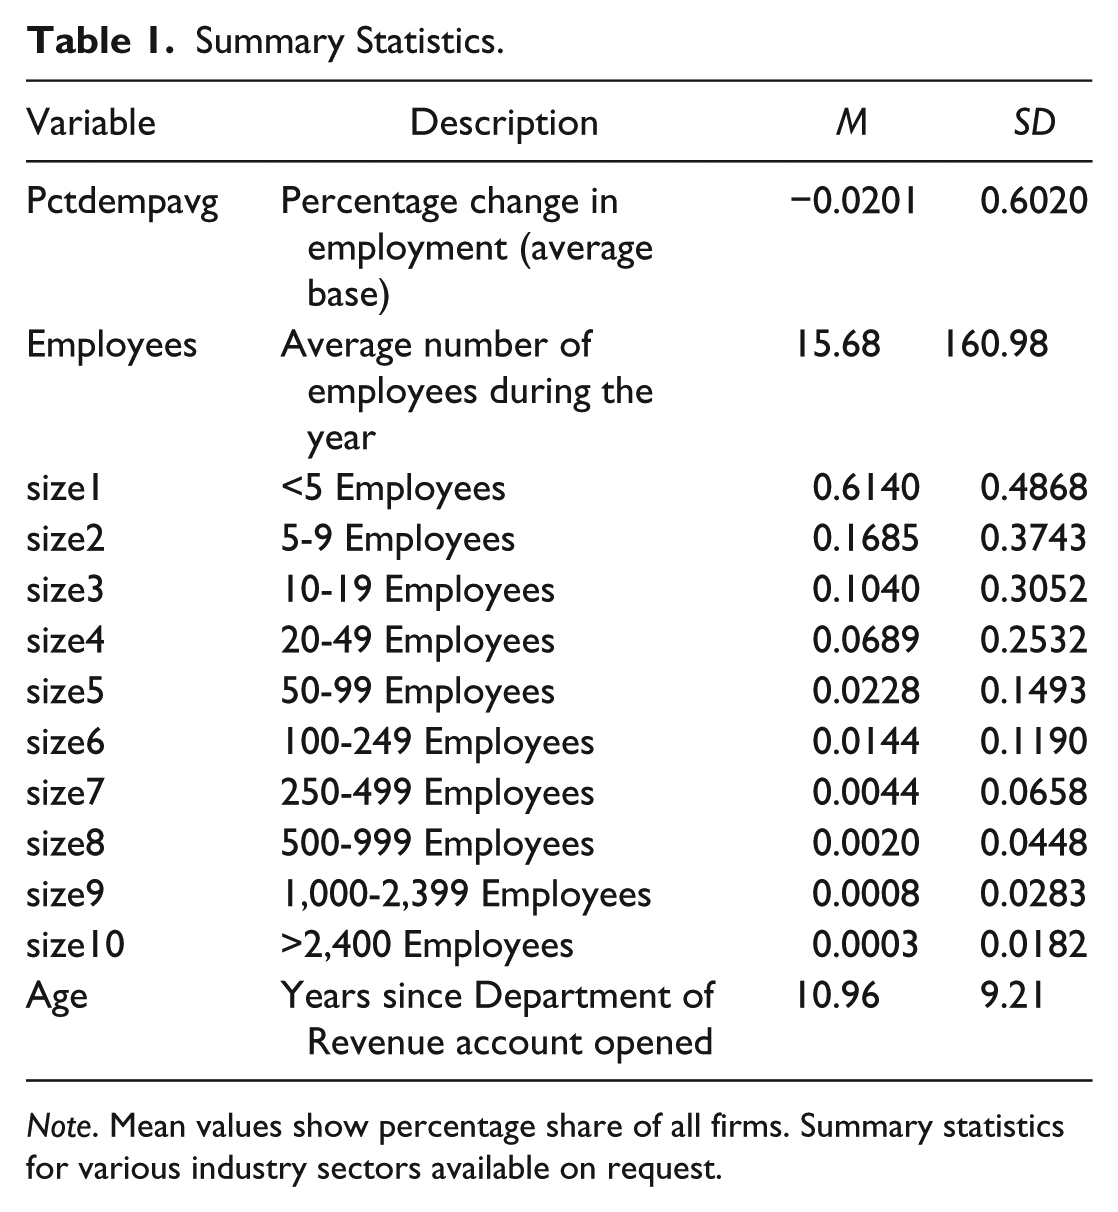
Note. Mean values show percentage share of all firms. Summary statistics for various industry sectors available on request.
Distribution of Size and Age.
Findings
Our primary findings are that (a) you can tease most any result out of the models by manipulating the model specification and (b) too much emphasis is given to firm characteristics in discussions about firm growth.
Tables 3 to 7 report the results of regressions using the different specifications of employment growth. In Table 3, the variable age00 identifies firms less than 1-year-old, age01 represents firms 1 to 2 years old, and so forth. 6 One of the most obvious conclusions from these results is that size matters—but only for the smallest firms. The coefficients on the size dummies in Table 3 indicate the difference between the growth rate for each size class relative to the omitted size class 10, which grew at 3.8% annually over the full sample period. Thus, the smallest firms grew by 11.8% less than this for an overall decline of 8%. The growth rates of firms in other size classes were not significantly different than that of firms in the largest group. The decline in employment in the smallest firms appears to be due entirely to their poor performance during the post-2007 recession period (during which the largest firms grew at a 7.2% annual rate). During the pre-2008 period, these smallest firms performed no better or no worse than other firms (the largest of which grew at 0.1%). The takeaway message seems to be that the smallest firms appear to be most vulnerable to economic downturns.
Dependent Variable: Percentage Growth Rate of Employees.
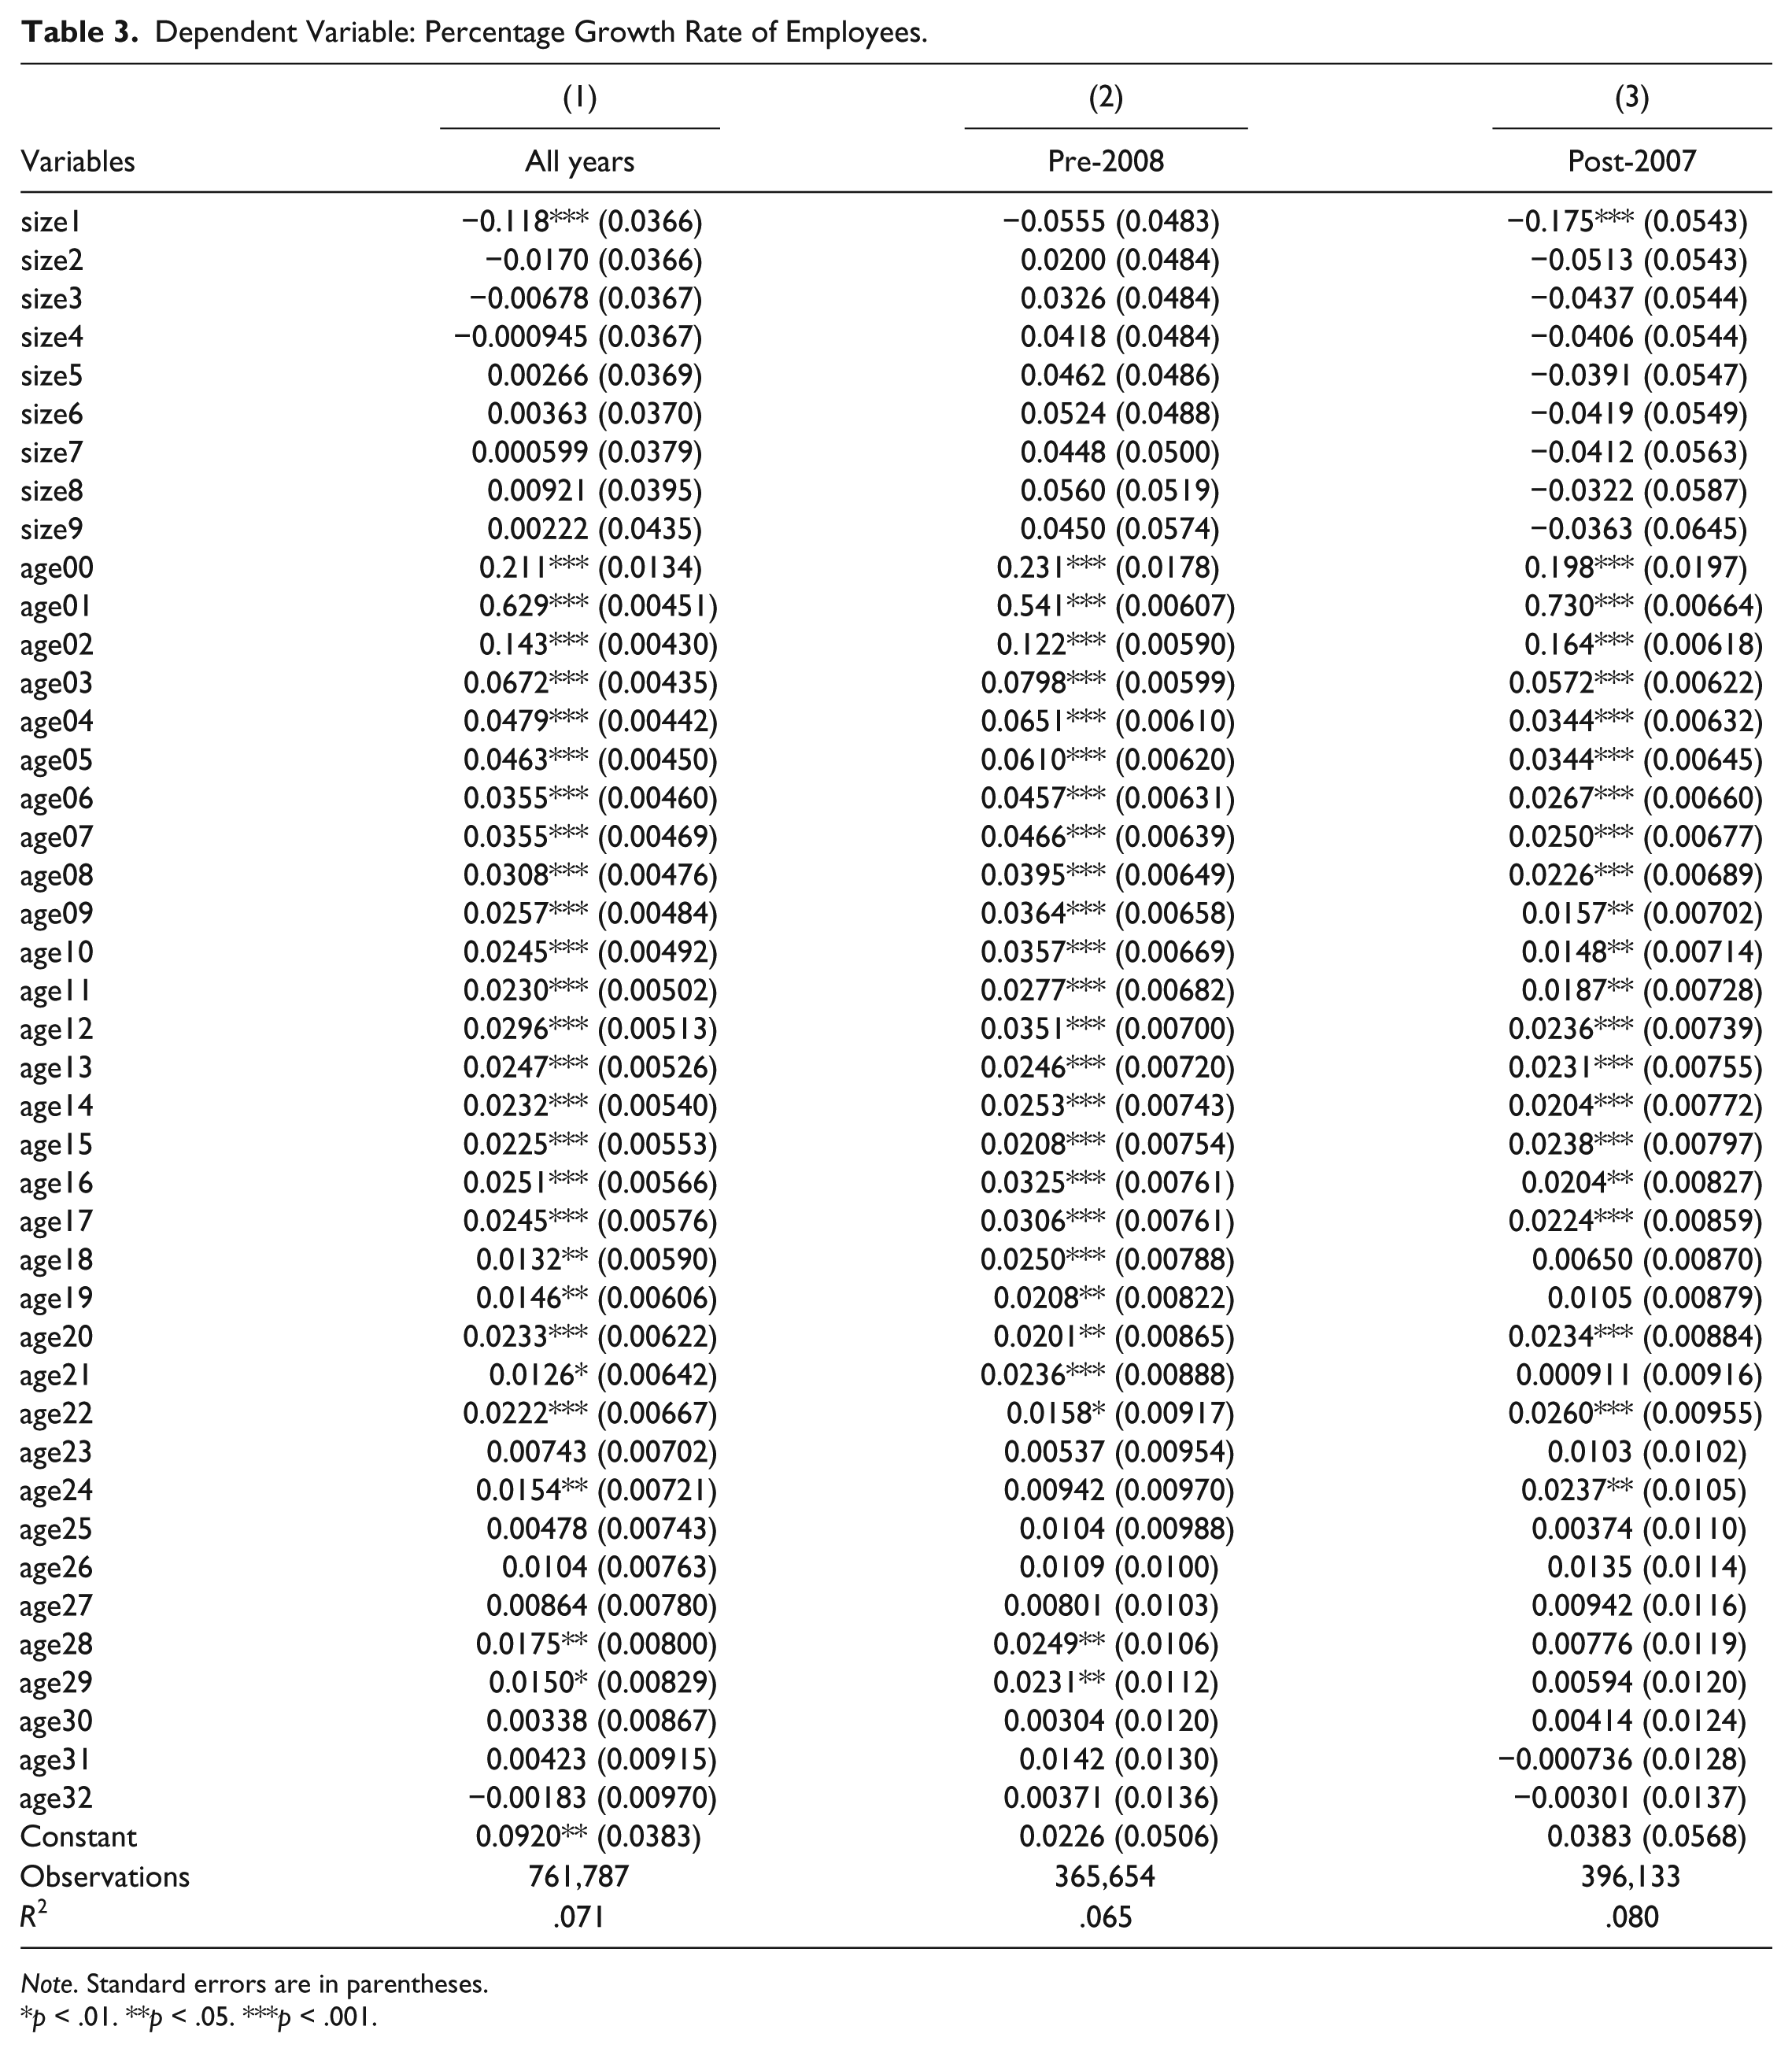
Note. Standard errors are in parentheses.
p < .01. **p < .05. ***p < .001.
Dependent Variable: Change in Number of Employees.
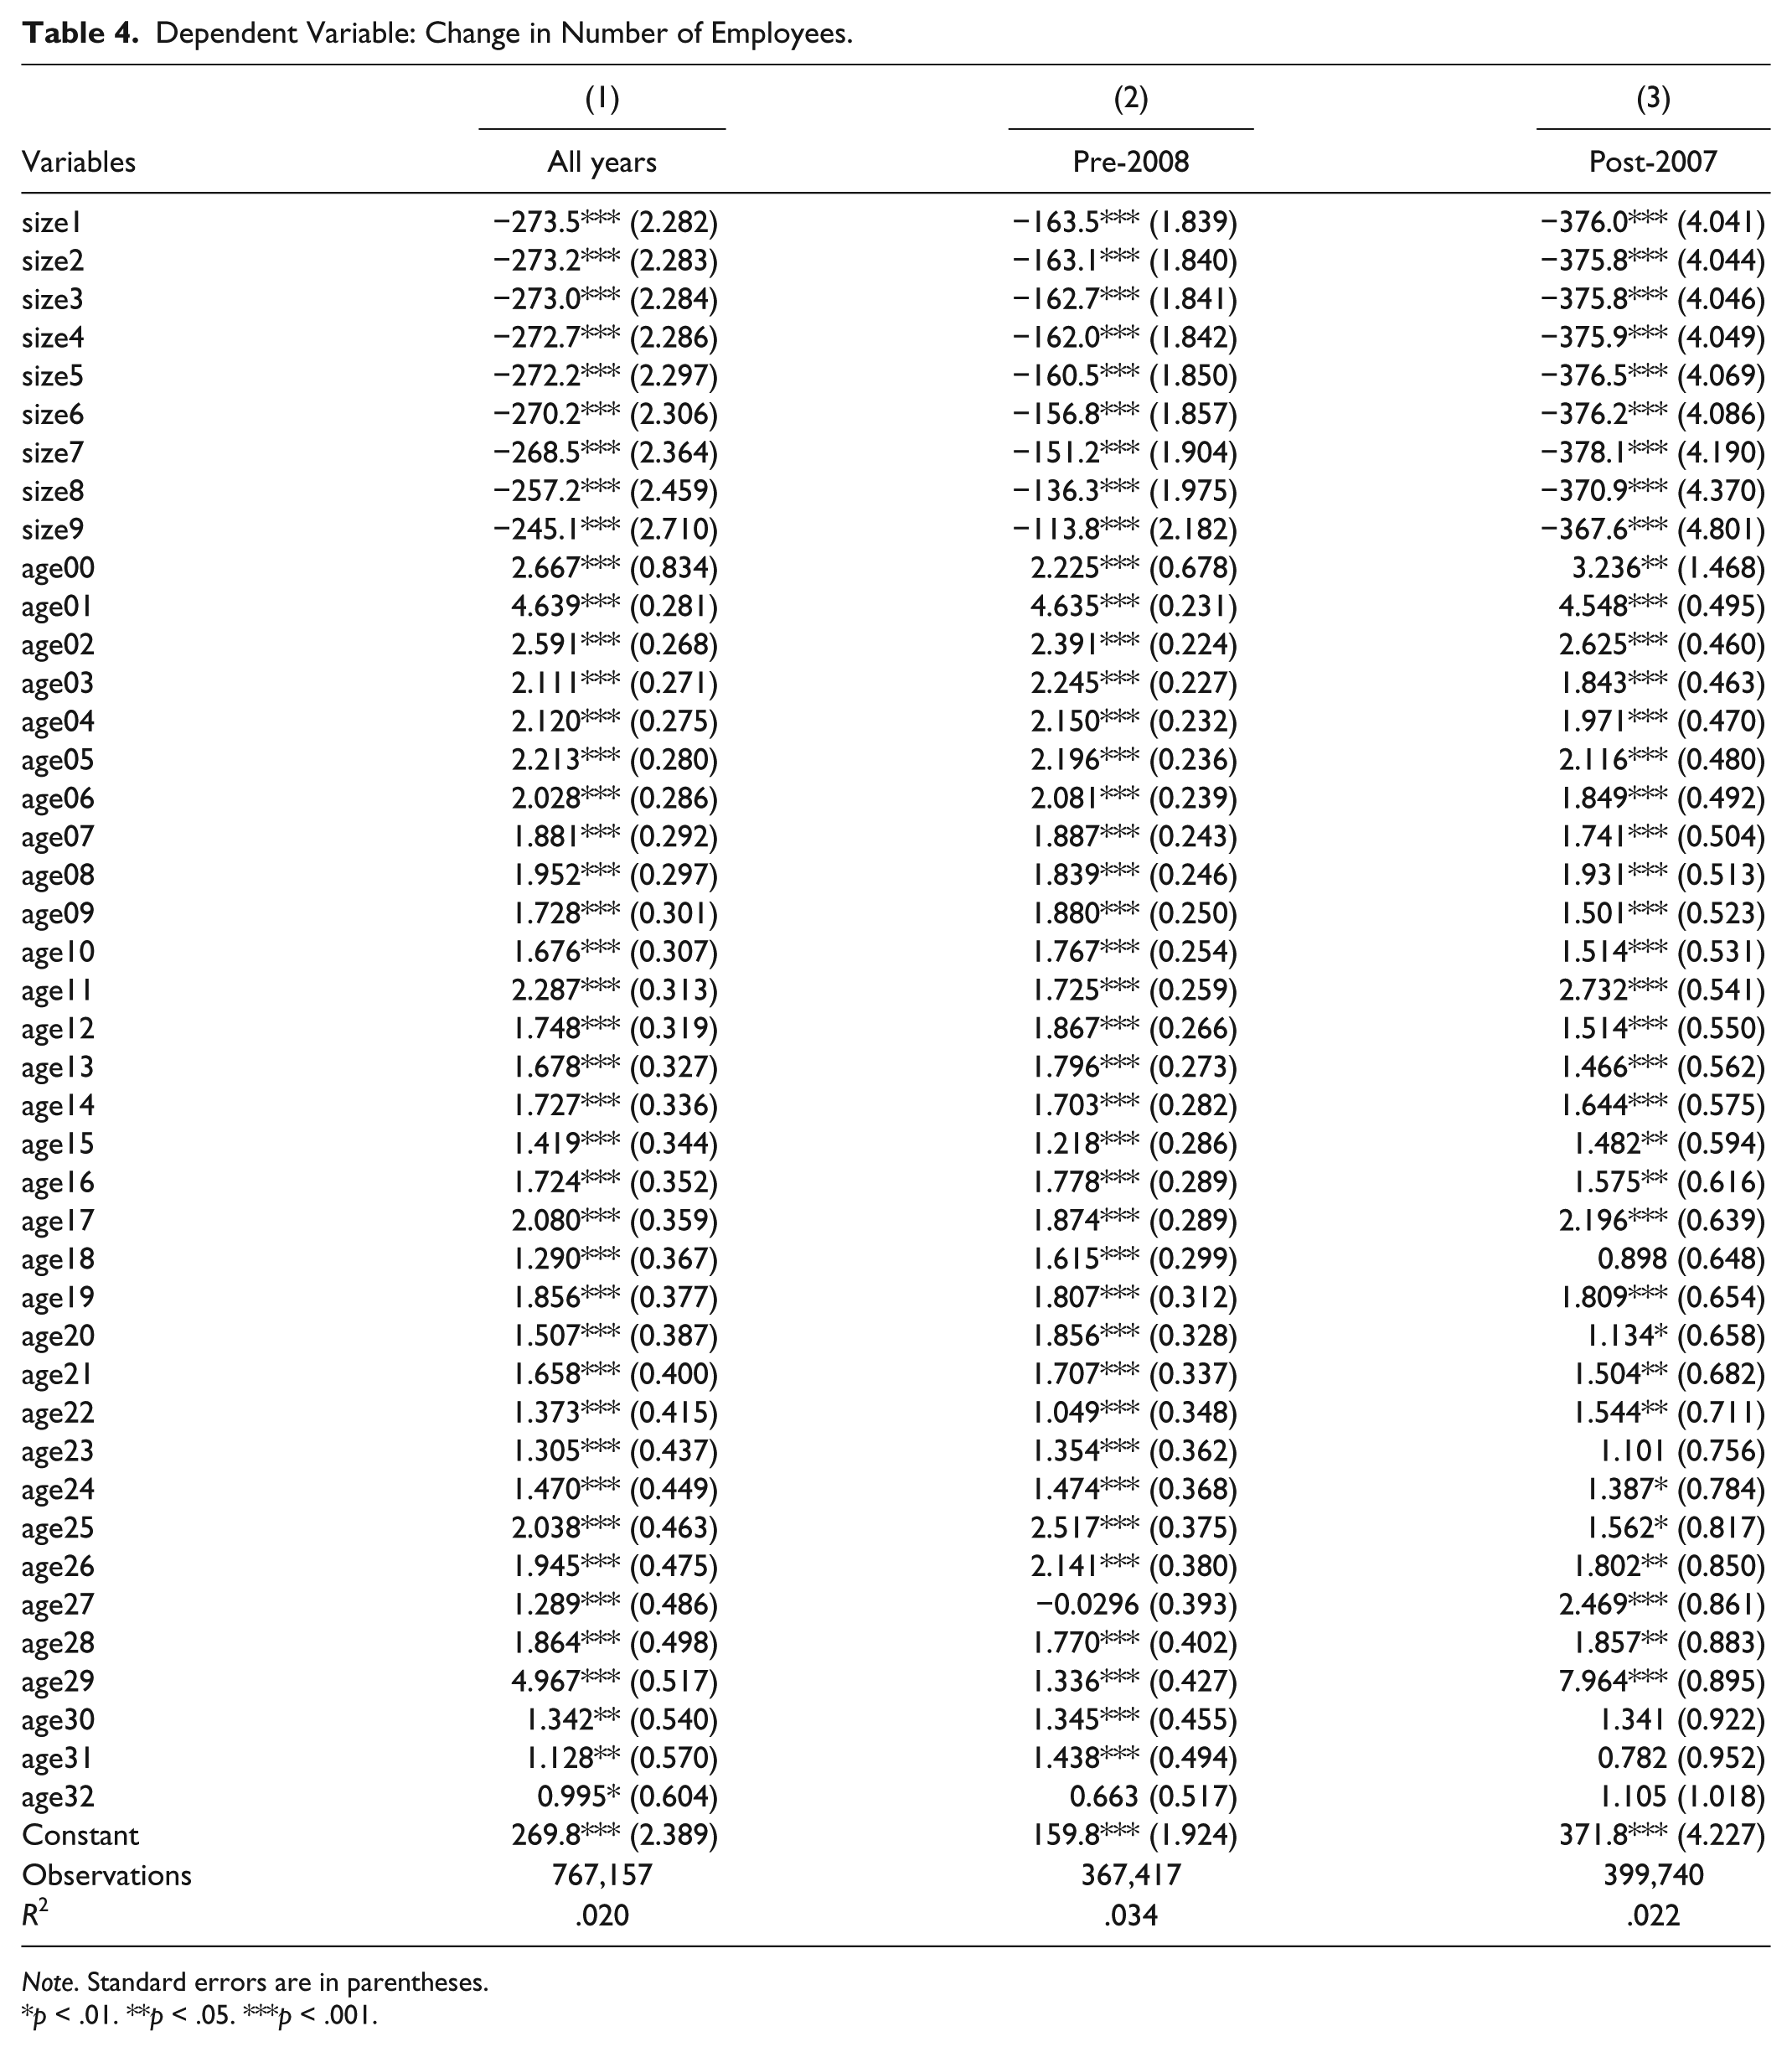
Note. Standard errors are in parentheses.
p < .01. **p < .05. ***p < .001.
Dependent Variable: Acs et al. (2008) Employment Growth Quantifier.
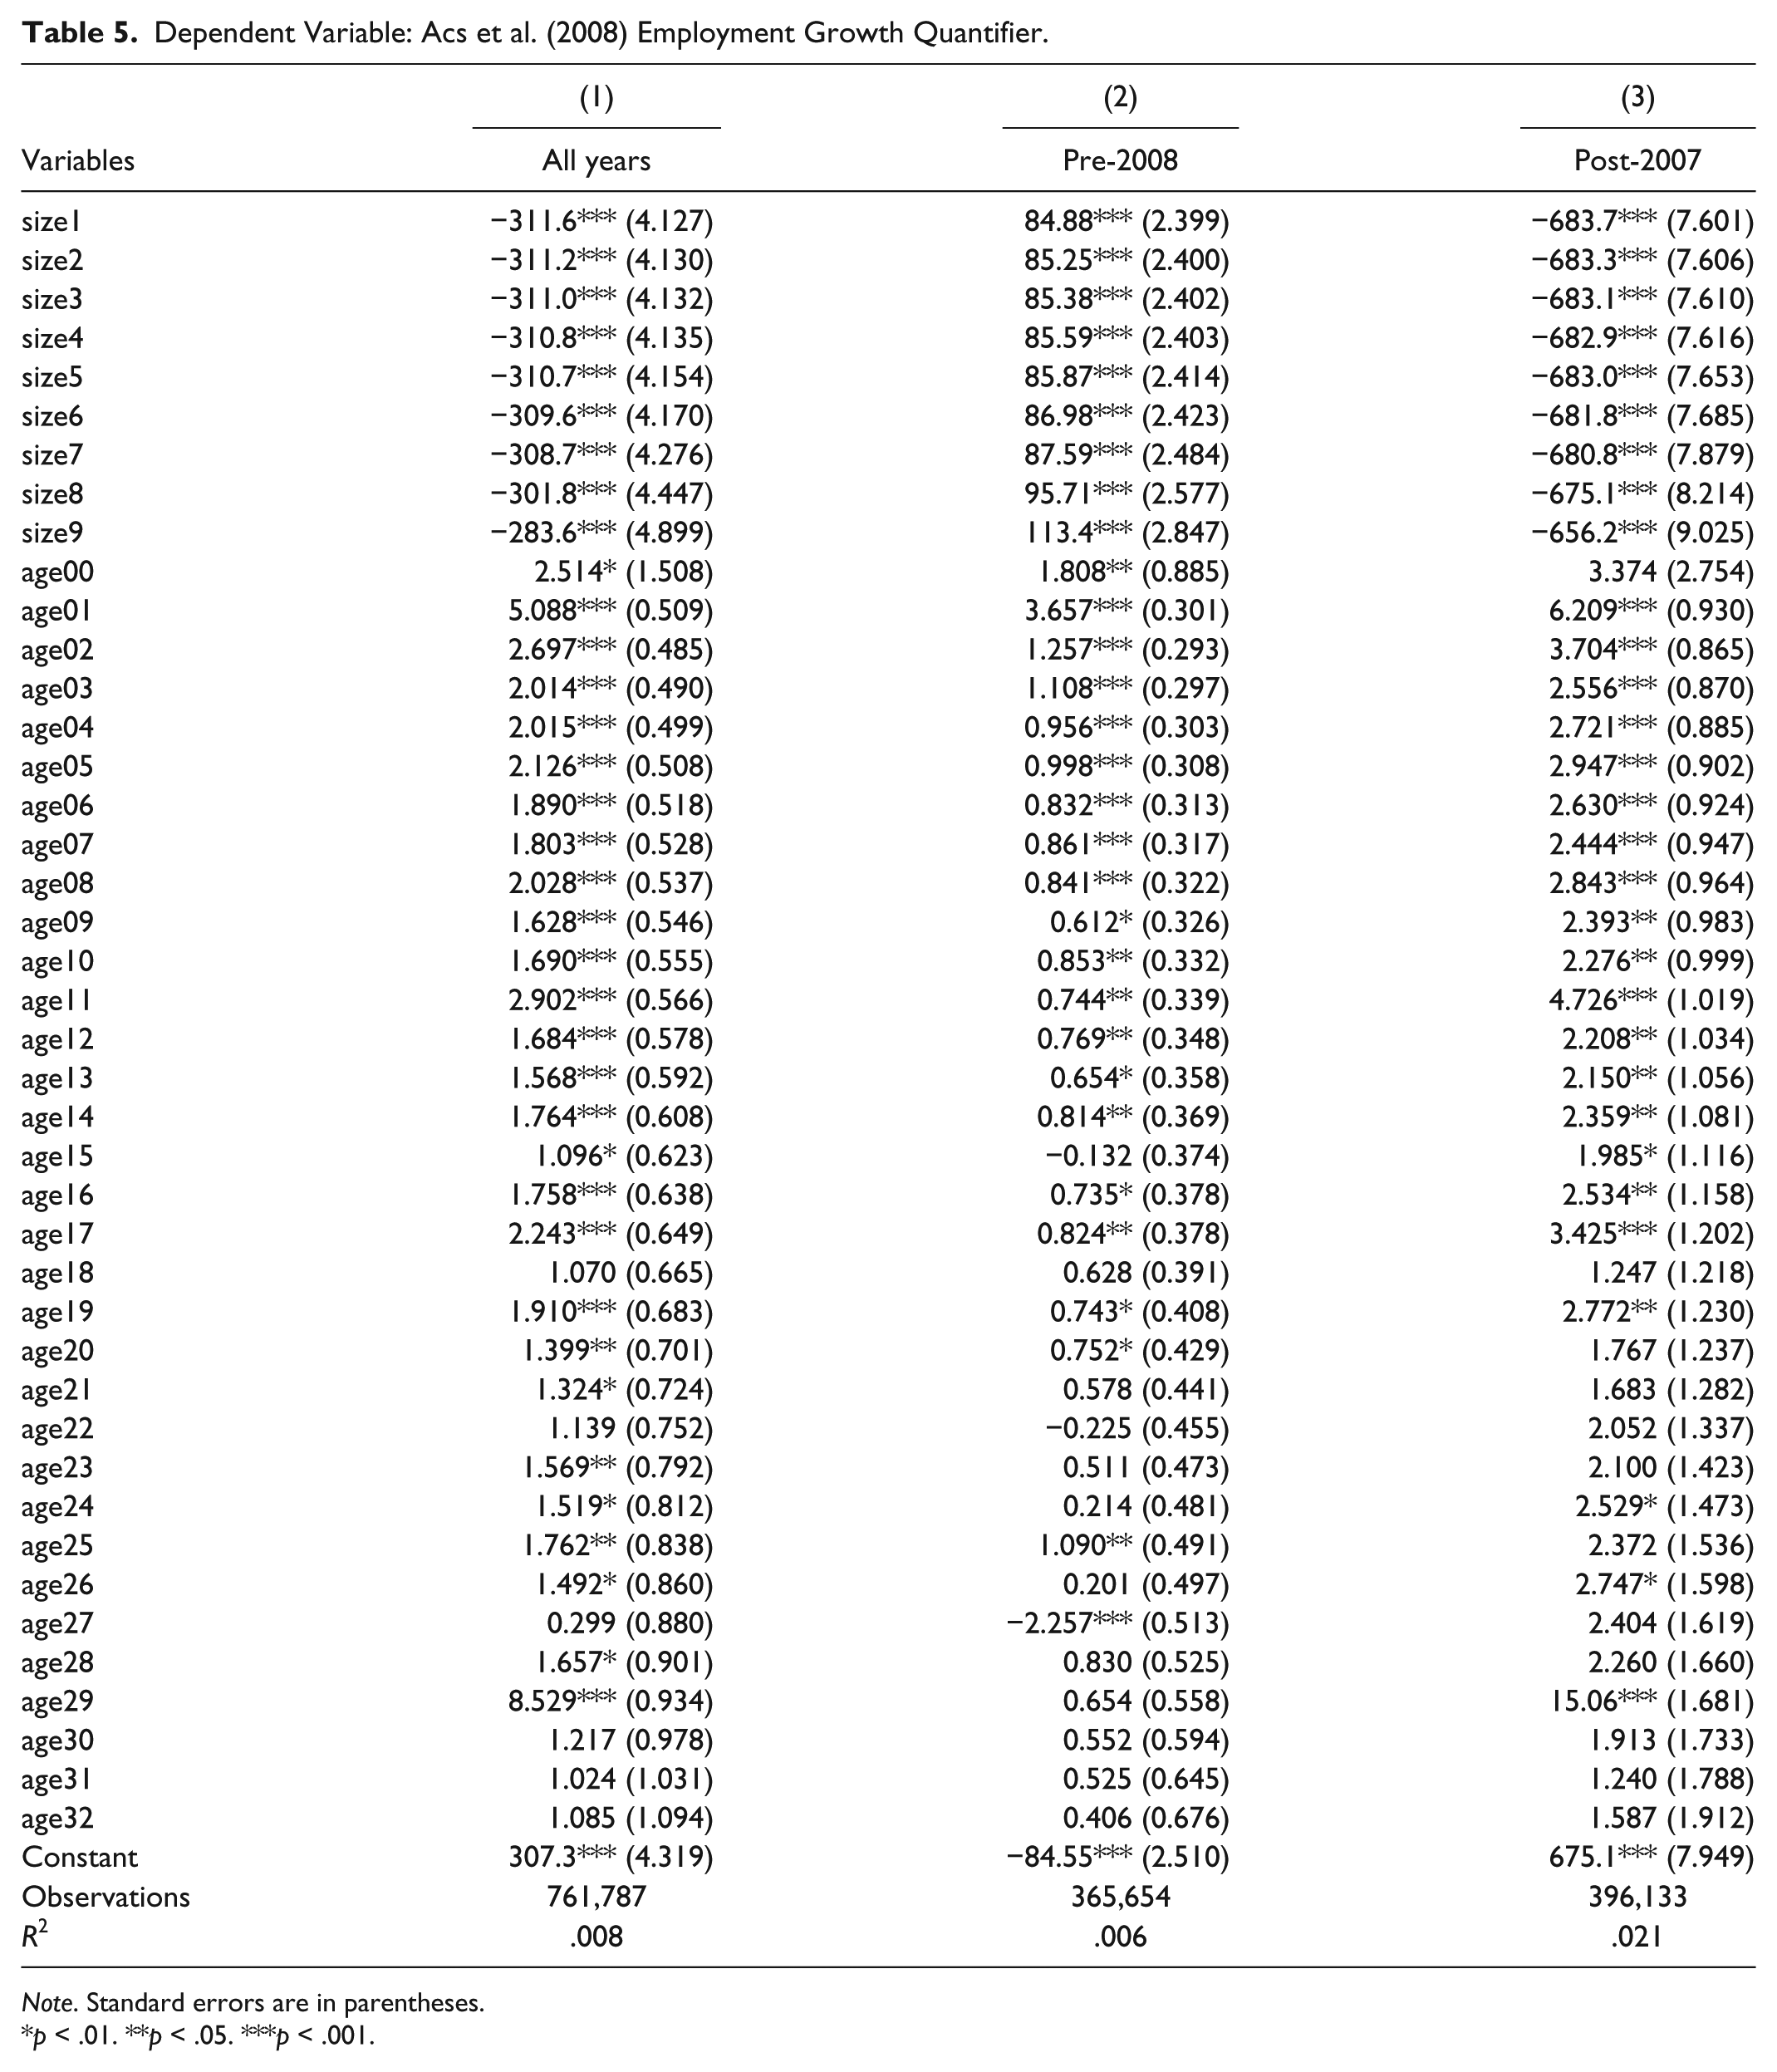
Note. Standard errors are in parentheses.
p < .01. **p < .05. ***p < .001.
Dependent Variable: Percentage Growth Rate of Employees.
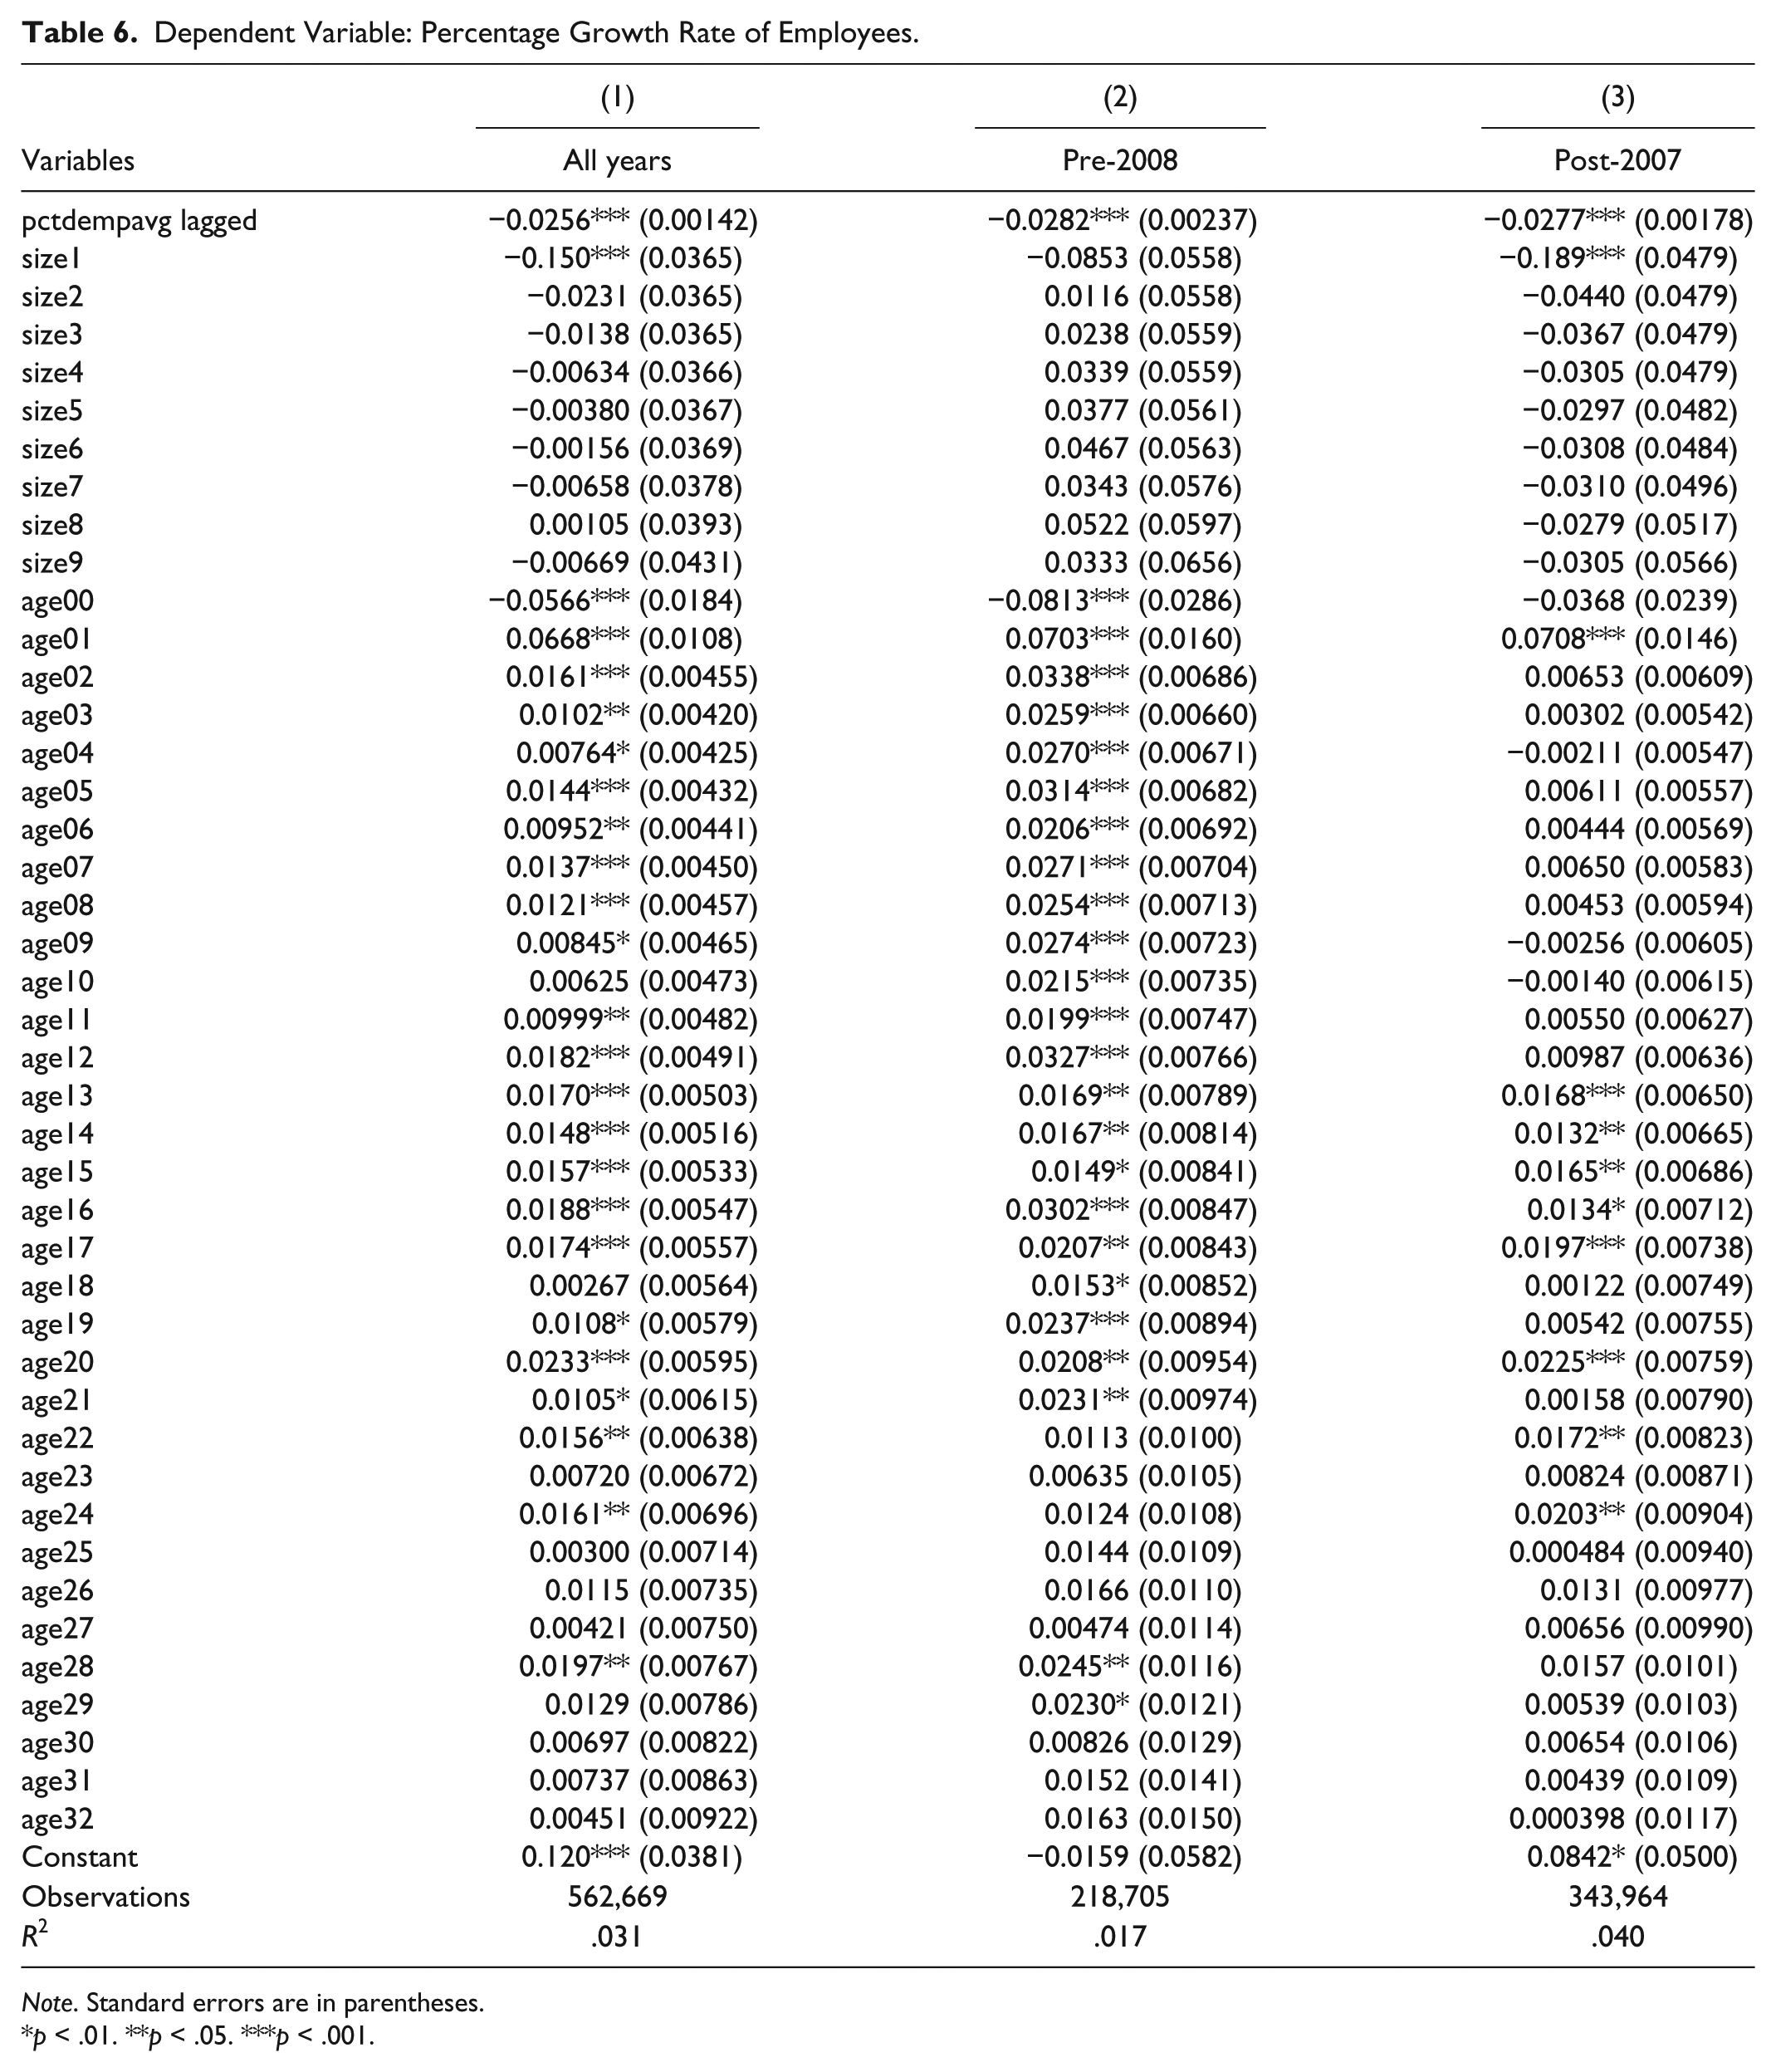
Note. Standard errors are in parentheses.
p < .01. **p < .05. ***p < .001.
Dependent Variable: Percentage Growth Rate of Employees.
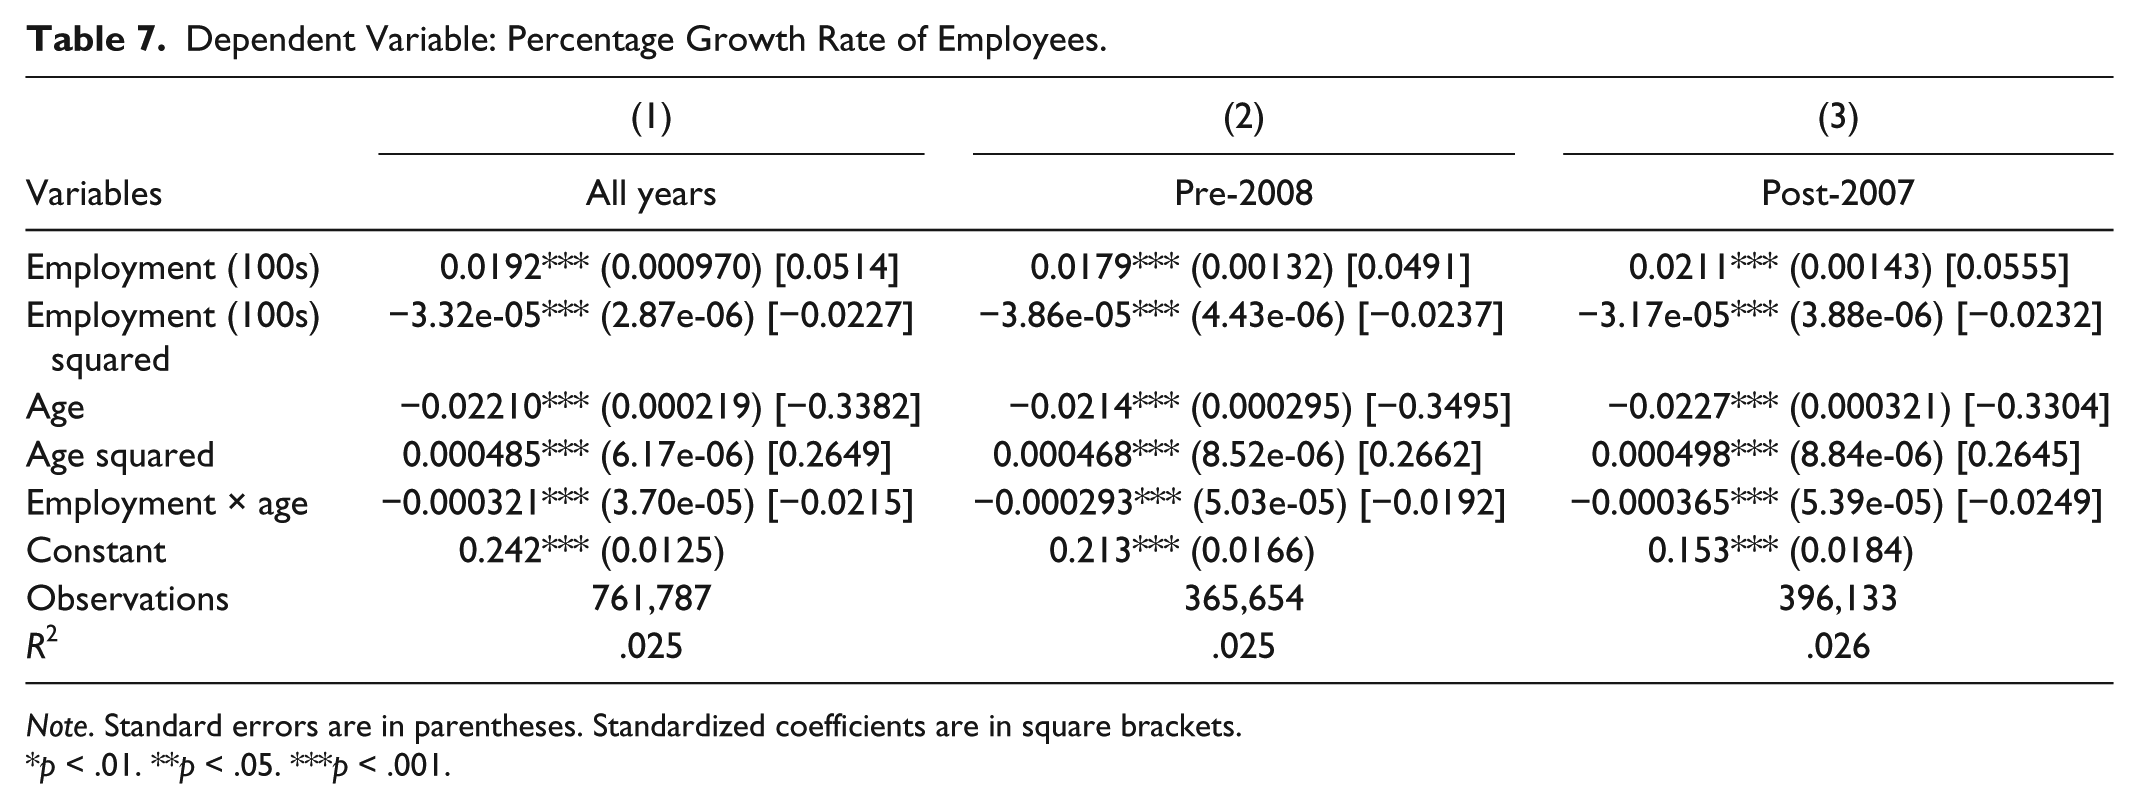
Note. Standard errors are in parentheses. Standardized coefficients are in square brackets.
p < .01. **p < .05. ***p < .001.
Turning to firm age, an interesting pattern emerges. The coefficients on the age dummies indicate the growth rates of firms relative to the growth rate in the omitted category (firms over 32 years of age), which on average grew at a rate of −6.7% over the full sample period. Compared with these oldest firms, those less than a year old grew 21.1% faster or 14.4% annually. Firms in the 1- to 2-year age category grew fastest. After that, the effect of age drops rather quickly until age 3 to 4 (age class 3), which grew 6.72% faster than the reference group (or a real rate of zero), and then becomes statistically no different than the oldest firms at about age 23. This pattern is similar during the pre-2008 and post-2007 periods, during which the largest firms grew by −4.5% and −8.4%, respectively.
We examined the impacts on growth of firm size and age for firms in certain selected industries: manufacturing, health care, retail, and lodging and food. In manufacturing, firms of all sizes experienced larger percentage employment declines than the largest firms because of the post-2007 recession. The effects of age are similar here to those for all firms: peaking at about 1 to 2 years and then declining until about ages 10 to 12. In health care, only the smallest firms grew less rapidly than the largest ones over the entire sample period, but firms in all size classes grew less rapidly than the largest ones during the recession (when the largest firms grew at a 28.4% annual rate). In retail and in lodging and food, size does not matter. Across the board, what is important is age but only for the youngest firms: those that are 1 to 2 years old grow most rapidly, after which the effect of age declines fairly quickly.
These results largely agree with those of Haltiwanger et al. (2010) and Haltiwanger (2011). In particular, we find that firm age explains more of the growth than other factors. Firm size is statistically significant in some cases, but is dominated by age.
Alternative Specifications of Firm Growth
Table 4 replicates the regression from Table 3, using the change in employment as the dependent variable rather than the percentage rate of change. The mean changes in employment for the omitted size class 10 for the full sample, pre-2008, and post-2007 periods are 272.3, 162.5, and 374.6, respectively. Hence, Table 4 suggests that the growth in the number of employees was significantly larger for the largest firms than for those in all other size classes, across which the changes in employment were fairly similar. In sharp contrast with Table 3, here, size matters only for the largest firms rather than for the smallest.
Results using the Acs et al. (2008) EGQ as the dependent variable are shown in Table 5 and are generally similar to those in Table 4, with the exception of the pre-2008 subsample. This can perhaps be understood by noting that variation in the numerical change in employment is likely to be large relative to the variation in the percentage change in employment (expressed as a decimal). Hence, variation in EGQ is due more to variation in the former than in the latter. In fact, the correlation between egq and demp is .938 for the entire sample period and .966 for the post-2007 subsample, but drops to .772 for the pre-2008 period. The correlation between egq and pctdempavg is .058 and .052 in the full and post-2007 samples, respectively, and .107 in the pre-2008 period. Given the difficulty of assigning any economically meaningful interpretation to the egq variable, it is difficult to understand the significance of these results or the usefulness of this variable as a measure of firm growth.
Persistence of Growth
In Table 6, we use the percentage growth rate of employment as the dependent variable and include the percentage change of employment growth in the prior year to measure the persistence of growth. The idea is that if growth is sustained, we would find a positive coefficient on lagged growth; if, on the other hand, the changes in employment growth are random, we would expect to see a negative coefficient on the lagged growth rate because of reversion toward the mean. The estimated coefficient on the lagged percentage growth rate is negative, suggesting mean reversion. Beyond this, the effects of size and age are similar to those in Table 3: Size matters only for the smallest firms and only during the contractionary period, and age has an impact that is positive for the youngest firms and then quickly declines. This finding reminds us of the comments by Edmiston (2007): Young firms can result in a lot of churning, or job creation and dislocations at the same time.
Size–Age Interactions
Finally, while the use of size- and age-specific dummy variables is flexible in that it does not impose any assumptions about functional form, it does not allow us to easily examine the question of whether there is an interaction between size and age. This would require a large number of interaction terms and the results would be difficult to interpret. As a quick check of the possibility of such interaction, we estimate a model in which the percentage rate of firm growth is a function of size and age, their squares, and the product of size times age. This can be thought of as a second-order Taylor series approximation to some unknown functional form. Results are given in Table 7. Defining emp100s to be employment measured in hundreds, the partial effects of size and age, respectively, are:
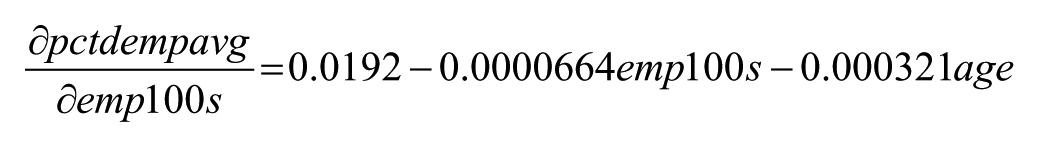
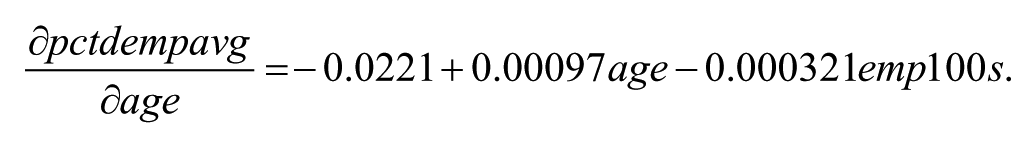
The effect of size on firm growth is positive for the smallest firms and declines, but slowly, as the firm grows in size and ages. The effect of age is negative for the youngest firms but becomes less negative up to about 23 years of age. Given the mean age of 10.96 and the mean of emp100s of 0.1568, the second-order effects of size and age are numerically small.
Table 7 also reports beta coefficients for each of the explanatory variables. The beta coefficient on emp100s indicates that a 1 standard deviation increase in firm size will be associated with an increase in the growth rate of about 0.05 standard deviations. Similarly, an increase in age of 1 standard deviation will be associated with a decrease in the growth rate of about 0.34 standard deviations. In this sense, one could conclude that firms’ growth rates are more closely related to their age than to their size. This conclusion should be viewed with caution, however, given the nonlinearity in the effects of size and age that are evident in specifications that use dummy variables as in Table 3.
Conclusions and Policy Implications
In summary, our results are consistent with most of the findings in the literature. In fact, results are very sensitive to model specification. You really can “get anything you want,” depending on how you define growth and what model specification you choose. This raises the concern that being able to support anything is a bit of a problem when it comes to designing good policy, given the lack of theoretical guidance regarding model specification. On the other hand, planners and government officials with particular agendas to promote can easily find something in the literature to support their favorite causes.
Moreover, there is an important question as to how much of firm growth is really explained by the models. We have focused specifically on the role of firm age and size in explaining firm growth, but beyond the size, sign, and statistical significance of regression coefficients, there are two very important issues. First, there is little in the way of economic theory to help us decide how growth should be measured, what variables we should consider when trying to explain growth, and what sort of interaction between those variables might be important. Second, we need to keep in mind the very limited explanatory power of the models. None of our models explain more than 15% of the variation in job growth. Economic development policies that target firms of any particular size or age are unlikely to have much impact on job growth, if any, given that at least 85% of variation in employment growth is explained by other factors. Discussions between policy analysts or policy makers and economists conducting the sorts of analyses cited here are too limited. Much more discussion is needed about what sorts of policy positions the research can really support.
Florida (2012) highlighted problems with economic development incentives, such as providing tax incentives to attract a firm to a particular location. Such incentives can be expensive and are often not very effective. Researchers in Washington State are also questioning the net value of export assistance. We see similar problems with efforts to promote economic development based on the characteristics of firms, such as their age or size. The ideas sound appealing, but lack any solid empirical or theoretical foundation.
For example, the state of Washington has a variety of job creation programs that rely on ideas about which industry sectors are likely to grow in the future, as well as ideas about the importance of firm age or size. The state requires that workforce development councils in different parts of the state focus on specific industry clusters that the state believes will help promote “family wage jobs.” Grants and subsidies are also available for programs to assist start-ups and small firms, including free consulting services for certain small businesses. Indeed, the person who helped us get the data-sharing agreement for the data used in this study told us that the state was very interested in confirming the important role that small businesses play in creating new jobs. 7 And the legacy of David Birch dies hard. Maria Cantwell (2014), a U.S. Senator from Washington State, echoes the sentiments of countless other politicians when she notes on her website that “Small businesses are the growth engine that drives our economy. . . . ”
The data simply do not exist to support these programs or positions. When articles are cited, there is no attempt to understand the limits of the modeling efforts in the articles—or even to recognize the caveats when they are provided in the articles. Ideas put forth in one article about the importance of firm age or size in the job creation process almost certainly depend critically on how growth is measured, and may not be meaningful if other factors are considered. Still, we spend the money on the programs. Surely, more dialogue is needed between economists and economic development practitioners and policy makers.
It may make sense for economic development practitioners to focus first on trying to address market failures before trying to promote particular types of businesses. For example, reducing barriers to entry, investing in infrastructure, and improving information flows may be more productive than trying to “pick winners.” Still, we know practitioners and funders will face pressures to act—to enact policies and programs that highlight particular types of businesses, that emphasize specific sectors, or that focus on particular clusters. In those cases, we recommend that they look for a clear description of the strengths and weaknesses of the data, a summary of the underlying economic theory, a restatement of the question being addressed, and a clear connection between the supporting analysis and the driving question.
We also offer a few reminders related to these key points. First, firms may operate in several different industry sectors, but might report all employment in one sector or under one NAICS code. Similarly, firms may report employment by the location of workers in different establishments—in different locations—or by where paychecks were prepared—perhaps all in the same location. The data do not always show what you might expect and may not support particular policy positions. Second, an analytical exploration may show that young businesses can generate a large share of jobs, but it does not follow automatically that economic development policies are likely to be effective and generate more jobs if they target young firms. Caution is in order when relying on statistical explorations to guide policy. Third, an important challenge for practitioners and funders is to be skeptical. Political expediency invites the acceptance of a new narrative if an old one is found to be lacking much more than it invites careful analysis. Moreover, advocates for a particular position probably already know what they want to know, increasing the need for others to be analytical and/or skeptical (avoiding group think problems).
In short, analytical explorations and other work may be interesting, but should not be used to support economic development policies or programs unless their limitations and qualifications have been carefully considered.
Footnotes
Declaration of Conflicting Interests
The author(s) declared no potential conflicts of interest with respect to the research, authorship, and/or publication of this article.
Funding
The author(s) received no financial support for the research, authorship, and/or publication of this article.