
Abstract
The use of tax increment financing (TIF) remains a popular, yet highly controversial, tool among policy makers in their efforts to promote economic development. This study conducts a comprehensive assessment of the effectiveness of Missouri’s TIF program, specifically in Kansas City and St. Louis, in creating economic opportunities. We build a time-series data set starting 1990 through 2012 of detailed employment levels, establishment counts, and sales at the census block-group level to run a set of difference-in-differences with matching estimates for the impact of TIF at the local level. Although we analyze the impact of TIF on a wide set of indicators and across various industry sectors, we find no conclusive evidence that the TIF program in either city has a causal impact on key economic development indicators.
Introduction
Over the past 30 years, local economic development planners have developed a broad set of tools aimed at attracting new business investment or promoting redevelopment in underserved neighborhoods. These tools, such as tax incentives, infrastructure subsidies, empowerment zones, and targeted grant and job training subsidies, are widely used throughout the United States and increasingly in the United Kingdom and elsewhere (see Fitzgerald & Green-Leigh, 2002; Green-Leigh & Blakely, 2016). There is also evidence that incentive use is on the rise after the Great Recession (Warner & Zheng, 2011). What unites these various policies is the fact that public tax dollars are shifted to private entities (typically businesses or real estate developers). With a 60-year history of usage and enabling legislation passed in all 50 states, tax increment financing (TIF) has become one of most common forms of local public incentive tools. Although the details differ from place to place, the basic structure of TIF involves the freezing of assessed property values in a designated zone or parcel and dedicating any future value growth—typically generated by some kind of planned redevelopment project—to offset the costs of the initial private investment. 1
In some states, such as Missouri, TIFs can also help directly subsidize private development expenses in addition to more traditional uses such as paying for infrastructure improvements or planning expenses. On one hand, proponents of TIF argue that projects funded under the program stimulate investment while “paying for themselves.” On the other hand, TIF remains highly controversial because TIF can tie up property tax revenue for decades and divert resources from overlapping jurisdictions such as school districts, worsening the deep fiscal challenges that many jurisdictions face. Thus, we need to carefully analyze whether TIFs actually create the jobs and business growth their proponents promise. To do so, we must attempt to answer the classic “but for” test, meaning that the growth in valuation would not have occurred “but for” the adoption of TIF. The determination of the “but for” test requirement is typically made through an affidavit by the proposed developer along with the redevelopment plan. 2 The central objective of this study is, therefore, to assess the effectiveness of TIF and estimate its impact on employment and sales, and its ability to attract new businesses.
We focus our analysis of the “but for” test on two cities in the state of Missouri, specifically examining the cases of Kansas City and St. Louis for the study period of 1990 through 2012. These cities present ideal cases to study the effectiveness of TIF since, like Chicago, TIF is so commonly used there. Unlike Chicago, where TIF has been widely studied (Lester, 2014; Weber, Bhatta, & Merriman, 2007), St. Louis and Kansas City have not experienced the same level of private investment and economic growth over the past two decades. Additionally, there is little empirical evidence to date to support the claim that these cities have contributed to overall regional economic growth in Missouri. In 2015, the Saint Louis University Center for Sustainability 3 published a descriptive study examining spatial patterns of economic and racial isolation to evaluate the impact TIF was having on patterns of neighborhood distress using data from 2000 to 2012. The study specifically examined the spatial distribution of a distress index by municipality to answer the question of whether the use of TIFs were driving investment to the more distressed communities in the region. We include both St. Louis and Kansas City in this study as they share the same state-level institutional framework, but present the analyses separately for three reasons: (1) Conducting the analyses separately allows policy makers to readily discern the results that correspond to their jurisdiction, (2) pooling Kansas City and St. Louis may obfuscate local-scale impacts, and (3) the two cities have not experienced the same level of private investment and economic growth over the past two decades. We build a time series data set of detailed employment levels and establishment counts and sales at the census block group 4 level to run a set of difference-in-differences estimates for the impact of TIF at the local level. 5 Specifically, we use propensity score matching to address the fact that TIF districts are not random but instead chosen because they were systematically different than those which did not. Census block groups are used as the geographic unit of analysis for two reasons. First, they are the smallest areal units for which the decennial U.S. Census Bureau reports socioeconomic control variables can be observed. TIF district geography is then overlaid onto the block groups. Second, block groups are a meaningful boundary in this context as they reflect the geographic incentive that policy makers face in approving TIF projects; namely, as discussed further in the next section, that the objective is to combat blight and stimulate economic development locally rather than at the municipal level. In addition, TIF is predicated on the idea that subsidizing certain developments within the TIF will lead to positive externalities that will catalyze further investment in the surrounding area. While the different structure of TIF in St. Louis versus Kansas City may be relevant, it is not necessarily true that implementing TIF at a project level diverts more funds to a particular location. Policy makers in St. Louis justify their use of TIF in part by arguing that subsidizing one development in a distressed area will catalyze further investment in nearby areas. Thus, using block groups as the unit of analysis would capture any potential localized spillover effects.
Although we analyze the impact of TIF on a wide set of indicators and across various industry sectors, we find no conclusive evidence that the TIF program in either city has a causal impact on key economic development indicators. This finding should be a caution to policy makers in similar slow growth regions that TIF is not a panacea and can result in highly regressive fiscal outcomes.
The next section provides an overview of how TIF works in each city, followed by a section reviewing some of the empirical literature on the impact of TIF and the specific research questions of this study. We then discuss the methodology followed by a discussion of the data construction steps. The main results are featured prior to a discussion of the robustness of the findings and the conclusions and policy recommendations.
TIF Background
The primary intent of TIF is to attract business, create and retain jobs, increase the tax base, and stimulate investment in areas where investment is either considered too risky or not likely to occur without some form of public support. Specifically, the City of St. Louis defines TIFs as “a development tool designed to help finance certain eligible improvements to property in designated redevelopment areas (TIF districts) by utilizing the new, or incremental, tax revenues generated by the project after completion.” 6 Specifically, Missouri statutes state that any area eligible for a TIF must be classified as a “blighted,” “conservation,” or “economic development” area. 7
Local governments agree to underwrite certain redevelopment project costs to attract new private development in a redevelopment area. The new tax revenue generated is then used to retire notes or bonds that were issued to pay for the redevelopment project costs. In general, TIF works by freezing real estate taxes at their current levels in taxing districts that fall within the redevelopment area were a TIF plan is adopted. The increased assessed valuation resulting from redevelopment, tax “increment,” is then used to directly pay for project costs or to retire any debt that was issued to pay for the project costs.
As described in Dye and Merriman (2000), Brueckner (2001), and Kane and Weber (2016), the effect on economic growth of TIF adoption is theoretically ambiguous. In other words, the adoption of a TIF district could lead to an increase, decrease, or no change in economic growth. On one hand, TIF districts should grow faster than they otherwise would have if TIFs correct for market failures that precluded private sector investment. The direct subsidy to developers should make it less costly to make investments in targeted areas that would lead to localized growth in employment and other outcomes. In addition, some argue that TIF subsidized development can act as a catalyst that can stimulate additional private investment and business activities in areas that have experienced economic decline. On the other hand, the adoption of TIFs could result in slower growth if resources are redistributed to address residential conditions related to blight. Alternatively, TIF could simply be used to subsidize economic activity that would have occurred anyway, thus having no causal effect.
Though both Kansas City and St. Louis are not unlike many of their peers nationally in their use of TIF, the regulatory settings in which they operate are unique. Missouri’s TIF statute allows for up to 50% of economic activity taxes to be diverted to a TIF, whereas other states restrict the revenue that may be diverted solely to the increase in property tax related to the TIF project or district. In defining the redevelopment plan, the municipality is responsible for the designation of the redevelopment area. The Missouri TIF Act permits different redevelopment projects within the redevelopment area (pursuant to the same redevelopment plan) to be undertaken, therefore the redevelopment area must contain a blighted area, a conservation area, an economic development area, or any combination thereof. In Kansas City, a total of 80 TIF districts were designated with the first project implemented in 1998. In St. Louis, the first TIF was designated in 1991 and there have been more than 160 TIF project implementations since. TIFs in St. Louis are implemented at a parcel level 8 whereas elsewhere, including Kansas City, TIFs are implemented at a district level. Implementing TIF at a parcel level could have the effect of diverting more funds to a particular location than if implanted at a district level.
Interest in the effectiveness of TIF, especially in the St. Louis region, is not new. Many have criticized the widespread use of TIF in St. Louis as “giving incentives to wealthy developers by taking away much-needed tax dollars for education and public safety” (Moffit, 2017) thereby creating “the potential for overuse and abuse of TIF” (Luce, 2003, p.5). These claims have nontrivial welfare implications, as freezing the property tax for the length of a TIF prevents the district from benefitting from increased revenue that would have been available if a non-TIF project had developed in the same period. Another related claim is that TIF is used to finance projects in high-tax-base suburban areas with little need for assistance in the competition for tax base. For example, only 9 of 33 of the St. Louis region TIF projects lie in the region’s core (Luce, 2003). Others, pointing to a TIF approved in 2010 for the relocation of a Walmart on the same street two miles away, claim the tool encourages a retail shell game, simply shifting sales receipts around the region (Gillerman, 2010).
Literature Review
Since the use of TIFs by local governments has been both a popular and controversial economic development tool, it has received significant attention in the academic literature of economics, public policy, planning, and geography. This section briefly summarizes the most salient studies to contextualize the empirical work conducted in this study. This study focuses only on quantitative research that analyzes the impact of TIF on economic development outcomes. While most studies researched the effect of TIF designation itself (i.e., whether a parcel falls inside or outside a TIF district), a few also included data on actual spending within the TIF. This is an aspect that is retained in the empirical work proposed in the methodology section.
An important part of answering the “but for” question for TIF lies in determining which municipalities are choosing to offer TIF and which districts are being designated for TIF. Greenbaum and Landers (2014), in a nationwide study of 424 municipal and county governments, found that local governments that adopted TIF tended to be municipalities rather than county governments, and also tended to be larger, have lower average personal income, and not be within in a central city.
Empirical Literature on TIF and Economic Development
First raised by Anderson (1990), most articles that analyze TIF impact do not explicitly address the problem of endogeneity with regard to TIF designation. Specifically, since most TIF legislation requires that districts be created in portions of the city that have experienced blight, it is possible that TIFs are only created in less-desirable areas that one would not expect to grow at the same rate as nonblighted sections. Alternatively, areas might be selected that are expected to grow faster, so more increment can be captured (Greenbaum & Landers, 2014). Of the articles that do address the selection issue, approaches such as instrumental variables, fixed effects, or the use of propensity score matching have been used. Smith (2009), for example, addressed the issue of selection bias with respect to TIF designation using propensity scores. He examined the impact of TIF on the change in individual commercial property values and predicted TIF assignment with a propensity score approach that controlled for neighborhood characteristics, such as poverty, unemployment, and housing values. This issue is potentially critical in attempting to answer the “but-for” question, in that comparisons between TIF districts and comparable non-TIF parts of the city are necessary. Smith’s results showed that the implicit price of commercial properties in TIF districts increases faster than properties that are not in TIF districts. Furthermore, the rates of change in real estate prices accelerates after TIF designation, even after controlling for the propensity of non-TIF areas to receive designation.
One of the few articles to directly examine the impact of TIF on job creation is Byrne (2010), which focused on the effect of TIF adoption on municipal employment growth in Illinois. Specifically, Byrne used a panel data set consisting of employment and TIF adoption dates at the municipal level and used a fixed-effect estimate approach 9 to assess the impact of TIF adoption. Overall, the findings suggested that TIF adoption, in general, does not lead to higher employment. However, Byrne does not adequately control for the issue of selection bias in that cities that use TIF are potentially those that have experienced slower growth rates relative to rapidly growing suburban areas. While Byrne used a first-differenced fixed-effects model that he claimed eliminated the issue of selection bias, it is still possible that slower growth municipalities adopt a TIF after a recent period of slow growth. Finally, as Byrne pointed out in discussing the detailed findings by industry, it is unclear whether we should even expect to find a municipal-level impact of TIF because its stated purpose is to increase economic development within a narrowly conscribed geographic area.
Using time series data for Chicago at the block group level, Lester (2014) showed that the use of TIF failed the “but-for” test with no evidence of increasing tangible economic development benefits in terms of job growth or investment. The use of block-group-level data was significant in that it allowed for testing of the impact of TIF designation on job creation at the same level at which investments are funneled. The article addressed the issue of selection bias through a weighting mechanism to account for the likelihood of each block group to receive a TIF. Lester also took advantage of the time series nature of the data set to evaluate whether the timing of TIF designation or investments made from TIF revenues had a greater impact on the economic development of the designated district.
Yadavalli and Landers (2017) analyzed the effect of TIF on employment growth in the Indiana from 2004 to 2013. This econometric evaluation controlled for endogenous factors using a propensity score matching technique and found that TIF does not have a statistically significant impact on employment or employment growth over time. The study also analyzed the change in gross assessed value in property over time and found that TIF parcels did exhibit slightly higher growth than non-TIF parcels over time, but the difference was economically small and did not necessarily pass the “but for” test.
Hicks, Faulk, and Deveraj (2016) took an alternative approach and evaluated the effectiveness of TIF by examining fiscal impacts. Their study, conducted in the context of Indiana, found no net benefits for overall economic development in terms of assessed value, payrolls, employment, taxable income, or taxable sales of goods. It also reported heavy losses to the state’s non-TIF tax base, as large as $12.3 billion a year. Another strand of the empirical TIF literature focuses on its impact on real estate values and reveals mixed, but largely negative, results. For example, Dye and Merriman (2000) used data from municipalities within the Chicago metropolitan area to examine whether TIF adoption impacts overall growth in equalized assessed value. They found that TIF adoption had a negative impact on municipality growth, even after controlling for a variety of municipal characteristics—community type, community location, and fiscal structure. They attributed this finding to higher growth within TIF districts at the expense of non-TIF portions of the city. This finding is echoed by Merriman, Skidmore, and Kashian (2011) using city-level data from Wisconsin. Weber et al. (2007) analyzed appreciation rates of single-family homes that sold more than one time from 1993 to 1999 in the city of Chicago. After controlling for the characteristics of homes and neighborhood conditions, this study found mixed results that indicated that that proximity to an industrial TIF district negatively affected prices, but proximity to TIF districts with both commercial and residential parcels increased appreciation rates. A critical aspect of their study was the use as an additional control of information on TIF-funded activity as well as a measure of TIF spending.
Kane and Weber (2016) included data on TIF spending to examine the effects of TIF on property value change in Chicago based on the type of publicly funded expenditures made under the designation of TIF. These expenditures range from developer subsidies to infrastructure to job training programs. This study revealed TIF expenditures to be generally poor predictors of property value change, suggesting a more symbolic than substantive value of TIF. However, the degree to which TIF affects property value varies by the type and timing of the expenditures, with subsidies for commercial and residential projects and community development being most quickly capitalized into property values. Hicks, Faulk, and Quirin (2015) compared TIF and non-TIF districts within Indiana counties from 2003 to 2012. They found that TIF districts were associated with a small but positive increase in assessed valuation but negatively associated with employment, number of business establishments, and sales tax revenue.
Previous Work on TIF in Missouri
Although short-term effects of TIFs may be positive, there is little evidence to date to support the claim that they have contributed to overall regional economic growth. Most work to date has focused on St. Louis. In 2011, the East-West Gateway Council of Governments issued a report on the impact of development incentives in the St. Louis region, with particular attention on the use of TIF (Council of Governments, 2011). Examining TIF activity through 2009 with a mix of quantitative and qualitative methods, the report found that the more than $2 billion diverted as subsidies for TIF, largely for retail developments, 10 were ineffective in increasing regional sales tax revenue or in producing a significant increase in quality jobs.
In 2015, Saint Louis University Center for Sustainability (Coffin, 2014) published a descriptive study examining spatial patterns of economic and racial isolation to evaluate the impact TIF was having on patterns of neighborhood distress using data from 2000 to 2012. The study specifically examined the spatial distribution of a distress index by municipality to answer the question of whether the use of TIFs were driving investment to the more distressed communities in the region.
Methodology
A key goal of our analysis is to assess the impact of TIF designation on job growth and business development in local areas that receive TIF. To do so, we want to measure outcomes of interest, (e.g., employment, sales, creation of establishments) in block groups for several years before a TIF was designated and examine what happens several years after the TIF. While this simple subtraction method is clear, it is not sufficient to conclude that the TIF “caused” any observed growth. Thus, we make this same before-and-after comparison for both block groups that receive a TIF and other areas that never received a TIF. Then we compare the observed growth over the same period in both TIF areas (i.e., treated) and non-TIF (i.e., control) areas. This methodology is referred to as difference-in-differences (DiD). This is the methodology used in Lester (2014) and Yadavalli and Landers (2017), and we follow that with some key improvements.
Specifically, this study uses an interrupted time-series research design to generate DiD estimates that compare changes in the outcome variables in a set of treated areas relative to a control group at the block-group level. A naive comparison of treatment and control outcomes would simply attribute the difference in outcomes between the two groups as being the effect of the treatment. This approach would ignore any initial difference in the starting points of each group and therefore would potentially overstate the impact of the intervention. Assuming that both groups change the same way over time, DiD estimation improves on the naive, single difference approach by including a before-and-after comparison, thereby taking into account the initial difference between the two groups. The DiD estimate is therefore composed of two differences, a before-and-after comparison as well as a treatment-control comparison. In this framework, we first examine the impact of TIF designation. Equation (1) summarizes the basic modelling approach to measure the impact of TIF designation
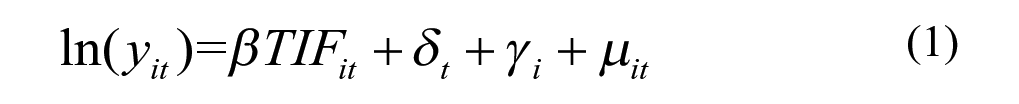
The natural log of the outcome, yit, is regressed on an indicator variable indicating treatment status, TIFit. The log-linear functional form is standard in the policy impact and empirical labor economics literature (see, e.g., Dube, Lester, & Reich, 2010). The main dependent variables of interest are overall employment, sales, and the number of establishments, aggregated at the block-group level. Separate regressions are conducted to study the effect within the manufacturing, services, and retail sectors. The independent variable is coded as (0) for each year (t) that a given block group (i) is not part of a TIF district, in the case of Kansas City, or does not include a TIF project, in the case of St. Louis. It is coded as (1) for each full calendar year after designation. The model also includes fixed effects for each year,
Addressing Selection Bias
A necessary justification for the use of TIFs is that development would not occur “but for” the use of TIF. To evaluate this claim, it is necessary to ensure that comparisons are made against a reasonable control group. If the assignment of TIF to fund projects or districts was decided through random assignment, simply comparing treatment and control groups using the DiD methodology described above would be sufficient. However, since municipalities did not designate TIF districts randomly but instead designate districts on the basis of certain characteristics that are generally “positively related with neighborhood distress” (Gibson, 2003, p. 309), simply comparing block groups that received treatment to those which did not is not adequate since the block groups that received treatment status were chosen because they were systematically different that those which did not.
To address the endogeneity of TIF designation, we employ a propensity score weighting procedure that identifies economically similar treated and untreated block groups based on pretreatment characteristics (Rosenbaum & Rubin, 1983). The procedure predicts likelihood of TIF treatment at the block-group level based on observable pretreatment characteristics, obtained from U.S. Census Bureau 1990 data. In other words, the procedure identifies block groups in both groups that can function as statistical twins on the basis on their socioeconomic conditions in 1990. The statistical twin in the control group can then be considered an area that may have received a TIF and therefore be comparable to an area that actually received treatment. The goal of propensity score weighting is to achieve balance in the distribution of the pretreatment characteristics so that the distribution is the same in the treated and control groups. The purpose of the weighting technique is not to predict timing of designation but rather to control for factors that may be correlated to economic development or growth that may also be correlated with TIF assignment.
Addressing Common Trend Assumption
One of the main assumptions underpinning the main DiD specification above is that all block groups, in Kansas City and St. Louis, respectively, share a common time trend. In other words, all block groups are assumed to follow the same time trend in the absence of being designated a TIF. It is important to note that this does not mean they are assumed to have the same mean outcome. To account for any differences in time trends and any characteristics that vary linearly with time for each, we also estimate a set of models that include linear time trends:

Addressing Pretreatment Bias
Another related potential concern is that the TIF commission may have some unobservable knowledge about the area that prompted the use of TIF in the first place. This would introduce endogeneity between the treatment and the outcome. For example, if an establishment that is part of a larger corporate structure is retracting receives an incentive to preserve employment in a certain district, this would negatively bias the results. The problem of pretreatment bias was first illustrated by Ashenfelter and Card (1985) in a study on job training. Specifically, they found that the recipients of job training exhibited a downward trend in earnings prior to training, which led to biased estimates of the benefits of the training program. To account for the presence of an “Ashenfelter dip,” we estimate an additional specification.
Given that we are more concerned with controlling for potential pretreatment bias than the timing of the TIF itself, we estimate the following model with controls for each year starting from 3 years prior (t − 3) to the implementation of the TIF through a 1-year lead (t + 1). Since the main independent variable is coded as 1 for all years after implementation, the coefficient on the lead term,
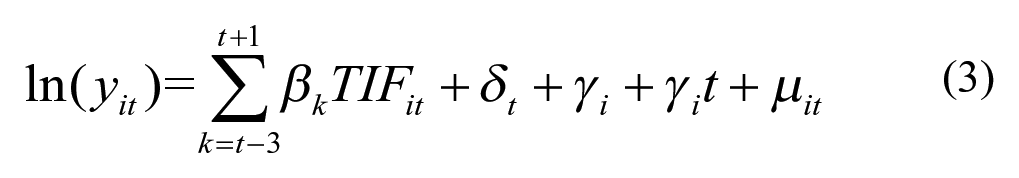
Graphically, the coefficients of the lead and lags produced from this estimation can be traced to create a time path. This is discussed further in the study.
TIF Investment
Since St. Louis implements TIF at the parcel level, the same block group could contain multiple TIF projects. To control for the amount of funds being spent in a block group, we additionally estimate the same set of models for St. Louis using a measure of the cumulative total anticipated reimbursable TIF project costs as the main independent variable of interest. This measure is to weight the various TIF-designated block groups by the amount of TIF investment.
Data
Data from three main sources were used to construct a time series database by block groups that was then used to conduct the necessary analysis. All outcomes and measures were assigned at the U.S. Census Bureau 2010 block-group level. Block groups were used as the unit of study because they are the smallest geographical unit for which sociodemographic variables of interest are available. 11 Measurement at the block-group level also allows for capturing any spillover effects TIFs may have had in their immediate vicinity.
Treatment
TIF Information
This study focuses on TIF activity in the state of Missouri, specifically in the cities of Kansas City and St. Louis. 12 To construct our primary independent variable of interest and to ascertain which block groups were treated with a TIF and which ones would serve as controls, we needed information on both the spatial location of each TIF district as well as the year it was designated (as well as TIF investment levels in some cases). Prior to 2013, the Missouri Department of Economic Development was responsible for collecting and reporting TIF activity and publishing information in annual reports. This responsibility was transferred to the Missouri Department of Revenue after the signing of executive order 13-02. Information on tax increment finance activity for both cities were obtained through the Missouri departments of economic development and revenue TIF annual reports. 13
For Kansas City, we obtained the spatial boundaries of each TIF district from the city’s office of economic development web portal. 14 Using GIS (geographic information system), TIF districts were then matched and aggregated to the block-group level, recording the date of designation in the GIS shapefiles. In some cases, very small portions of a block group intersected a TIF district. To address the possibility of overstating degree of treatment, we establish the criteria that at least 50% of a block group’s area must be within a given TIF district (following Lester, 2014). Without such criteria, we would be including many block groups in the treatment group when in fact they encompass areas that are unrelated to the TIF in question. We then overlay the TIF boundaries with census block-group centroids. In cases where multiple TIFs overlapped the same block group, the block group is assigned to the TIF district with the highest area coverage. Out of the 528 block groups in Kansas City, 141 were considered to have been “TIFed.” In St. Louis, the procedure was slightly different as TIFs are assigned at a property level instead of by district. TIF properties were geocoded in GIS and information was aggregated to the block-group level. Addresses for TIF properties were obtained from Better Together. 15 Block groups containing one or more properties that were tax increment financed were considered to have received a TIF. Out of 1,054 block groups, 92 contained TIF projects.
TIF in St. Louis and Kansas City
In defining the redevelopment plan, the municipality is responsible for the designation of the redevelopment area. The Missouri TIF Act permits different redevelopment projects within the redevelopment area (pursuant to the same redevelopment plan) to be undertaken, therefore the redevelopment area must contain a blighted area, a conservation area, an economic development area, or any combination thereof. In Kansas City, a total of 80 TIF districts were designated with the first project implemented in 1998. In St. Louis, the first TIF was designated in 1991 and there have been more than 160 TIF project implementations since. The redevelopment areas in St. Louis are bounded properties. Specifically, the area “includes only those parcels of real property and improvements thereon directly and substantially benefitted by the proposed Redevelopment Project” (St. Louis Ordinance #67847, p. 2). 16 How this difference affects the estimation is discussed subsequently in the methodology section. See Figures 1 and 2 for maps of TIF districts/parcels for St. Louis and Kansas City. Each municipality also establishes a TIF commission, which reviews the redevelopment plans, keeps the public informed through hearings, and makes a recommendation. 17 The municipality can still approve and move forward with the TIF if the commission votes down the plan.
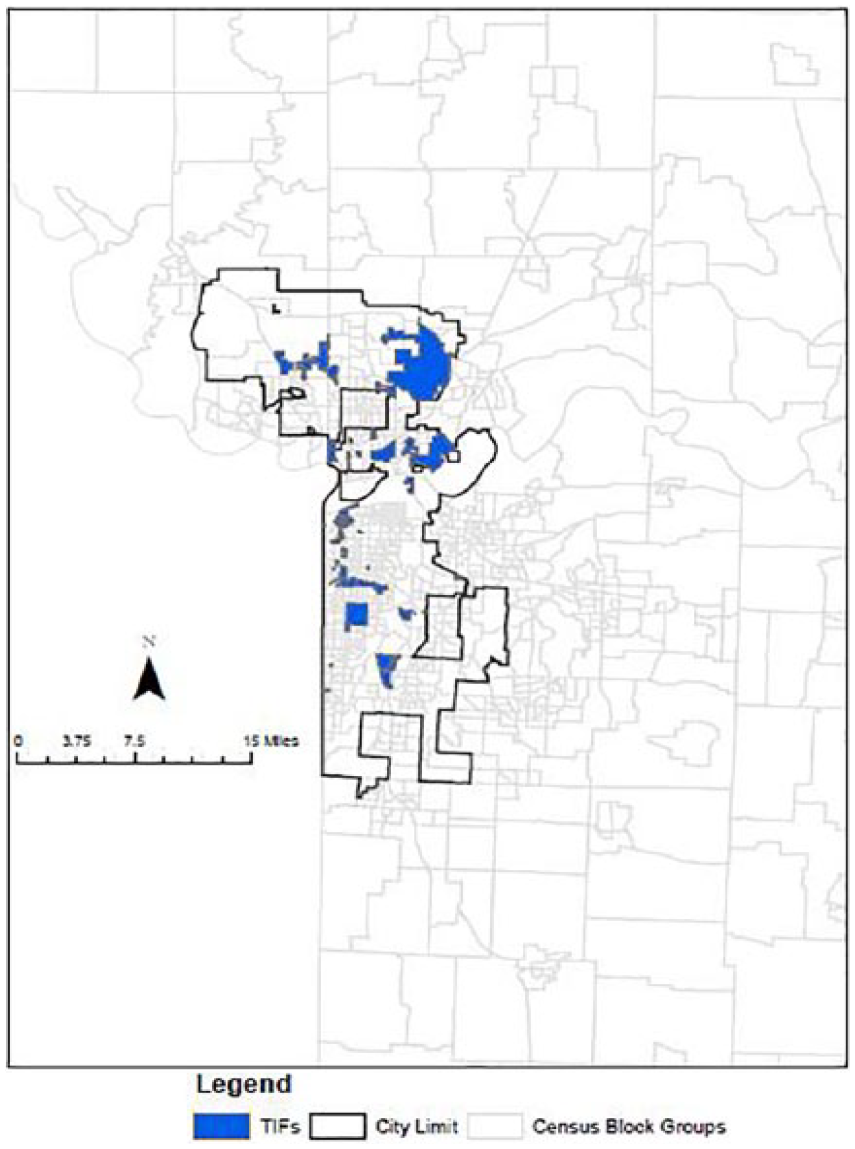
Map of tax increment financing (TIF) districts in Kansas City.
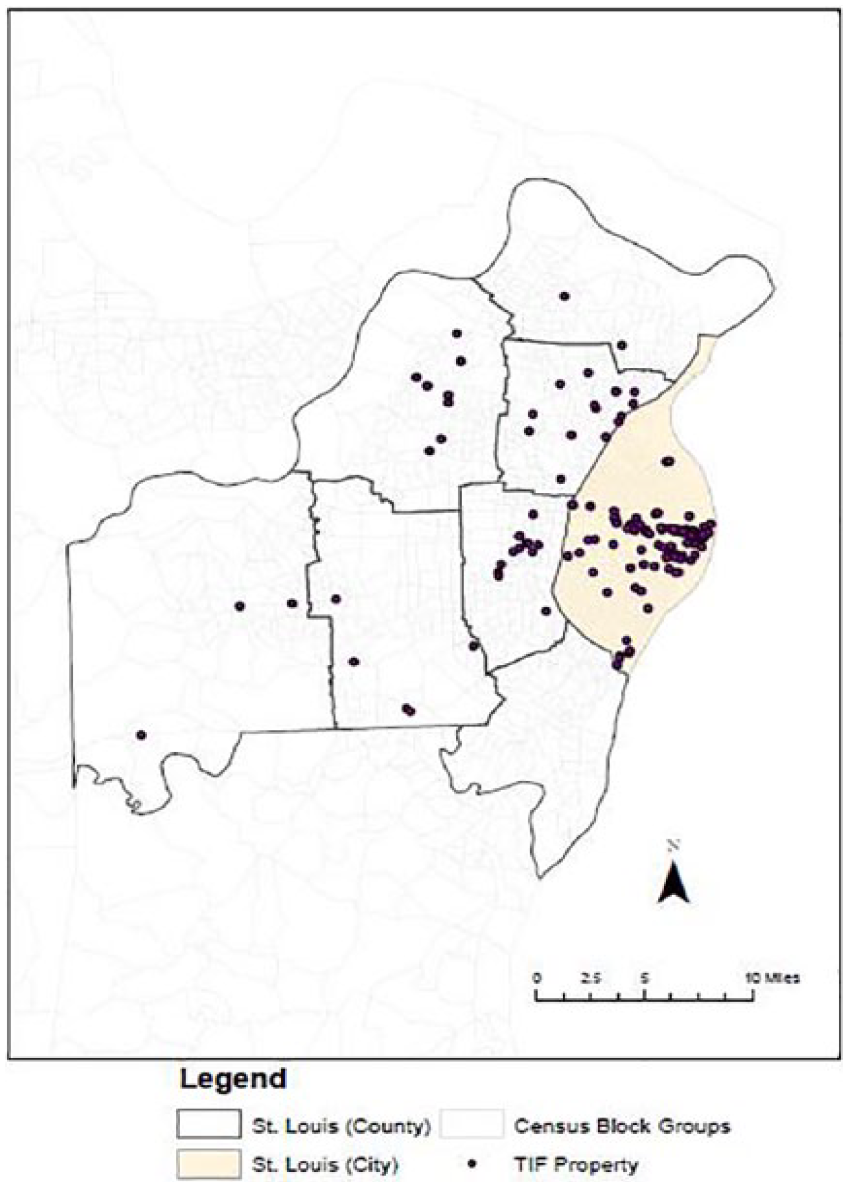
Map of tax increment financing (TIF) districts in St. Louis city and county.
Outcome
National Establishment Time Series
As TIFs are a tool generally meant to promote economic development, we examine the impact on employment (count), sales ($), and the number of establishments by industry using information from the National Establishment Time Series (NETS) database. The NETS is a longitudinal data set produced by Walls and Associates and based on annual snapshots of the Dun and Bradstreet Inc. business listing and credit rating service. The NETS is essentially a census of business establishments in the United States. The NETS database contains detailed information on employment, sales, primary industry, and birth and death year of businesses at the establishment level. The data is self-reported by the firms surveyed by Dun and Bradstreet for the purposes of maintaining a credit score. While the NETS is not considered an official source for total employment at a city or state level (as compared with administrative payroll data or ES-202 files), it does a comparatively good job at tracking new businesses, especially small or very small establishments and nonemployers. In addition, it is one of the few sources available for tracking business trends at a small geography, and as Neumark, Zhang, and Wall (2007) argued “the NETS offers advantages over existing data sources for studying employment dynamics, including tracking business establishment relocations that can contribute to job creation or destruction” (p. 39). 18
Each record also contains detailed geographic information for each establishment’s current or final location and a detailed inventory of all establishment moves. To generate accurate block-group-level counts of employment and the number of existing establishments in each year, each record in Kansas City as well as St. Louis (city and county) was geocoded based on its listed latitude and longitude. These records were then associated with a unique block group for each year that the establishment operated in that location. Using the records of establishments that moved, the subset of establishments that moved one or more times during the 1990 to 2012 period were also geocoded based on their origin latitude and longitude information on the move table of the NETS. These records were tracked and geocoded to uniquely identify the place–year combination of each record.
Controls
U.S. Census Data
We used 1990 U.S. Census Bureau data at the block-group level to establish a baseline comparison for the propensity score weighting technique. We chose 1990, as it was prior to the majority of TIF designations in our case cities, and we therefore could rely on these figures for an assessment of pretreatment existing conditions. Census-based information on demographics include race, percent employment in jobs with wages that exceed the community average, and measures of neighborhood distress. These include measures such as poverty rates and property use indicators as well as other indicators associated with neighborhood decline based on evidence in the literature (a full list of indicator variables is available in Table 1).
Weight Adjusted Census Block Group Summary Statistics.
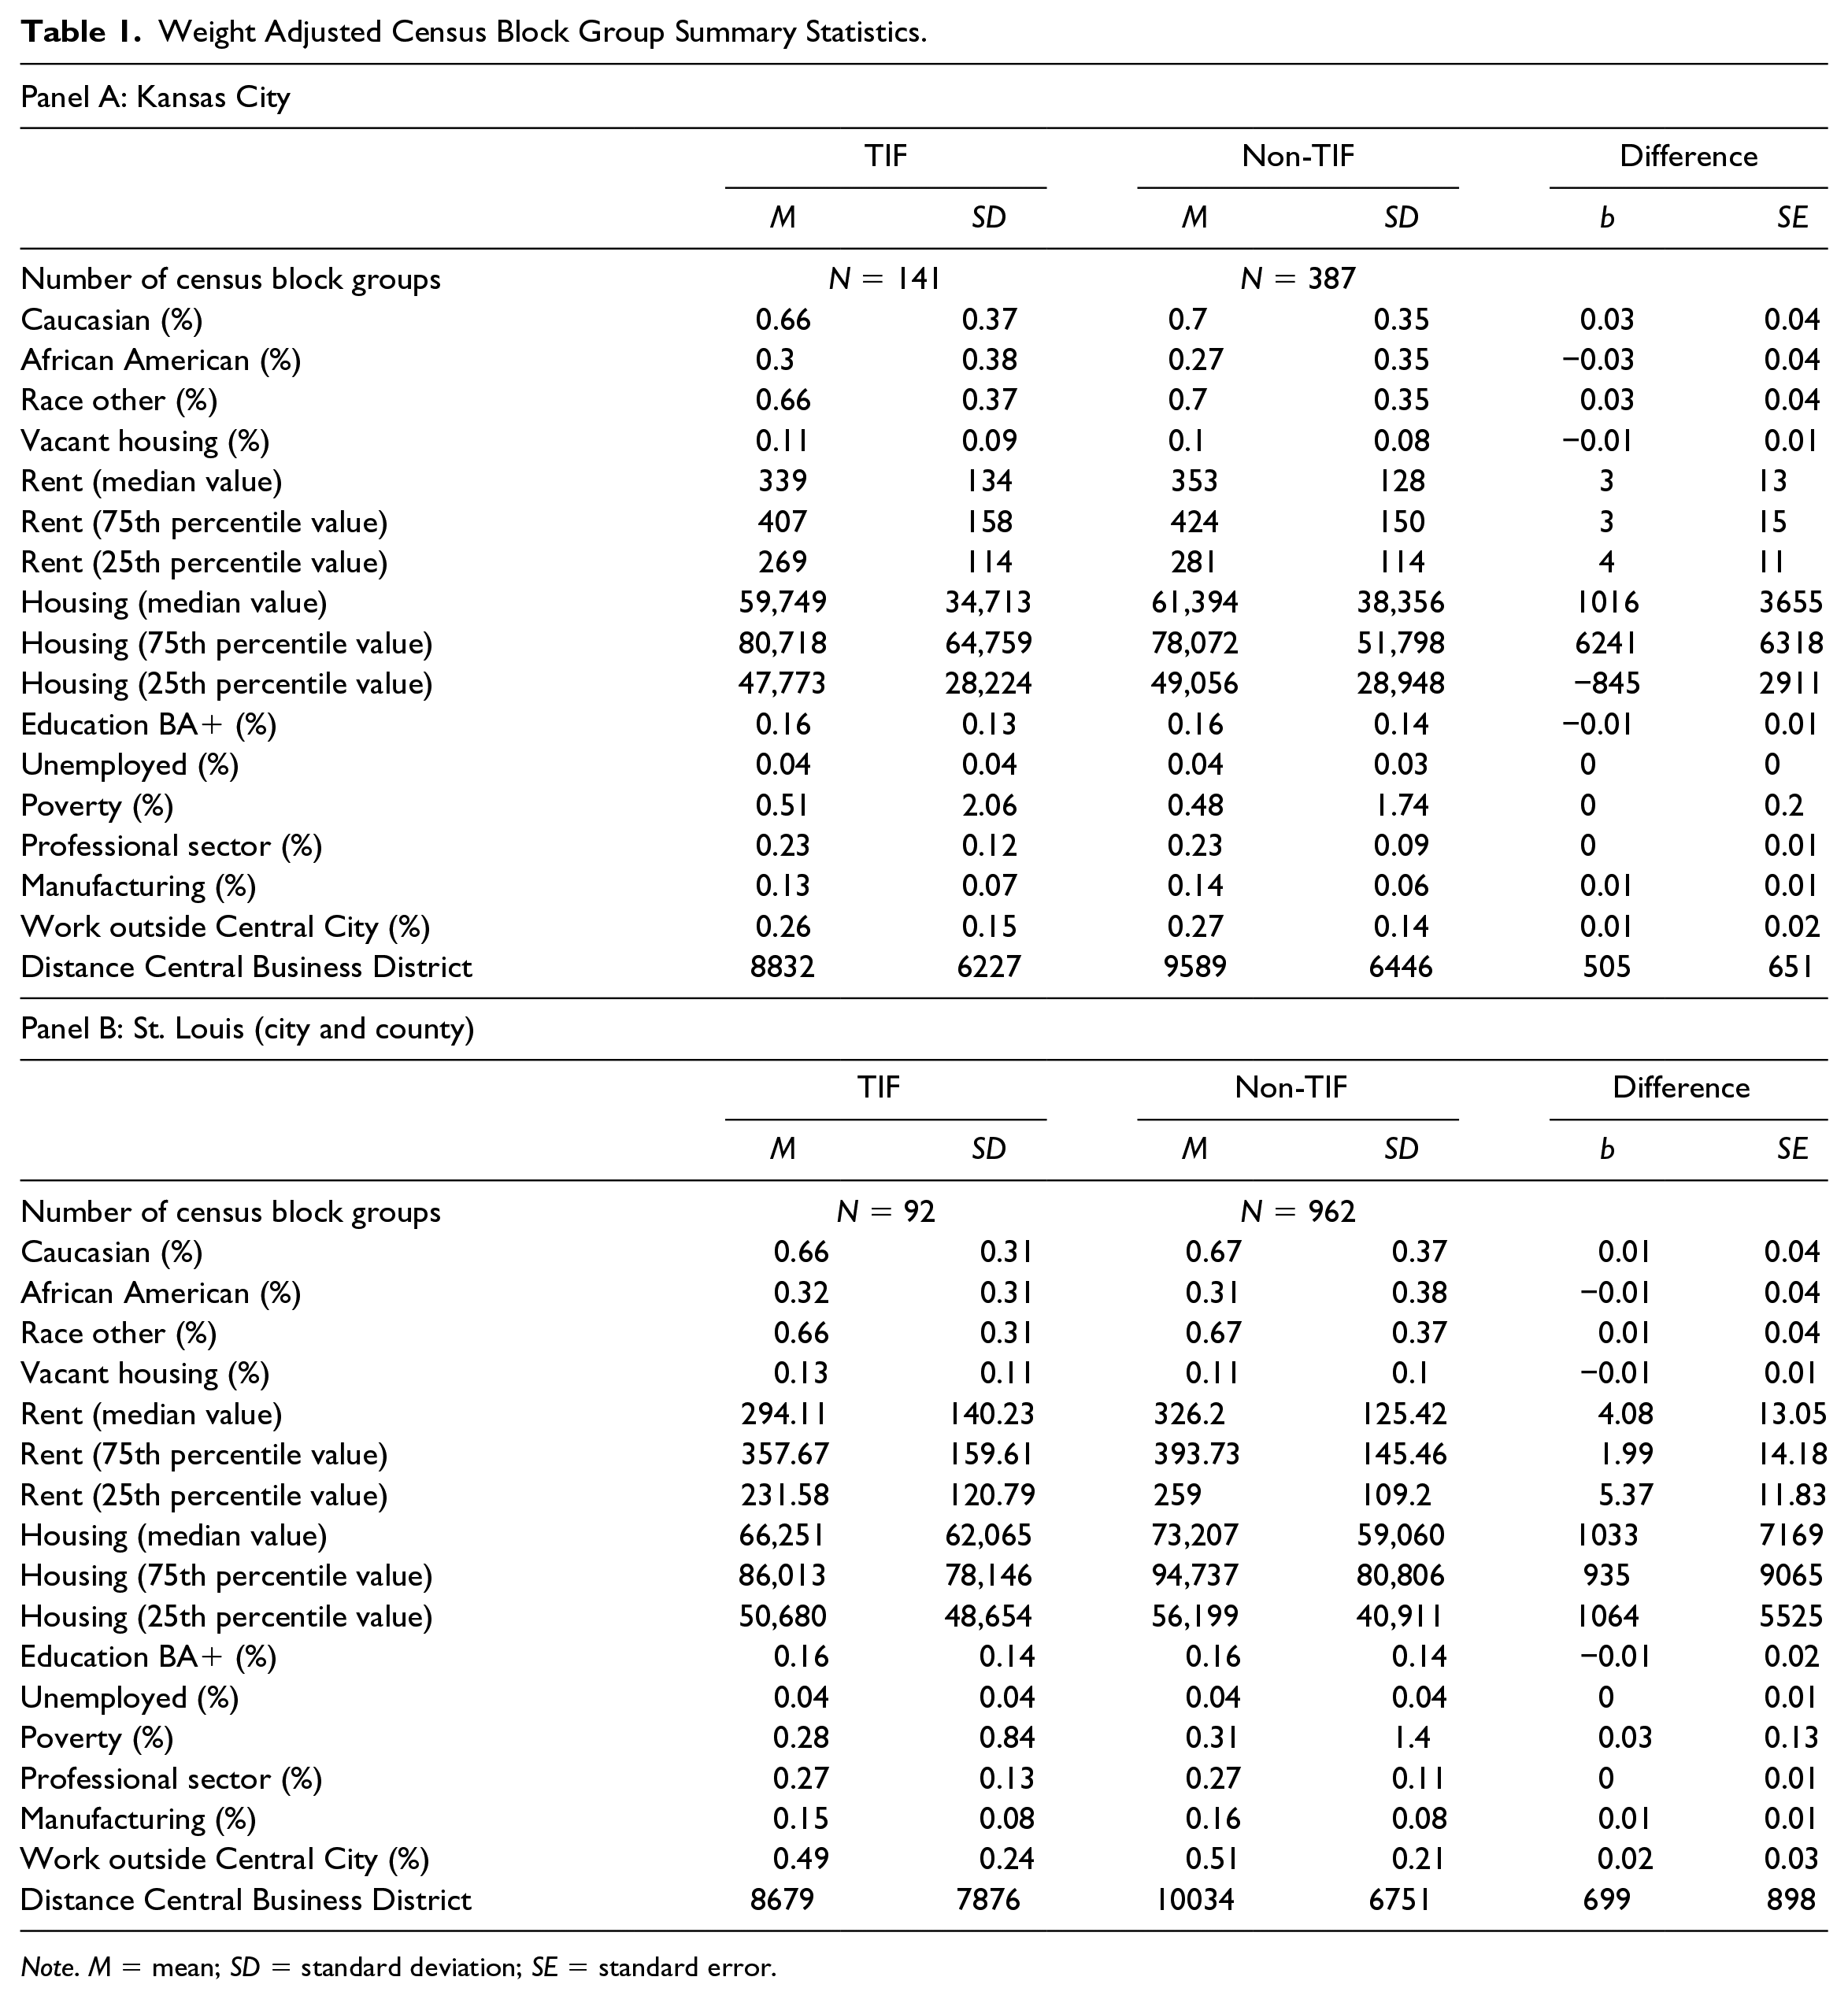
Note. M = mean; SD = standard deviation; SE = standard error.
We also include a measure for the distance in meters from each block group’s centroid to the respective central business district. U.S. Census Bureau 2010 block groups were then matched to those in 1990. The Integrated Public Use Microdata Series database has 1990 census information reconfigured to 2000 boundaries. Census 2010 block centroids were matched to 2000 block groups and are given their attributes. If block groups split, they are given the same attributes as the centroids for both 2010 block groups that originate in the same 2000 block group. If block groups consolidate, they are given the attributes of the block group where the centroid falls.
Descriptive Statistics
In both cities, block groups that received TIF designation (at any time during the study period) had higher rates of poverty, vacancy rates, higher percentage of people working outside the central city, and had higher proportions of African Americans in 1990. Preweighted summary statistics for employment change over the study period and various neighborhood and land-use characteristics for the treatment and control block groups are provided in Table A in Appendix A (supplementary material available online).
Propensity Score Weighting
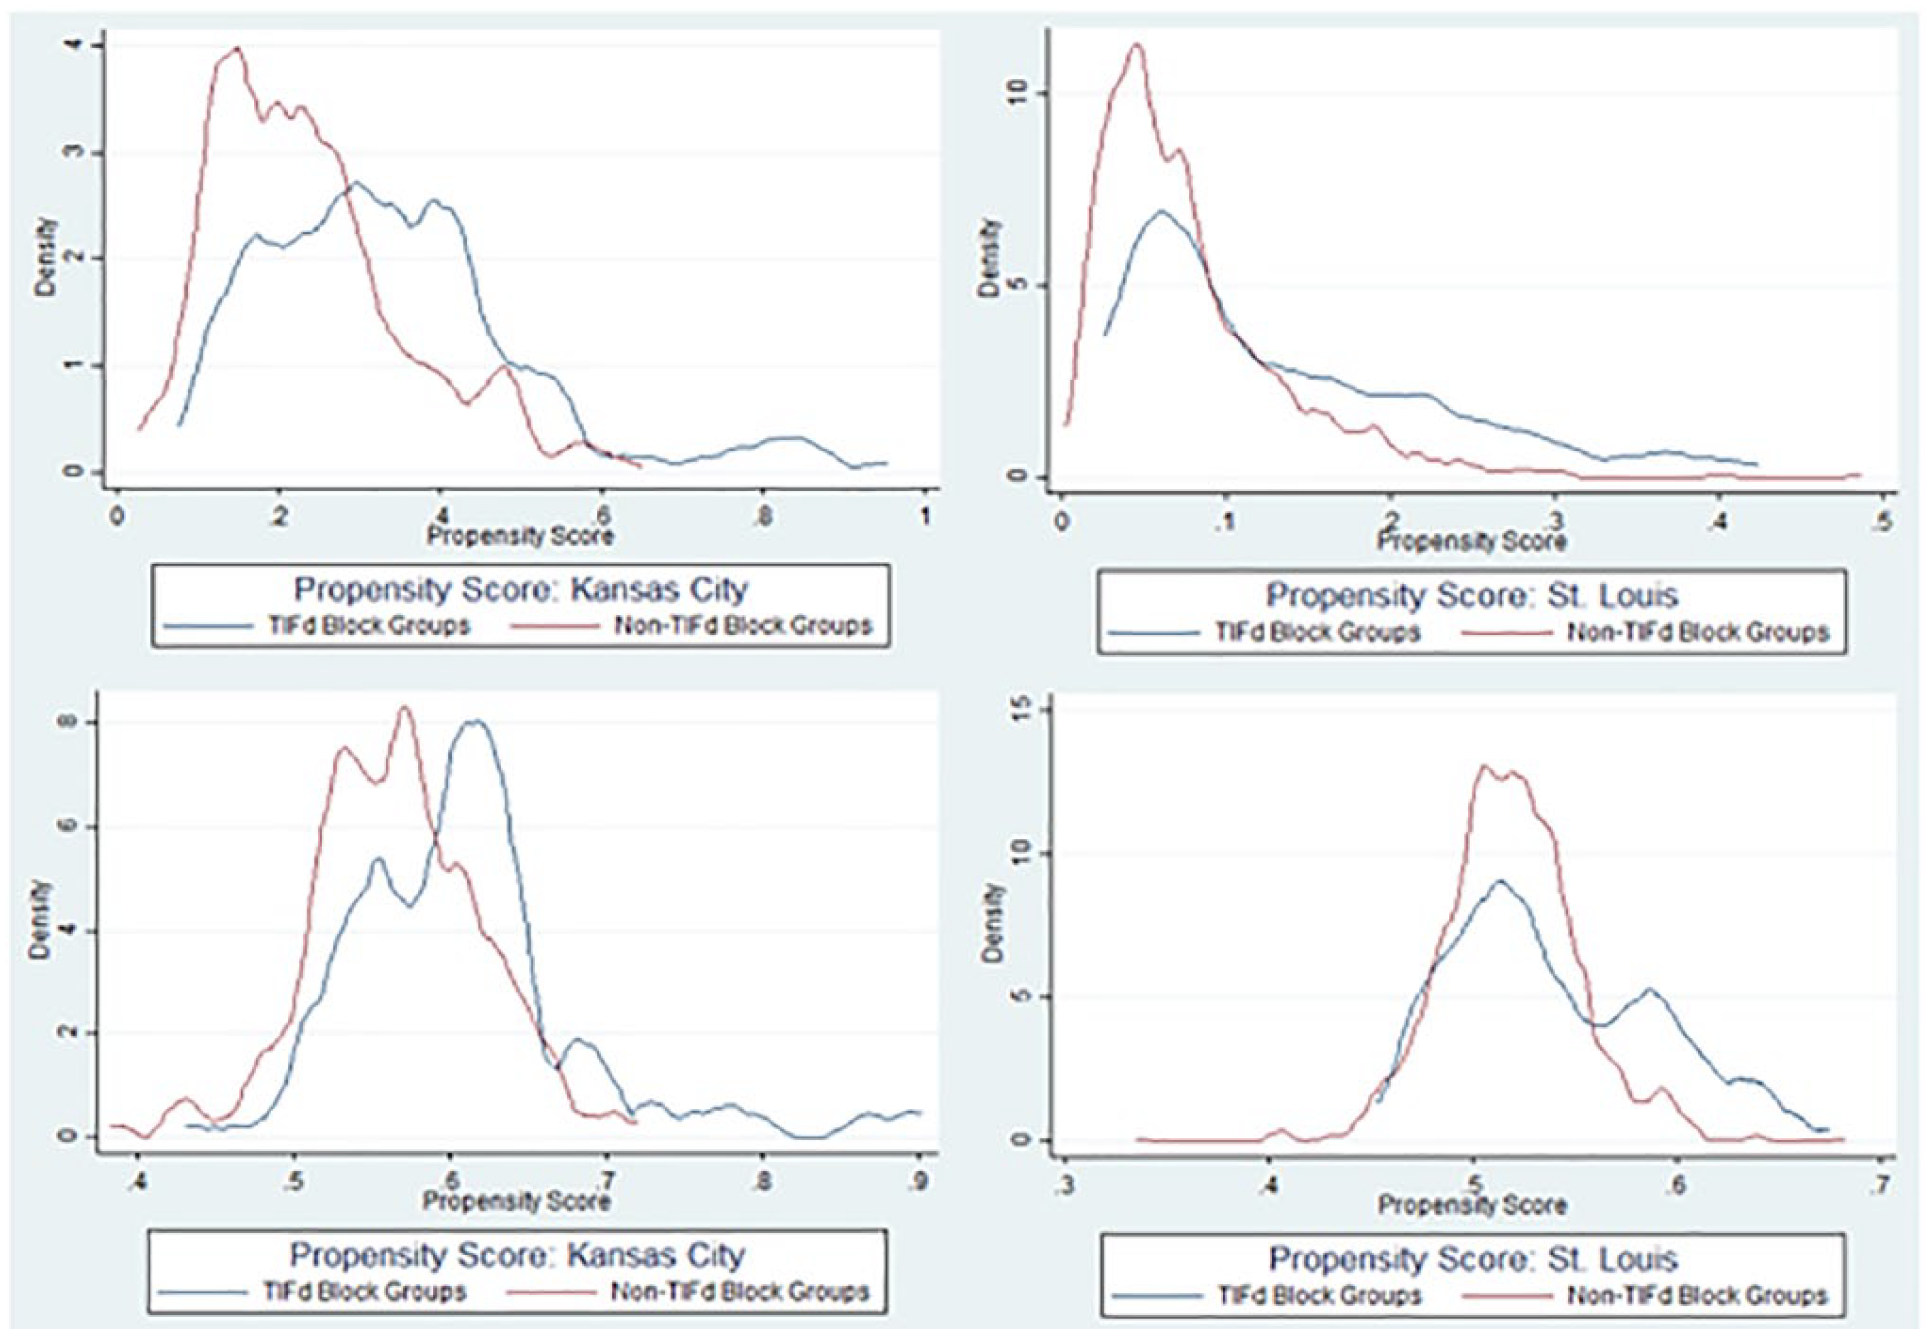
As is shown in Table A in Appendix A, the mean difference for every variable was highly statistically significant prior to matching. After matching, the balance is significantly improved. Table 1 shows the postweighted summary statistics. Figure 3 graphically displays the application of the propensity score methodology and its effectiveness in addressing selection bias. The propensity score itself represents the likelihood that a block group would receive a TIF given the similarities in pretreatment characteristics. The top two panels in the figure show the propensity score before the matching process and shows strong regions of support in both locations. The bottom two show the propensity score after the weighting process, displaying the balance in the distributions achieved through the methodology. After applying the propensity weighting procedure, the differences between the treatment and control groups on all observable characteristics were insignificant, indicating that the weighting procedure is reasonably effective in addressing the issue of selection bias. Table B in Appendix B presents the probit estimation results of the first stage of the propensity score matching technique. 19
Application of propensity score weighting. The top two panels show the propensity scores before matching. The bottom two panels show the propensity scores after matching.
Results
Overall, the analysis conducted in this study finds no support for the claim that TIFs generated tangible economic development benefits in either Kansas City or St. Louis. In other words, we do not find evidence that the use of TIF generates economic development opportunities that would not have arisen in the absence of the tax incentive. Accounting for the different types of potential biases with various specifications and robustness checks discussed below, the results find little or no systematic positive effect of TIFs. To clarify, the analysis performed does not indicate that no economic development occurred in block groups where TIF projects were designated, but that the level of economic activity was not discernably faster than the levels of similar areas where TIF projects were not designated. In other words, the development seen in TIF areas is what would have been expected in the absence of the TIF program. We, conclude, therefore that, in general, the TIF program does not pass the required “but for” test.
Table 2 contains the results of the DiD analysis summarized in Equation (1). Tables 3 through 5 show results of alternative specifications described below. Estimates of the impact of TIF in both Kansas City and St. Louis are presented for both the unweighted (Columns 1 and 3) and propensity-score-weighted (Columns 2 and 4) specifications. The results are also sorted into three panels according to the major set of dependent variables considered. The upper panel contains the estimates on employment across the four categories considered, the middle panel summarizes the impacts on establishments sales activity in the same categories, and the lower panel summarizes the impacts on the number of business establishments in the same categories. The weighted results for all models presented are the preferred specification, as they address the issue of selection bias.
The Impact of TIF Designation on the Natural Log of Employment, Sales, and Establishments, 1990-2012: Main Difference in Difference Specification.
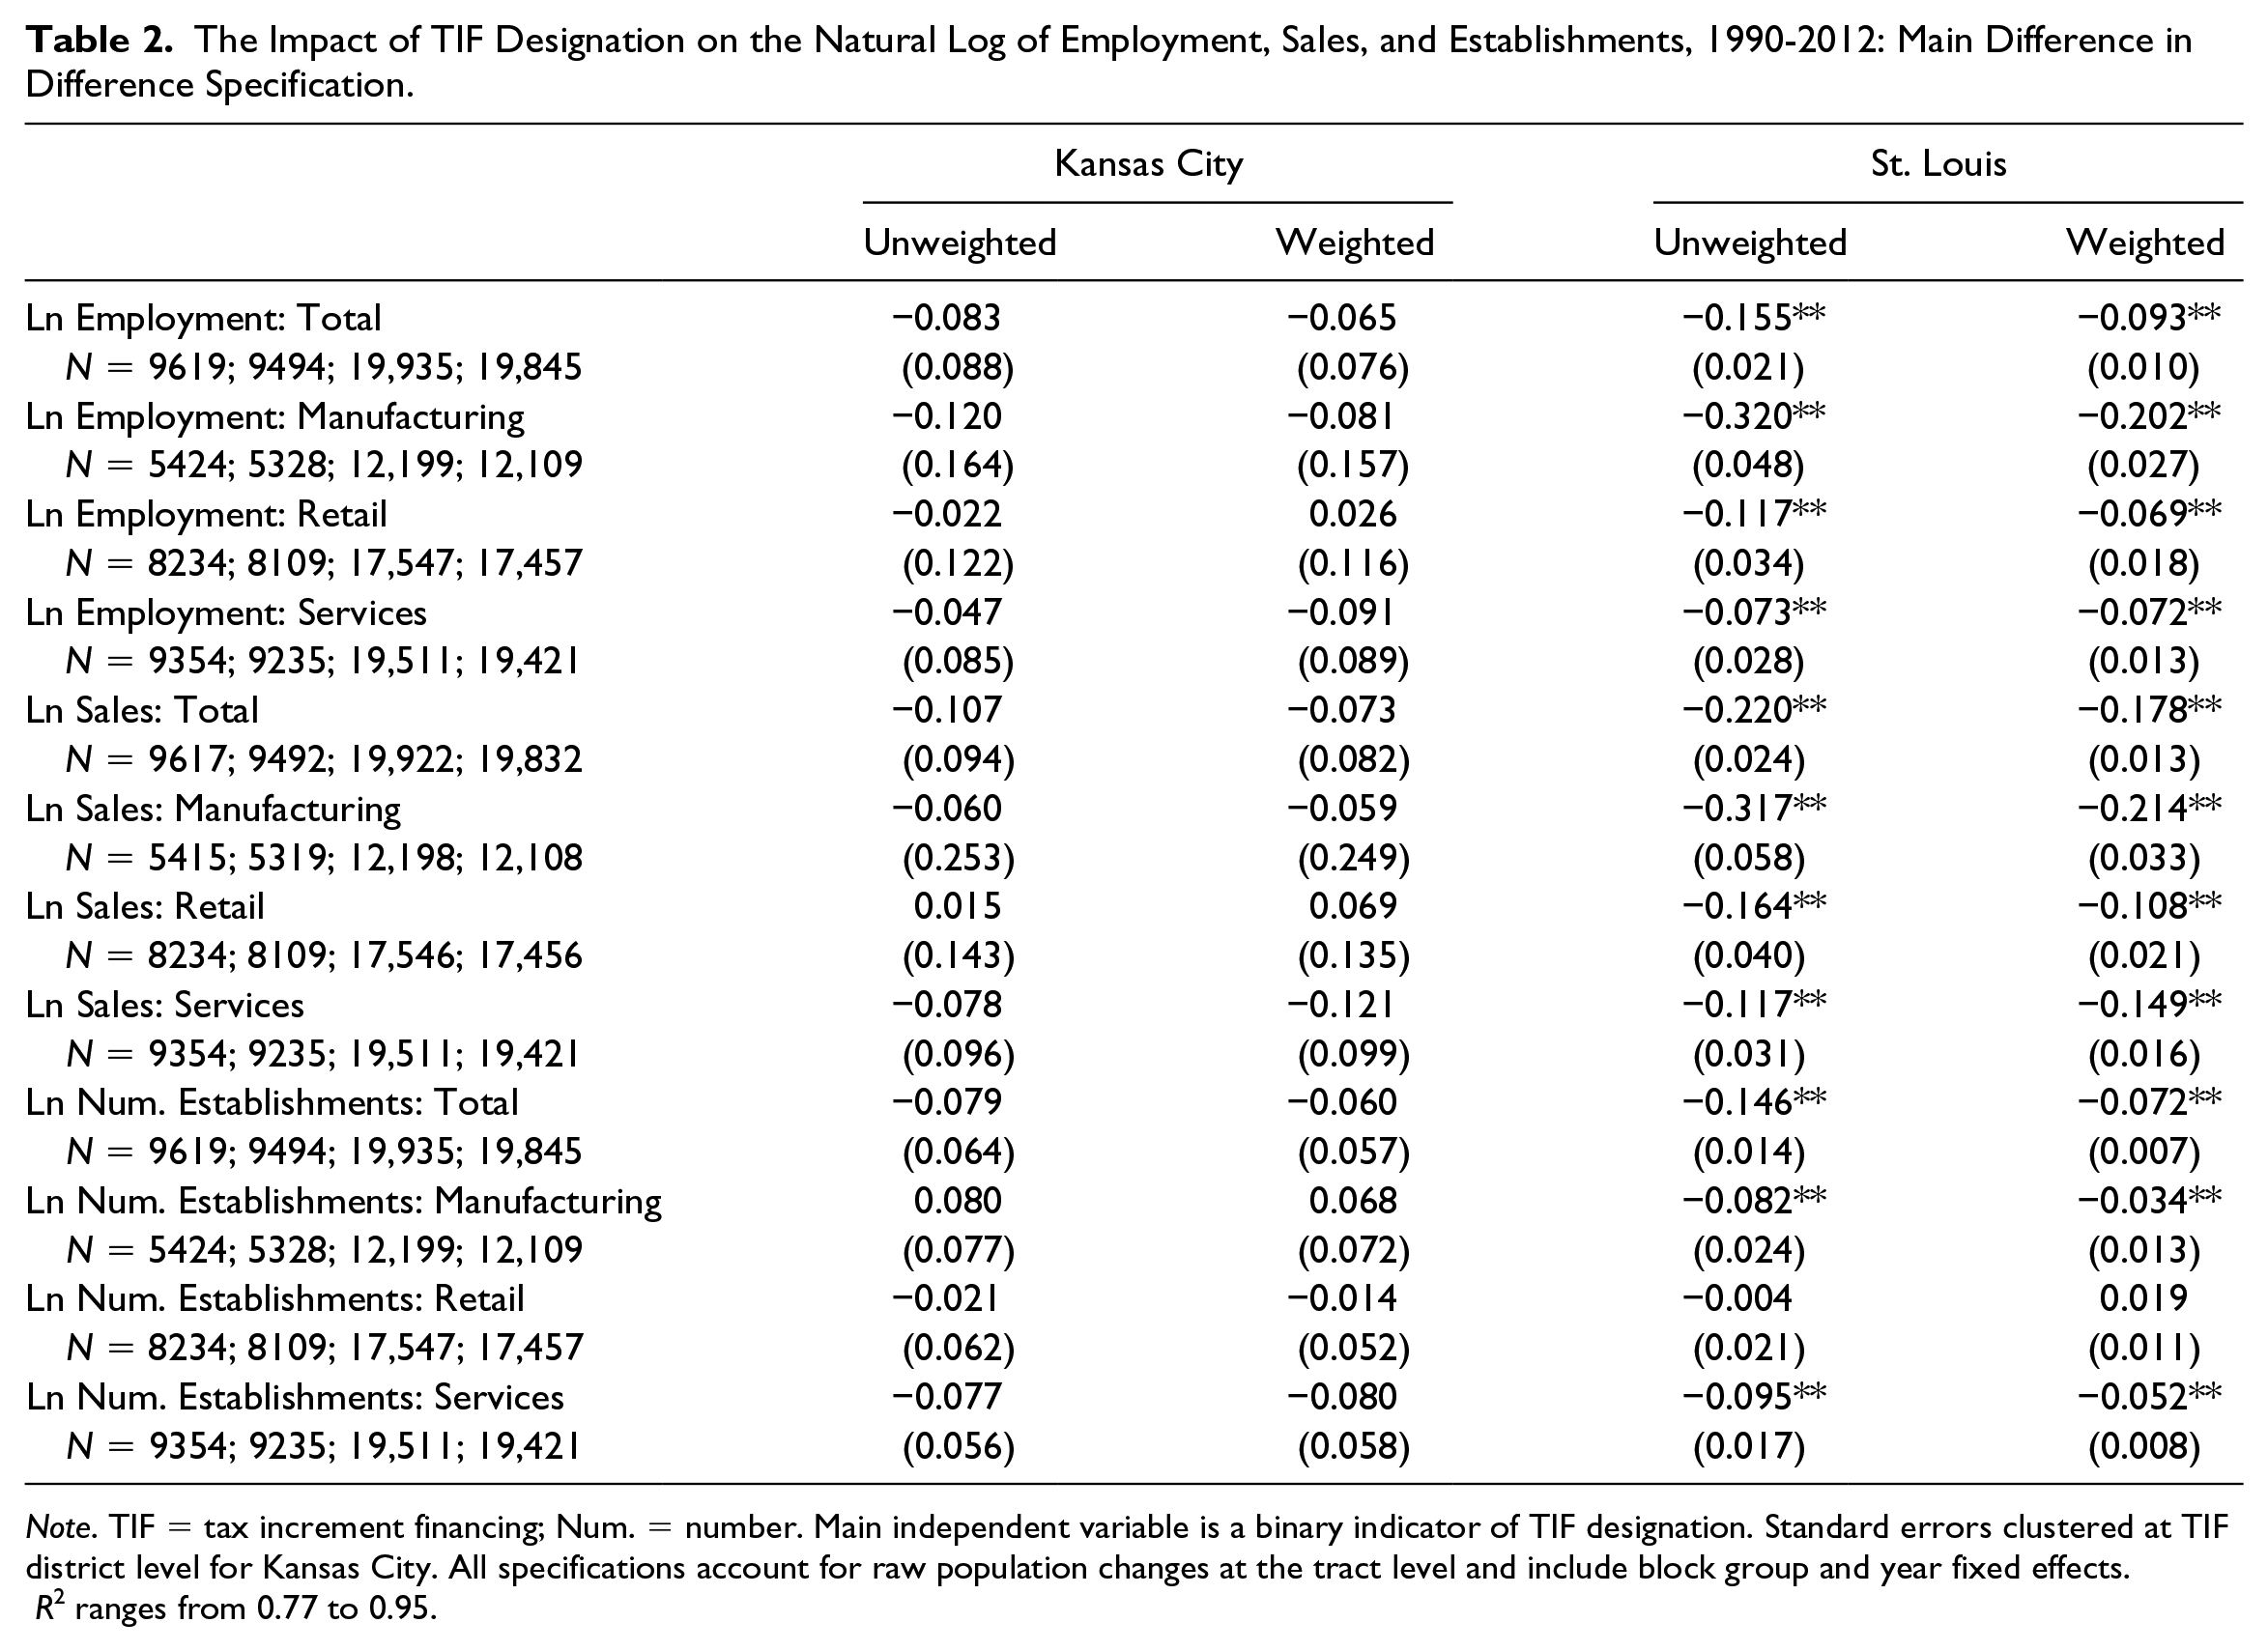
Note. TIF = tax increment financing; Num. = number. Main independent variable is a binary indicator of TIF designation. Standard errors clustered at TIF district level for Kansas City. All specifications account for raw population changes at the tract level and include block group and year fixed effects. R2 ranges from 0.77 to 0.95.
The Impact of TIF Designation on the Natural Log of Employment, Sales, and Establishments, 1990-2012: Alternative Specification With Time Trends.
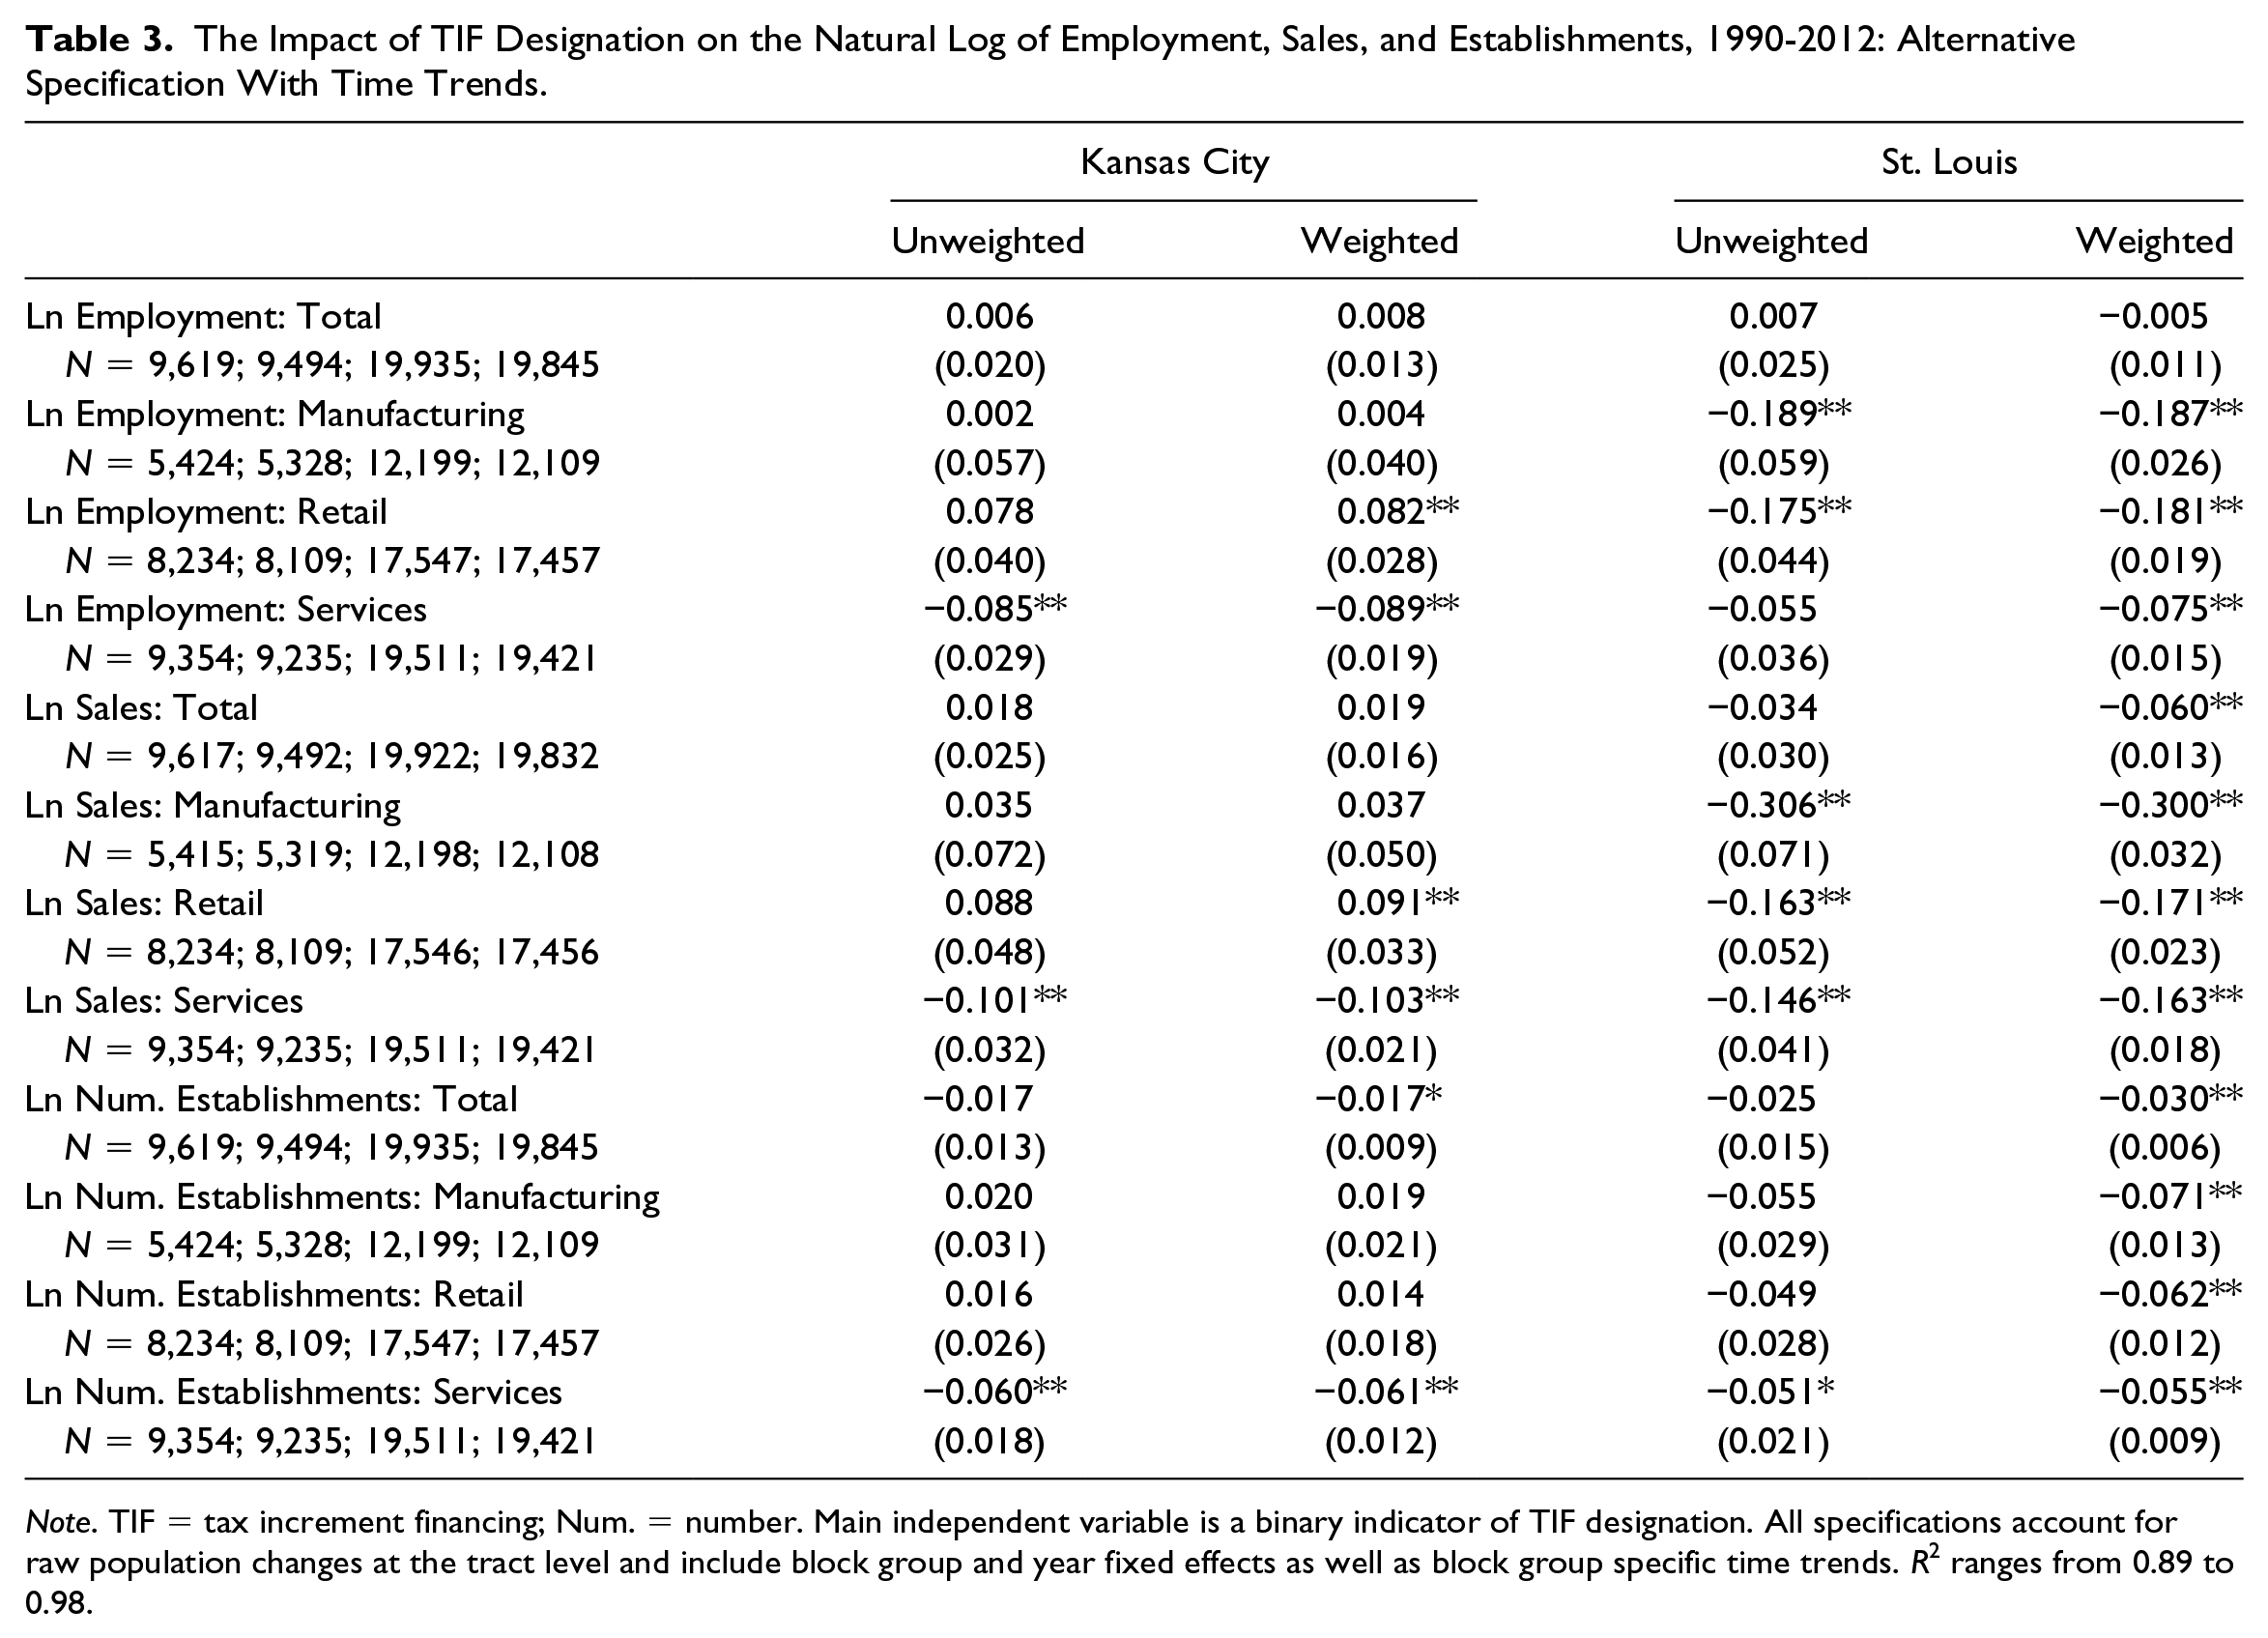
Note. TIF = tax increment financing; Num. = number. Main independent variable is a binary indicator of TIF designation. All specifications account for raw population changes at the tract level and include block group and year fixed effects as well as block group specific time trends. R2 ranges from 0.89 to 0.98.
In Kansas City, the estimated impact of TIF designation across all categories is very close to zero with relatively large standard errors, which suggests that the TIF program in Kansas City has been ineffective in promoting business development. In St. Louis, the results are slightly negative and, for the most part, statistically significant. Despite the significance, we cannot yet conclude that TIF has a negative causal effect as there may be differences among block groups that the specification is not able to capture. Although there may be some plausible reason why TIFs in St. Louis reduce economic growth (e.g., though a perverse signaling effect), we argue that this unlikely. Instead we interpret these negative and significant results in the basic model, which does not include local time trends or anticipation effects, as possibly indicating an incomplete control for selection bias. In comparing the reported coefficients between the weighted and unweighted models, the magnitude of the negative coefficient is reduced after controlling for the propensity to receive treatment. While the weighted controls are still negative and significant, we posit that policy makers in St. Louis are targeting areas that are experiencing localized negative trends. In addition, the fact that the TIF in St. Louis is confined to specific properties, rather than a larger swath of properties in a given district, we may be picking up negative trends elsewhere in the block group that are not necessarily treated. As will be shown below, once we control for localized time trends and include estimates for earlier time periods, the negative impacts are no longer significant. The main concerns are potentially differing time trends among treatment and control block groups as well as the potential for pretreatment bias. The results from this specification for St. Louis, therefore, suggest that the sectors that are most closely associated with stated goals of TIF projects do not have a positive impact on job creation.
To ensure that the analysis conducted here is valid, several additional specifications are estimated. Table 3 contains the results of an alternative specification of the previous DiD analysis to include time trends, summarized in Equation 2. In Kansas City, results indicate positive and significant effects on employment and sales in the retail sector, but negative effects for the services sector. The fact that results are not robust to block group specific time trends raises the question as to whether the effects that are being captured are necessarily those due to TIF or the general environment that leads to the adoption of TIF. The results for St. Louis are relatively robust to the inclusion of block group specific time trends.
We also conduct a “time-path” analysis, presented in Figure 4, to check for the possibility of anticipatory effects of employment relative to TIF designation. If there were a causal impact of TIF designation, one would expect the time paths to exhibit a sharp rise during the year of treatment (time t) and remain significantly above zero for all subsequent years. If there were a lagged impact of TIF on employment, then this increase would appear after time t. In Kansas City, the time path indicates the pattern of TIF impact is relatively flat and insignificant (i.e., dashed 95% confidence interval includes the zero line), hence indicating that there is no demonstrated positive impact that is associated with the timing of TIF designation. The time path for St. Louis, however, is almost completely flat with a marked increase at time t + 3 relative to the time of treatment designation. Given the fact that the overall DiD impacts are negative and significant, and that the overall trend is not indicative of a clear causal effect, we cannot interpret this finding as clear evidence of a lagged positive effect.
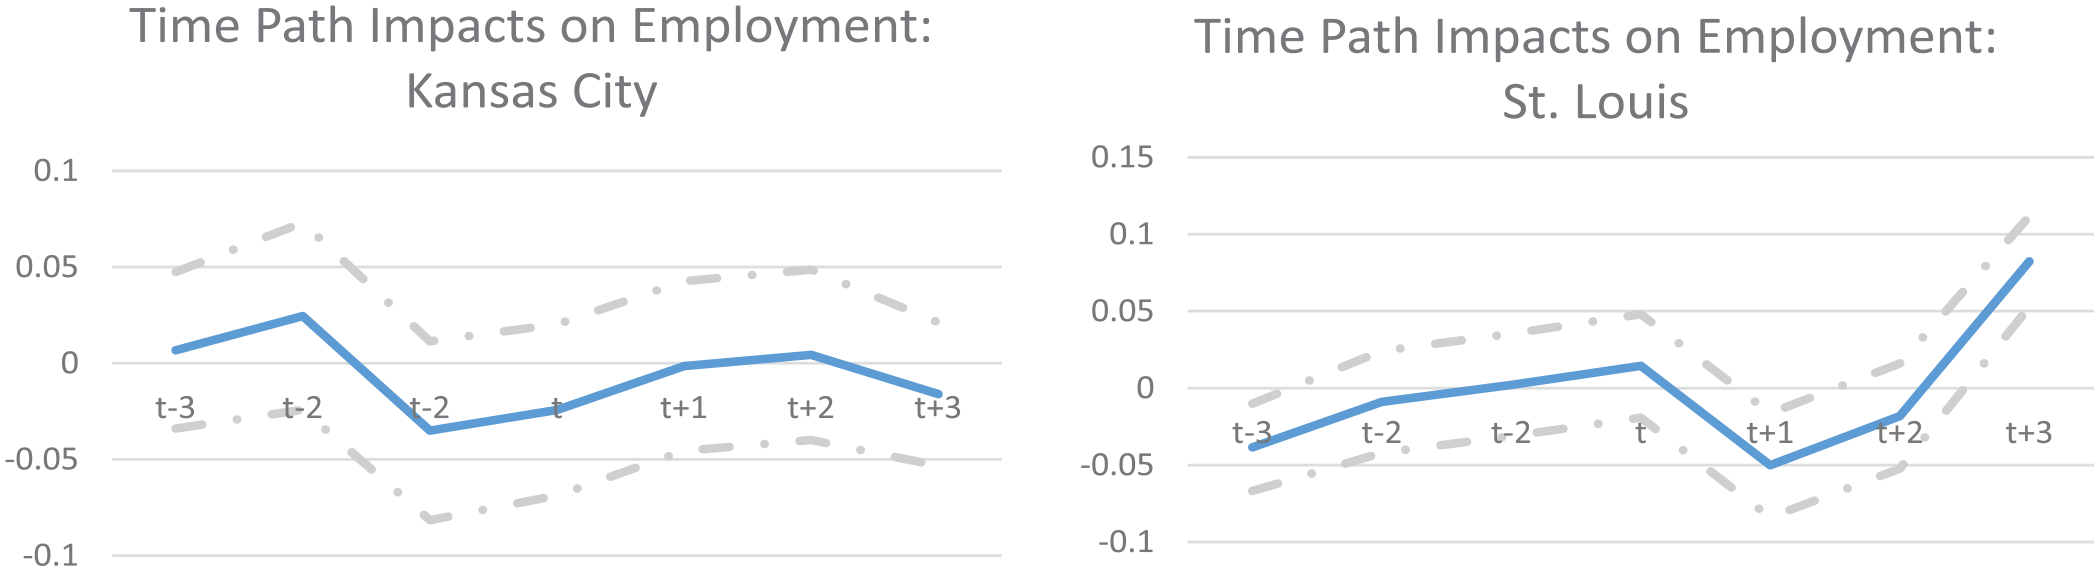
Time-path of tax increment financing (TIF) impacts on employment. Impact on natural log of total employment, 3 years pre/post TIF designation.
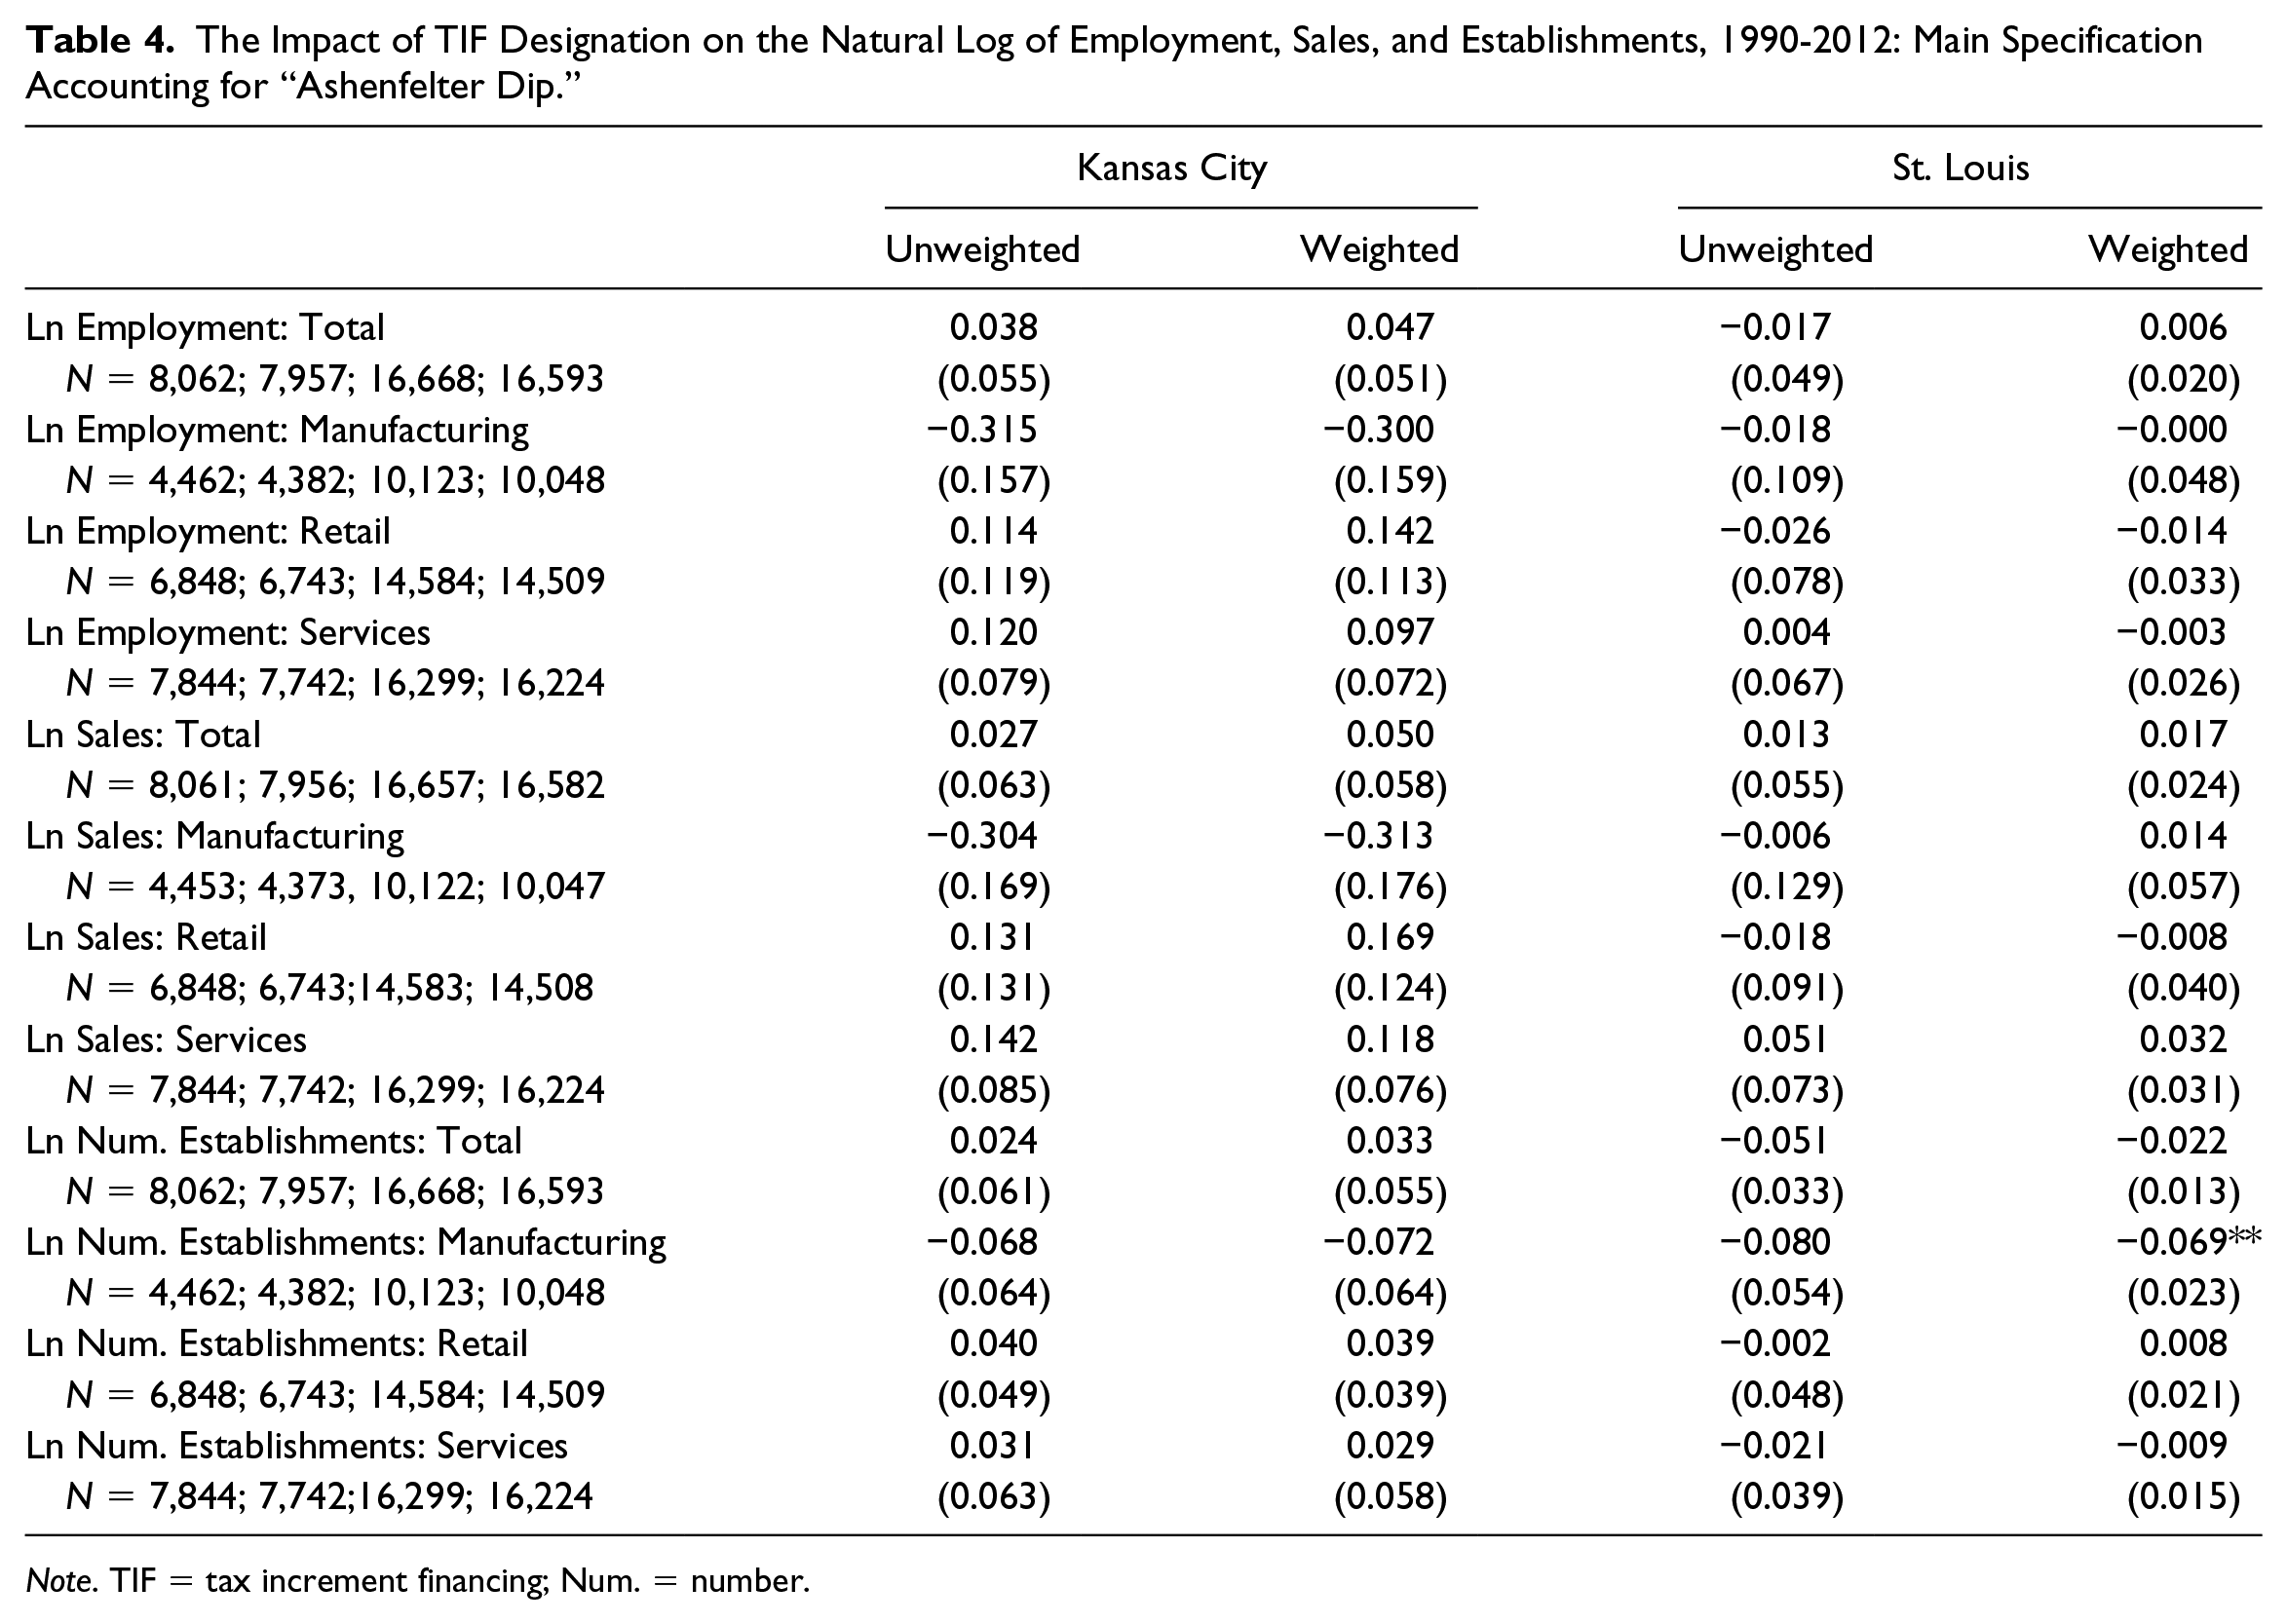
To further control for presence of pretreatment bias, we estimated an additional alternative specification, using Equation (3), to account for the fact that block groups that receive TIF designation may be subject to systematically different (negative) trends than those that do not. The coefficient on the lag term, corresponding to time t + 1, is interpreted as the impact on employment for 1 year after the incentive took effect as well as for all subsequent years. The results are presented in Table 4. The overall patterns of the findings remain the same, although the magnitudes decrease, eliminating significant effects. To clarify, these results indicate that there is no discernible positive impact on job creation or any of the stated goals of TIF, as the results are statistically insignificant from zero.
The Impact of TIF Designation on the Natural Log of Employment, Sales, and Establishments, 1990-2012: Main Specification Accounting for “Ashenfelter Dip.”
Note. TIF = tax increment financing; Num. = number.
Main independent variable is a binary indicator of TIF designation. This specification accounts for Ashenfelter dip by including three leads and one lag. Reported coefficient is that of the lag coefficient. Independent variable is a binary indicator of treatment status. Standard errors clustered at TIF district level for Kansas City. All specifications account for raw population changes at the tract level and include block group and year fixed effects. R2 ranges from 0.89 to 0.97.
Focusing on the case of St. Louis, an alternative independent variable, the cumulative total anticipated reimbursable TIF project costs, was used as a proxy to weight the various block groups by the amount of TIF dollars spent. Rather than a simple yes/no variable indicating the timing to TIF designation for treated block groups, this alternative independent variable measures the relative TIF subsidy given to developers or private businesses over the course of the TIF. Since one might expect that the benefits of TIF in terms of job growth and business development may be higher for projects that receive greater amounts of public investment, this alternative specification attempts to capture this possibility. Comparable investment data by year was not available for Kansas City. The results are shown in Table 5. The results are consistent with the previous findings in that the results are small, negative, and statistically indistinguishable from zero.
The Impact of TIF Investment on the Natural Log of Employment, Sales, and Establishments, 1990-2012: Difference-in-Differences Specification.

Note. TIF = tax increment financing; Num. = number. Independent variable is the log of the cumulative total anticipated reimbursable TIF project costs. All specifications account for raw population changes at the tract level and include block group and year fixed effects. R2 ranges from 0.85 to 0.94.
In addition to the various specifications, several robustness checks are performed. Specifically, the analysis is repeated after removing outliers. The analysis is also repeated removing observations prior to 1994 to account for potential noise in the NETS data. The results from the robustness checks reinforce the main finding that TIF has no discernible positive impact on job creation or any of the stated economic development goals.
Conclusions and Policy Recommendations
The use of TIF remains a popular tool among policy makers in their efforts to promote economic development. Theoretically their use also does have the potential to achieve its objectives of reducing blight and encouraging economic activity thereby increasing the tax base. Additionally, the immediate visible impacts from designating a TIF district or project (e.g., press releases, ribbon cuttings) reflect positively on local government officials, projecting an image of strength and proactivity. Though the incentive created from the positive image could lead to attempts to, for example, convert already thriving neighborhoods into bustling commercial districts, or the overuse of TIF in general.
In practice, the impact of TIF remains unclear and its use remains quite controversial, especially in light of the large amount of tax dollars involved. Evaluations of the effectiveness of such programs are critical not only in our understanding of how best to promote and fund economic development projects, but also how to support local economies without needless spending of scarce resources. Given that the fiscal stress in many Missouri communities such as St. Louis and smaller suburbs within St. Louis county, such as Ferguson, the potential waste of tax dollars may be more important than the condition of blight itself. Our findings suggest that policy makers should therefore be more cautious in their use of TIF.
This study underscores the importance of such evaluations by examining the implementation of TIF in Kansas City and St. Louis in the state of Missouri. We use a careful and detailed methodology to test whether the use of TIFs passes the “but for” test, a necessary requirement that holds that the use of TIF should be reserved exclusively to promote economic development that would not occur but for the incentive. Although we conclude that there are no systematically positive impacts of TIF, it is important to acknowledge that this refers to the use of TIF in these cities, on average. We find that the use of TIF has not diverted investment or increased economic activity beyond what we would have expected if TIF was not used. Our analysis does not enable us to make any claims regarding individual TIF projects and we acknowledge that TIF could be justifiable and effective in certain cases or for different reasons beyond a progrowth economic development argument (e.g., for the sake of equity).
Based on this and other research, we argue that the TIF approval process should be modified to promote transparency and accountability. One way to achieve this would be to couple the TIF proposal with a careful cost–benefit analysis that projects and clearly articulates the job creation outcomes of the redevelopment proposal. Another avenue would be to strengthen legislative requirements. Not until recently, Missouri’s state statute required that the TIF commission only make a recommendation on the approval of a TIF project. Though not studied in this study, the recent TIF legislation passed in 2016 (Missouri House of Representatives, 2016) restricting the ability of local governments in the St. Louis region (St. Louis, St. Charles, and Jefferson counties) to override the decision of TIF commissions in case the project is not approved may be a step in the right direction. In addition, local or state government bodies should be empowered to disband TIFs that are under performing and immediately return any accrued increment to the public tax rolls. Additionally, as mentioned earlier, TIF diverts funds away from overlapping jurisdictions, such as school districts. Reforms that would allow these parties to weigh in on the process and granting them veto power over the portion of funds that they would have otherwise received would be a further step toward increasing accountability.
Supplemental Material
Appendix_A – Supplemental material for Does Tax Increment Financing Pass the “But-for” Test in Missouri?
Supplemental material, Appendix_A for Does Tax Increment Financing Pass the “But-for” Test in Missouri? by Ahmed Rachid El-Khattabi and T. William Lester in Economic Development Quarterly
Footnotes
Declaration of Conflicting Interests
The author(s) declared no potential conflicts of interest with respect to the research, authorship, and/or publication of this article.
Funding
The author(s) received no financial support for the research, authorship, and/or publication of this article.
Notes
Supplemental Material
Supplemental material for this article is available online.
Author Biographies
References
Supplementary Material
Please find the following supplemental material available below.
For Open Access articles published under a Creative Commons License, all supplemental material carries the same license as the article it is associated with.
For non-Open Access articles published, all supplemental material carries a non-exclusive license, and permission requests for re-use of supplemental material or any part of supplemental material shall be sent directly to the copyright owner as specified in the copyright notice associated with the article.