




Abstract
Cities use tax increment financing (TIF) to trigger growth in blighted communities. Critics argue that Chicago’s broad conceptualization of “blight” facilitates the designation of TIF districts that do not resemble conventional notions of blight, bolstering their natural ability to generate capital, thereby exacerbating the gap between wealthy and poor minority spaces. This study examines Chicago’s TIF districts to determine whether blight levels and percentage of non-White residents interact to reduce the effectiveness of TIFs measured as the change in the equalized assessed valuation (EAV) of properties. Using composite indices to measure physical and economic blight, the results of a quantile regression analysis indicate that economically blighted TIFs with predominantly non-White populations outperform other districts. These findings run counter to expectations given that TIFs report high rates of growth in property values, yet they remain substantially blighted. This suggests a need to reconsider change in equalized assessed valuation as the measure of TIF effectiveness given that the “growth” in TIFs does not seem to reflect a higher quality of life for residents.
Local governments utilize tax increment financing (TIF) to reverse depreciating property values, particularly in distressed areas. TIF districts retain a proportion of their property tax revenues to finance development initiatives in the area and attract private investment. In the early years of TIF, only the most depressed communities were considered for the program. Across the nation, however, several states and cities removed or diminished the blight standard when designating TIF districts. Research shows that nonblighted TIF districts perform at much higher levels, and earlier in the process as a result of their better economic positions, whereas blighted TIFs are not immediately prepared to compete for private investment, thus require more investments and time to experience noticeable growth (Briffault, 2010; Huddleston, 1982; Lester, 2014). While previous analyses of blight and TIF performance relied on individual indicators of blight, we focus on understanding the correlation between overall levels of blight and changes in the equalized assessed valuation (EAV) of property within TIF districts.
Flexibility in the blight standards used to adopt TIF districts in Chicago, Illinois facilitated the adoption of more than 160 TIFs across communities that vary substantially in the presence of blight, both physical and economic, as well as racialized groups. Local critics argue that Chicago’s most blighted TIF districts exist in communities with predominantly non-White populations, and TIF fails to adequately address blight in these particular spaces (Jorvasky, 2015; Jorvasky & Dumke 2015; McGhee, 2016; Spielman, 2015). In this study, we purport to test the validity of these claims by investigating if TIF district performance (change in EAV) negatively correlates to the current levels of physical and economic blight in districts. Using an interaction variable (blight × race), we also examine whether this relationship changes according to the proportion of non-White residents in the district.
The analysis involves two composite blight measures. Aggregating conventional indicators of both blight types permits the measurement of overall physical and economic blight while also reducing the potential for multicollinearity resulting from the inclusion of related variables in the same estimated regression models (Nathan & Adams, 1976). To test the correlation between physical and economic blight, race, and TIF performance, we conducted quantile regression analysis (QRA).
Literature Review
The discussion surrounding blight spans urban politics, urban planning, sociology, law, public policy, and public administration. A strong consensus exists that blight is a community-level concept used to describe areas that experienced a “process of deterioration” (Breger, 1967; Gordon, 2004; Luce, 2000). The term blight denotes dramatic depreciation in the value of real property, or EAV, within an area. Without some intervention, the potential for blight to spill over to neighboring areas makes it especially problematic and a grave concern for property owners, businesses, and local governments.
The broad range of factors contributing to and symbolizing blight adds considerable flexibility to the concept. Blight is a social construction that reflects the values of community members (Breger, 1967; Shlay & Whitman, 2006). In effect, the presence of blight is in the eye of the beholder. As long as some consensus exists that property depreciation occurred, blight exists. All communities may present a legitimate argument for blight in their space. While the literature provides clear examples of community blight (e.g., property abandonment, deterioration, and obsolete buildings), the subjective nature of the term allows some neighborhoods, including those with low levels of property value depreciation, to make claims on local governments for remedy despite nondeplorable conditions. For this reason, many refer to the term as vague, amorphous, and lacking “conceptual consistency and cohesion,” which complicates policy making (Breger, 1967, p. 369; Pritchett, 2003; Shlay & Whitman, 2006).
Many states adopted legislation that permitted local governments to implement TIF to address community-level blight. With more than 160 TIFs constituting approximately 30% of the city’s land, Chicago is the most prolific user of the local economic development tool in the nation. Similar to most cities, Chicago’s process to create a TIF involves the designation of an area as a TIF district; calculation of the EAV of property in the district; investments in (re)development, which triggers growth in the area’s EAV; calculation of the tax increment, or the difference between initial assessment and the increased property value; reinvestment of the tax increment into the district (Dye & Sundberg, 1998; Farris & Horbas, 2010; Lester, 2014; Weber, 2002). The TIF expires 23 years after designation unless city council approves an extension for up to a total of 35 years (Tax Increment Allocation Redevelopment Act, 1971).
TIFs’ popularity lies in the presumptive financial and development benefits. By providing incentives for various developments, TIFs foster (re)development in communities that would continue to decline (Lester, 2014). TIFs provide financing for improvements without drawing money from the general budget, raising city property taxes, diverting other municipal funds, or reducing services (Smith, 2006). The public’s initial investment in the blighted community offsets private investors’ risk and strengthens the community’s ability to attract new businesses and homeowners. As long as the projects generate increases in properties’ EAV, the TIF district will reap revenues that support development.
However, findings on the effectiveness of TIF in cities across the nation are mixed (Byrne, 2006, 2010; Carroll, 2008; Carroll & Eger, 2006; Dye & Merriman, 2000, 2003; Hicks, Faulk, & Devaraj, 2016; Hicks, Faulk, & Quirin, 2015; Lester, 2014; Man & Rosentraub, 1998; Merriman, Skidmore, & Kashian, 2008; Smith, 2006, 2009; Weber, Bhatta, & Merriman, 2003; Weber, Bhatta, & Merriman, 2007; Yadavalli & Landers, 2017). The same is true of studies specifically examining the relationship between blighted conditions and TIF performance in Chicago.
Byrne (2006) proclaimed that “TIF districts in blighted areas are also successful” (p. 327) based on the positive and significant coefficients of median age of property and vacancy rates in the full model estimating changes in property values. Vacancy rates, however, did not perform at a level of statistical significance in Kane and Weber’s (2016) analysis of expenditures and property value growth of Chicago TIFs. Carroll and Eger (2006) presented positive findings that are conditional. The authors argued that TIFs can be an effective tool for increasing property values in neighborhoods overwhelmed by crime and brownfields, but the “maximum level of TIF equalized value,” must occur to reverse the negative effects associated with these conditions. Without targeted government intervention as well as tremendous investment efforts, the likelihood of property values increasing in blighted TIFs diminishes considerably. However, Byrne (2010) and Lester (2014) provided evidence that TIFs do not facilitate more job opportunities and employment levels, particularly in blighted districts. According to Lester (2014), Chicago’s TIFs failed to “catalyze private actors to invest in distressed neighborhoods” (p. 665). The purpose of Chicago TIFs centers on alleviating blight, yet many doubt its effectiveness to facilitate growth in blighted communities.
The state legislation authorizing Chicago’s use of TIFs districts, Tax Increment Allocation Redevelopment Act (1971), emphasizes the need to direct economic development efforts toward communities that “are rapidly deteriorating and declining and may soon become blighted areas if their decline is unchecked.” As per policy, the state considers actual or potential deterioration as problematic to the “health, safety, morals, and welfare of the public.” In earlier years, TIFs existed primarily in Chicago’s distressed communities (Gibson, 2003). Chicago, like many other cities, relaxed the blight standard to include “obsolete” property weakening the stringent application requirements (Briffault, 2010; Byrne, 2010; Chapman & Gorina, 2012; Johnson, 1999; Kane & Weber, 2016; Lester, 2014). Some argue that TIF experienced a process of neoliberalization, with cities redirecting development efforts to areas more attractive to private investment given the potential for higher gains in less time (see Gordon, 2004; Lester, 2014; Weber, 2002). TIFs in Chicago morphed into an “all-purpose local government tool financing public investment in market-oriented development” (Briffault, 2010, p. 72). As a result, many TIF districts do not bear much resemblance to conventional notions of blight and contain central business districts, corporate complexes, entertainment districts, college and university campuses, and waterfront developments, as well as luxury housing and other high-valued property.
Before attracting new businesses and homeowners, a TIF must be prepared to receive the new investments. In comparison with nonblighted TIFs, severely blighted TIF districts require more resources (time and investments) to support development and growth (Briffault, 2010; Dye & Sundberg, 1998; Gordon, 2004; Huddleston, 1982). Regardless of the public subsidy, blighted TIFs bear the stigma associated with blight, which fuels private investors’ concerns about an increased risk associated with the return on their investments (Briffault, 2010; Dye & Sundberg, 1998; Sands, Reese, & Trudeau, 2007). The negative perceptions make it difficult for blighted areas to attract the capital needed to grow their local economies (Adair, Berry, & McGreal, 2003; Briffault, 2010; Lester, 2014). Without strong municipal financial support and a competitive advantage over less blighted areas in pursuing private investment, blighted TIFs struggle greatly (Briffault, 2010; Chapman & Gorina, 2012; Dye & Sundberg, 1998; Kane & Weber, 2016).
In Chicago, critics echo many scholars’ concerns regarding the performance of TIF in areas fitting the conventional ideas of blight, especially the TIFs with higher proportions of non-White residents (Jorvasky, 2015; Jorvasky & Dumke, 2015; McGhee, 2016; Spielman, 2015). Chicago-based studies also show evidence of a statistically significant negative relationship between TIF performance and existence of non-White residents (Byrne, 2006; Weber et al., 2003). Byrne (2006) argued that these results could be interpreted as a sign of discrimination in the housing market. A lower willingness of businesses and residential buyers and renters to move into a minority or racially mixed TIF would temper the effect of public improvements on property value growth.
Despite the lack of clarity on the direction of the relationship between blight and TIF performance, the broader literature suggests that blight may present serious obstacles for growing property values. A stronger presence of racialized groups may exacerbate this potentially negative correlation between blight and change in properties’ EAV, as claimed by opponents of Chicago’s TIF program. In the present analysis, we purport to test whether TIF facilitates growth in blighted areas and if the proportion of non-White residents in the district impacts the relationship between blight and growth. Previous studies test systematic variations in TIF performance using individual indicators of blight (e.g., employment levels and vacancy rates). We, however, examine blight in a community with a composite index that aggregates individual blight indicators to provide an overall assessment of the TIF districts’ blighted conditions. We also inquire about variations in the performance of TIFs while accounting for the interaction between a district’s racial composition and blight score.
Data and Methodology
In this study, the data set consisted of TIF districts with designation dates before 2009 and existed in 2013 (N = 134). We selected this date range because it occurred immediately before Mayor Rahm Emanuel approved the cancellation of several overperforming TIFs. The findings of the present analysis could offer justification for Mayor Emanuel’s efforts to increase the city’s focus on underperforming TIFs.
We used the city of Chicago’s online Data Portal to download shapefiles of the TIF districts as well as collect information on TIFs’ purpose and activities. Financial reports (2009-2013) for the TIFs were available on the Cook County Clerk’s website. We collected data on the demographics of Chicago’s block groups from the 2013 American Community Survey (5-year estimate).
The blight measure presented in this study normalizes blight characteristics to provide a measure that improves comparability across disparate spaces. Scholars, policy practitioners, and local governments have relied on the intercity hardship index, also referred to as the urban hardship indicator, to evaluate city-level economic blight (Nathan & Adams, 1976, 1989). Several class studies of economic hardship relied on a variant of this index to examine distress among minorities (Coleman, Brudney, & Kellough, 1998) and draw comparisons across metropolitan areas (Bradbury, Downs, & Small, 1982) and cities (Parker, 1985, 1997). For this study, the factors included in the original hardship indicator represent traditional measures of distress and were separated to calculate economic and physical blight scores for Chicago’s TIFs. Broadly defined, the term blight denotes the consistent physical deterioration of property and economic decline. Both forms of blight generally coincide with depreciating real property values.
The first measure, economic blight, included the unemployment rate (within the civilian population older than 16 years), dependency rate (percentage of the population that is younger than 18 years and older than 64 years), per capita income, and poverty rate (percentage of people living below the federal poverty level). We calculated the physical blight score using three factors: crowded housing (the percentage of occupied housing units with more than one person per room), housing vacancy rate, and median housing value. The factors included in the blight scores often share strong correlations. The use of a composite index aids in reducing the potential for multicollinearity, which could reduce the accuracy of the estimated models. While the use of individual blight factors provides insight into their specific effect on TIF performance, the presented indices help understand the constructs of economic and physical blight while accounting for the important and interrelated blight factors.
Following the process laid out by Nathan and Adams, we calculated blight scores at the block-group level using census data. In comparison with census tracts, block groups represent smaller geographic units and facilitate the investigation of finer distinctions in blight across neighborhoods with the TIF. For each factor within the index, we calculated a ratio with the block-group-level value in the numerator and the city-level value in the denominator. We standardized the ratios and adjusted them to a scale of base 100, which ensured that each factor accounted for equal weight in the index score. We recoded the minimum and maximum values of the original ratio to range from 0 and 100. All other values were standardized using the following formula: X = ([Y − Ymin]/[Ymax − Ymin]) × 100, where X = standardized ratio, Y = block-group level to city-level ratio, Ymin = minimum value of Y, and Ymax = maximum value of Y. For each block group, the sum of these values was calculated and then divided by the number of factors included in the index.
The second step in calculating district-level blight involved the use of ARC GIS spatial analysis software. We performed the spatial join and identity functions to (a) identify all block groups overlapping the geographical boundaries of each TIF district and (b) the proportion of land that the block group constituted within the TIF district. We multiplied these block-group-level scores by the percentage of area within the TIF district that contained the block group. We then aggregated the blight scores for all block groups in the district to calculate the TIF-level blight. Other studies considered a block group “TIFed” if 50% or more of the population resided within the TIF (Lester, 2014). TIF districts are irregularly shaped and include several communities that vary in demographics, culture, land use, local economy, and real property values. The measure utilized in this study better accounts for the vast diversity of TIF communities and their proportionate influence on the activities and performance of the districts.
The financial reports downloaded from the Cook County clerk’s website included information on each TIF’s frozen assessed valuation (at designation) and EAV of property (in 2013 or time of expiration/cancellation). The dependent variable in this study, change in EAV, represented the percentage of change in these two values. This variable measured the level of growth in property values after the creation of the TIF. The research question also necessitates a predictor variable that represents the interaction between blight and percentage of non-White residents. For this reason, the model included two interaction terms: physical blight × race and economic blight × race.
The data did not fit the assumptions of standard least squares regression, particularly the existence of outliers, nonnormal distribution of error terms for the outcome variable, and nonlinear relationships between the outcome and predictor variables. This prompted the use of quantile regression analysis or QRA, which provides more robust estimates in these instances (Goertz, Hak, & Dul, 2013; Rosenberg, Knuppe, & Braumoeller, 2017). Following traditional methods, we estimated the models at the 25th percentile, median, and 75th percentile of the outcome variable change in EAV. The term quantile in QRA references the positioning of the regression line rather than the subset of observations analyzed in each model. In fact, each regression includes all observations in the data set. However, estimating a 25th quantile regression model involves fitting a line through the data in a manner such that 25% of the observations are below the regression line, while the other 75% of the data points exist above the line. Differences in the slopes of the quantile regression lines signify variations in the estimated relationships at different levels of TIF performance.
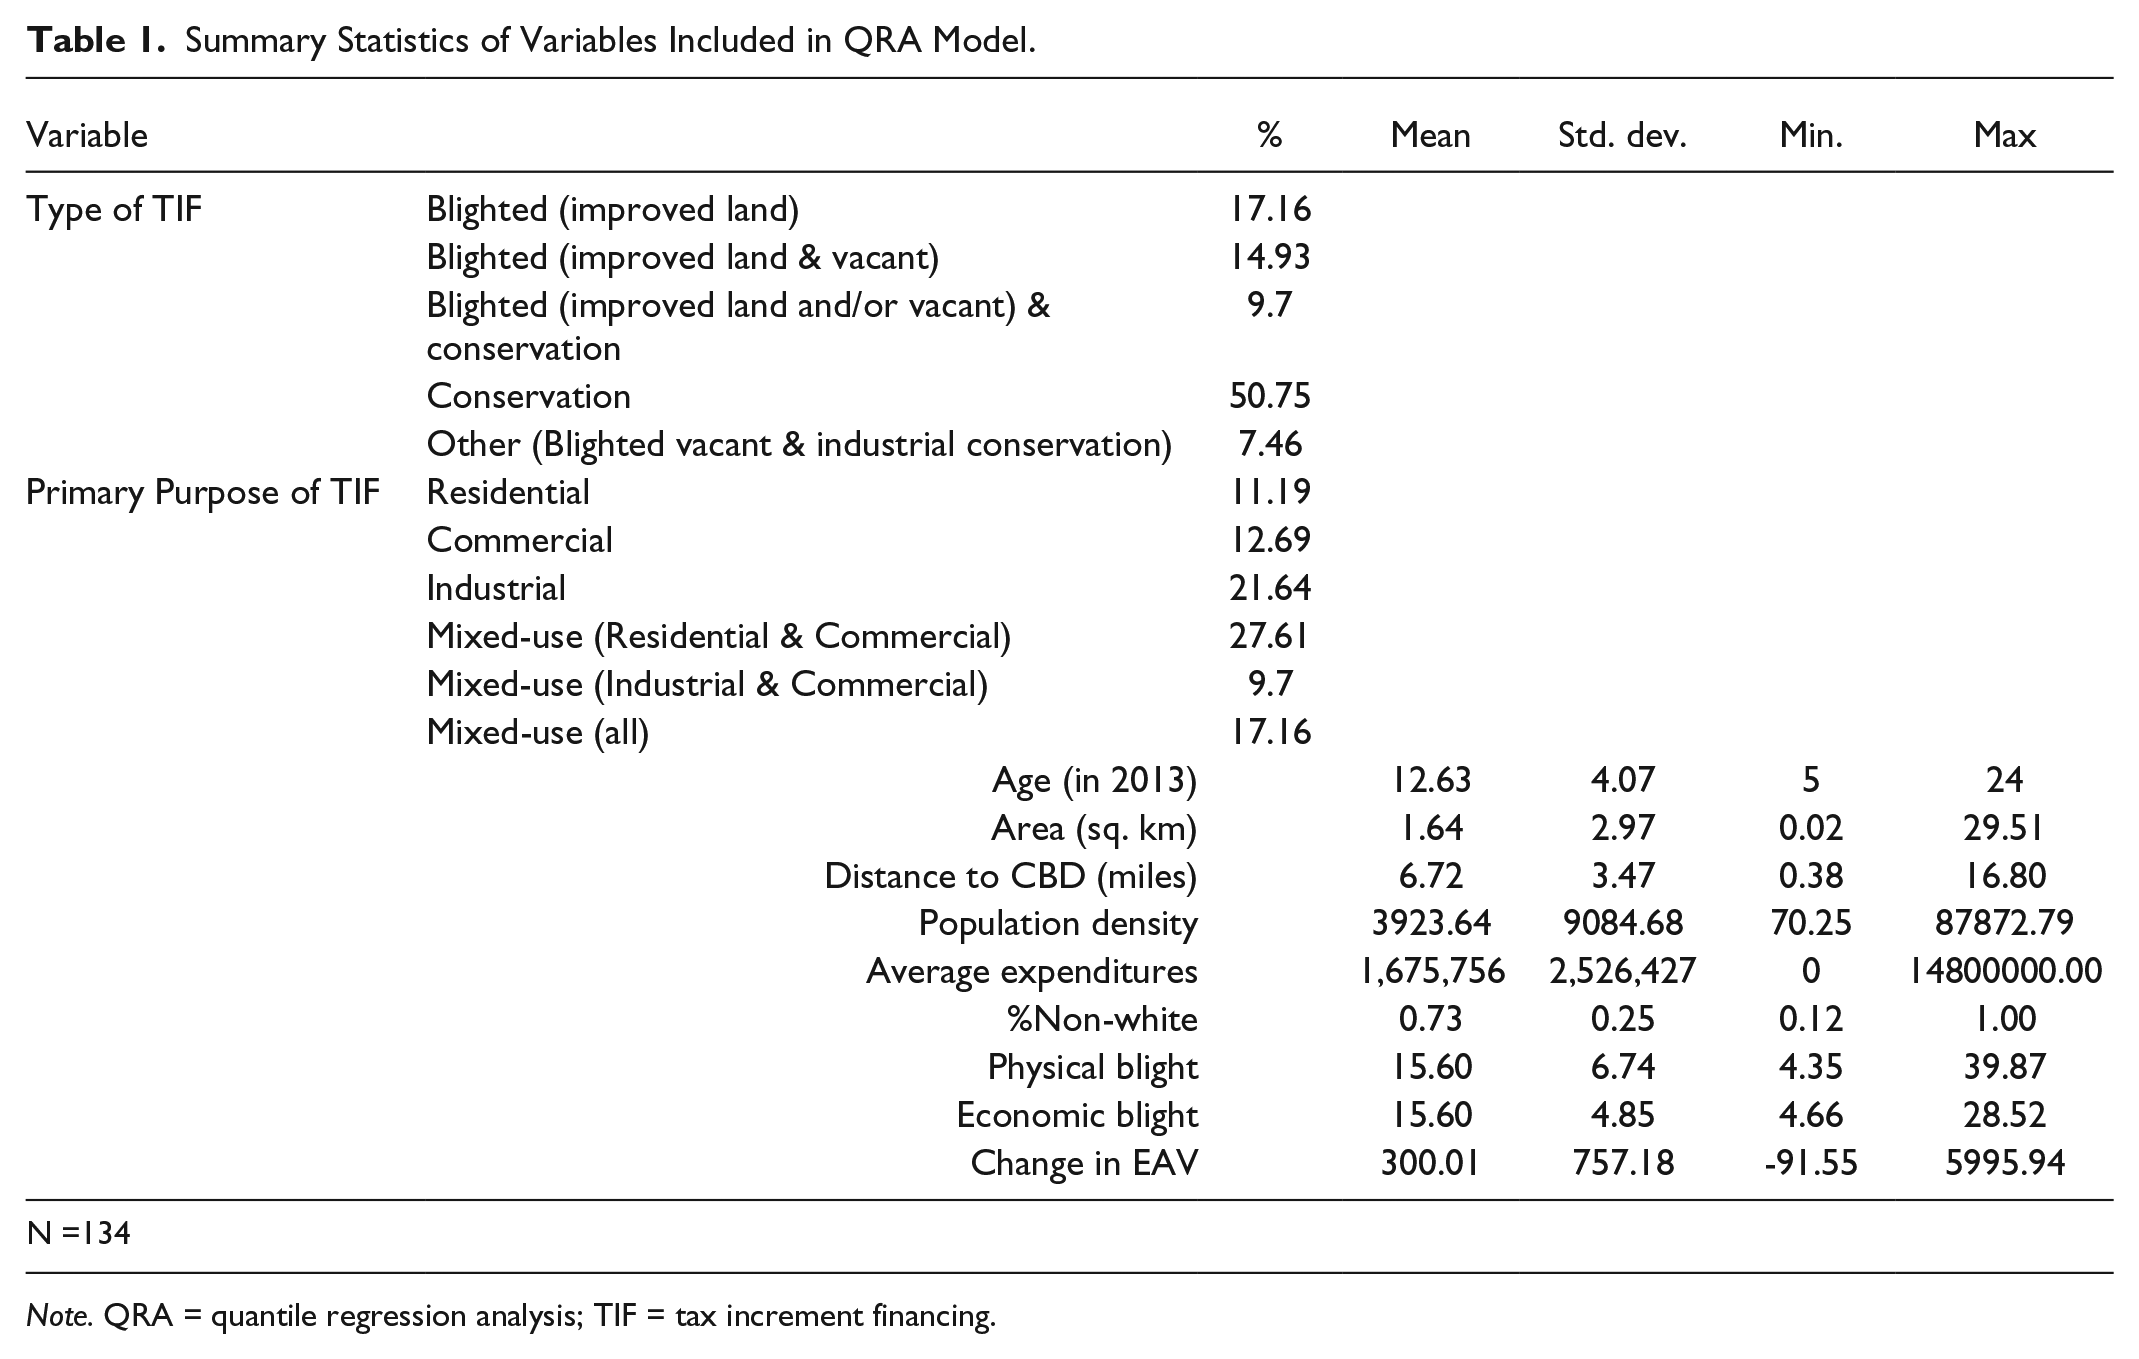
In the literature, scholars consistently cite five factors as strong determinants of TIF performance. We incorporated several explanatory variables into the regression models to control for their effect. This includes TIF attributes (type, primary purpose of land usage, size of TIF, age in years, and distance to central business district in miles), TIF activities (average project-related expenditures from designation until 2013), and area demographics (population density and percentage of non-White residents; see Table 1).
Summary Statistics of Variables Included in QRA Model.
Note. QRA = quantile regression analysis; TIF = tax increment financing.
Findings
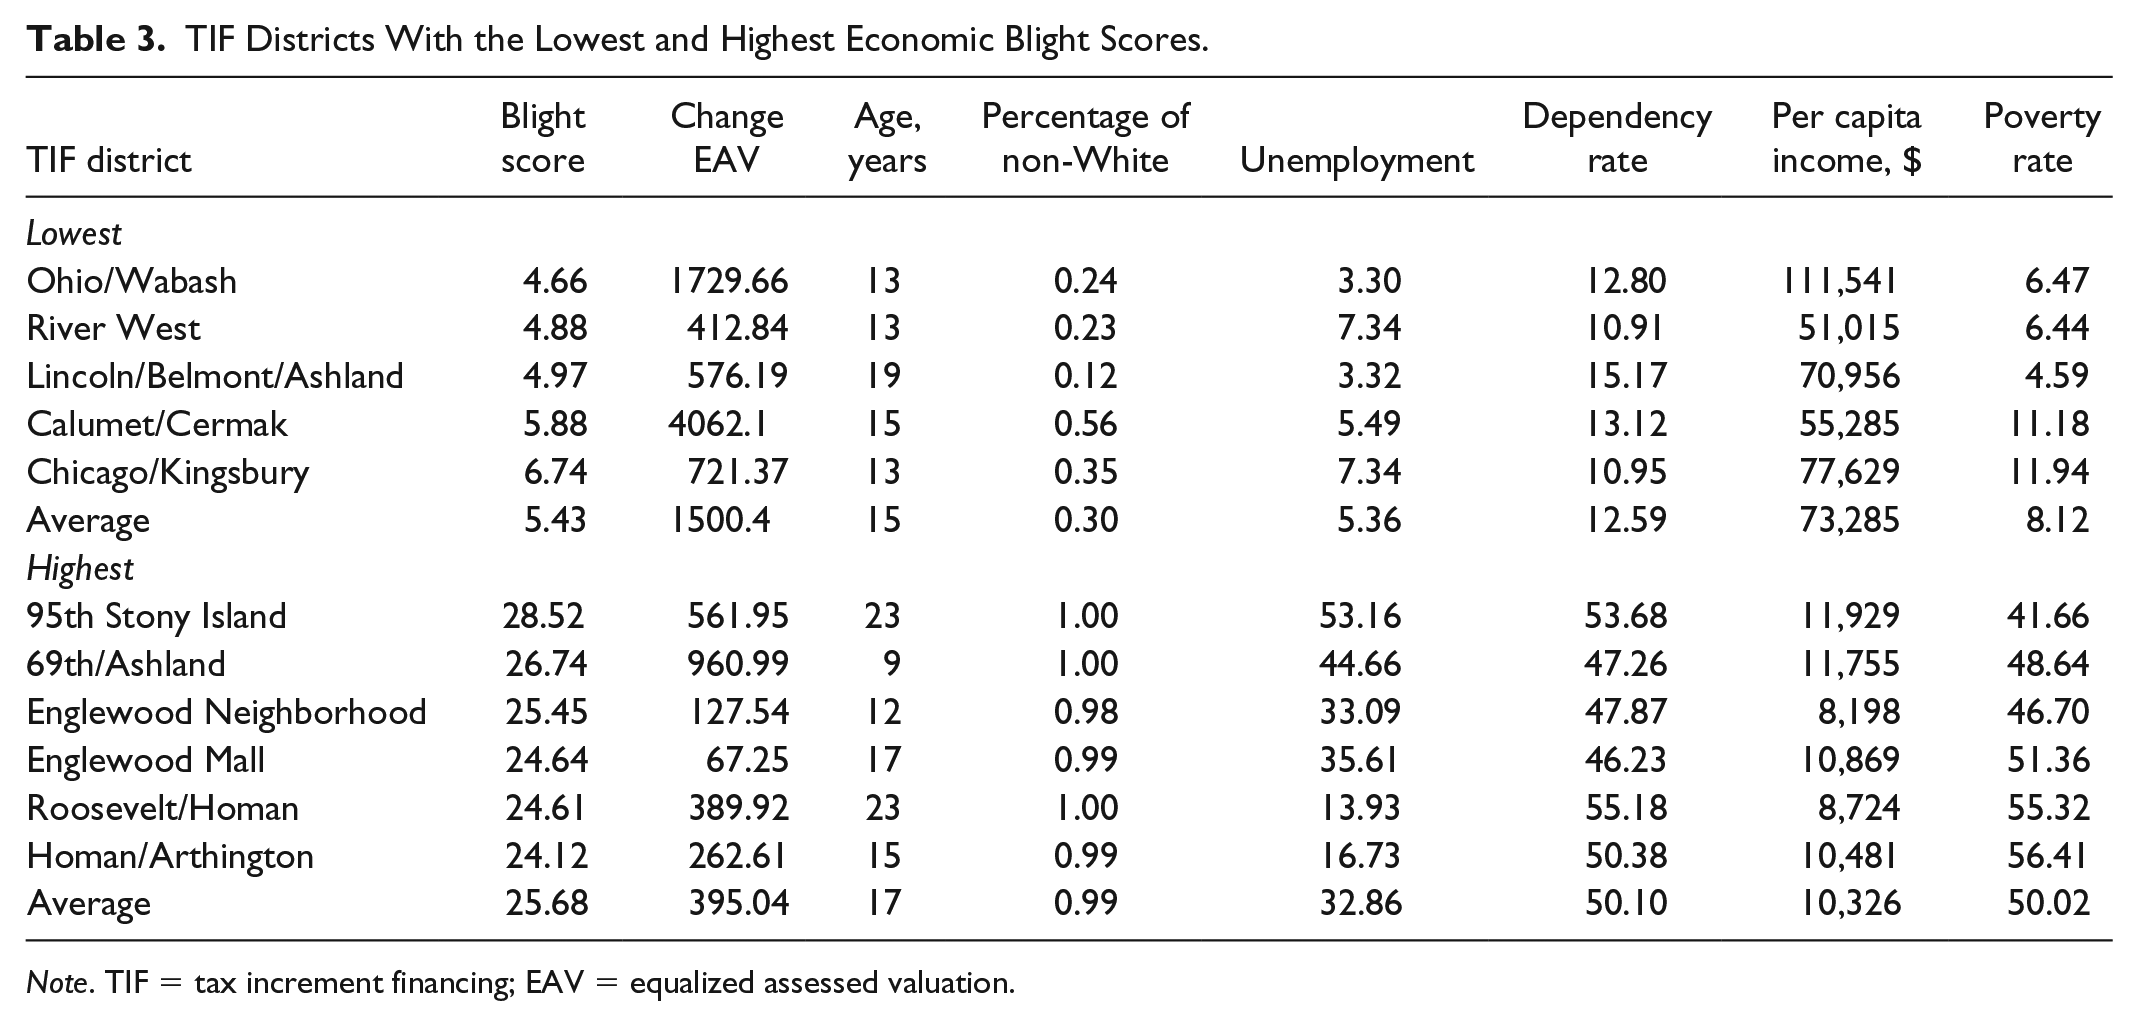
The distribution of physical and economic blight varied substantially across Chicago’s TIF districts. The physical blight index score ranged extensively from 4.35 to 39.87. On average, the property-based blight scores in the districts equaled 15.60 with a standard deviation of 6.74. The economic blight index scores ranged from 4.85 to 28.52 and averaged 15.60 (standard deviation = 4.85). The results of a Pearson correlation, r(134) = 0.592, p < .001, indicated that higher levels of physical blight and economic blight largely affected the same communities. Tables 2 and 3 list the values of the individual blight indicators for the most and least blighted TIF districts. As expected, heightened blight scores existed within TIFs displaying more concerning values for the individual blight factors.
TIF Districts With the Lowest and Highest Physical Blight Scores.

Note. TIF = tax increment financing; EAV = equalized assessed valuation.
TIF Districts With the Lowest and Highest Economic Blight Scores.
Note. TIF = tax increment financing; EAV = equalized assessed valuation.
Blight also overwhelmingly affected TIF districts in which non-White residents composed a large majority of the community, while majority-White populations resided in the least blighted TIFs. The results of the Pearson correlation, r(134) = 0.682, p < .001, signified a large correlation between physical blight and minority populations. Economic blight and percentage of non-White residents, r(134) = 0.823, p < 0.000, shared a stronger correlation. The proportion of non-White residents surpassed 90% in all TIF districts with the highest blight scores, while this value did not surpass 56% in the TIFs with the lowest blight scores.
Figure 1 displays the distribution of the outcome variable, change in EAV, in Chicago’s TIFs. On average, property values increased by 300% with a standard deviation of 757.17%. The change in EAV variable ranged from −91.55% to 5995.94%. We excluded 14 TIF districts from the study because that they presented uninterpretable values for the outcome variable. Given that their frozen valuation equaled zero, the percentage of change value approached infinity. Of the 134 districts included in the statistical analysis, 15.67% of the TIFs experienced negative growth. The TIF districts with changes in EAV in the middle 50% saw their property values grow from 19.78% to 224%. The top 10% of the TIF districts saw their property values increase substantially with a change in EAV higher than 721%. The TIFs in the top 5% exhibited growth that ranged between 1277% and 5996%.

Change in EAV for Chicago TIF Districts (TIF designation to 2013).
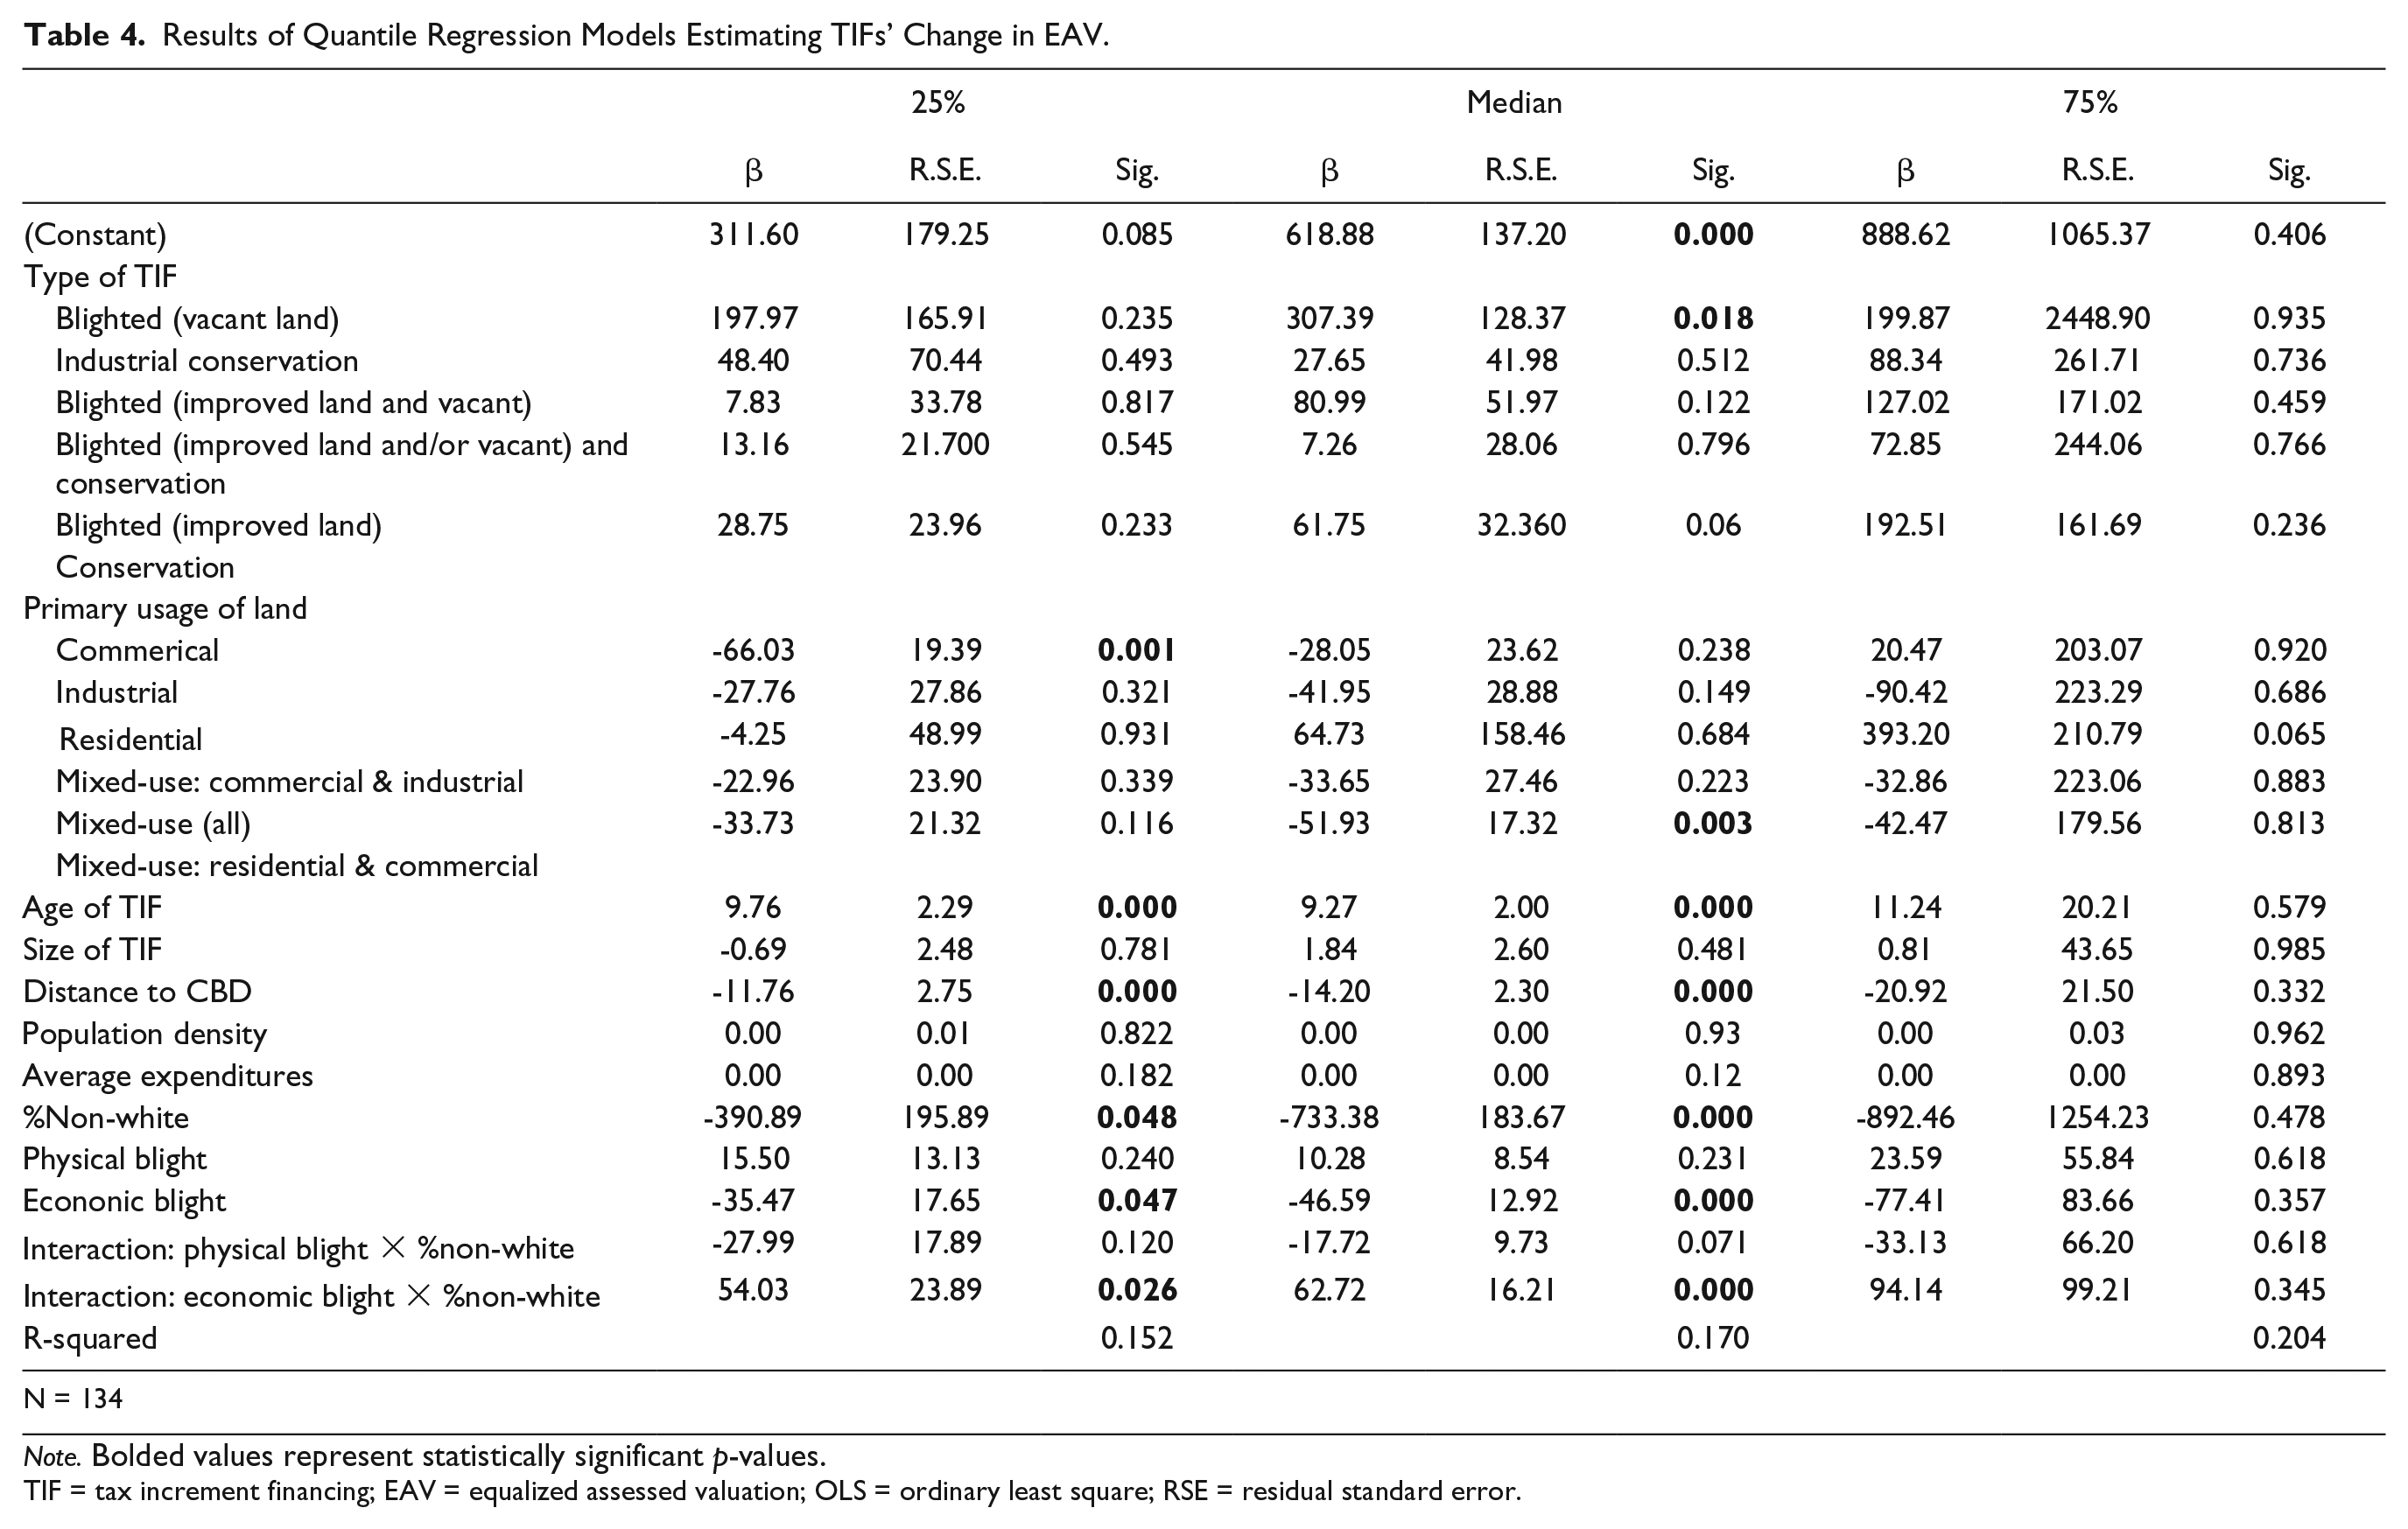
Table 4 reports the results of the quantile regression models estimating the change in EAV at three different levels of the outcome variable: 25th percentile, median, and 75th percentile. Although the 75th percentile model fits the data the best with an R2 of .204, none of the predictors performed at a level of statistical significance in the 75th percentile model, whereas several variables in the other quantile models displayed p values less than .05. The median and 25th percentile models presented lower R2 values of .170 and .152.
Results of Quantile Regression Models Estimating TIFs’ Change in EAV.
Note. Bolded values represent statistically significant p-values.
TIF = tax increment financing; EAV = equalized assessed valuation; OLS = ordinary least square; RSE = residual standard error.
The results of the estimated model indicated that a community’s racial composition presents a larger obstacle for TIF performance in comparison with both forms of blight. In the 25th percentile and median model, percentage of non-White performed at significant levels with negative coefficients (β = −390.89, p = .048 and β = −733.38, p = .000). Given its inclusion in the interaction terms, these coefficients represent the conditional effects of the percentage in non-White variable. The physical blight × race interaction term did not perform at a level of statistical significance. Thus, the slope of percentage of non-White (b1) represents a function of the terms included in the economic blight × race interaction term (b3). To calculate the change in the outcome variable associated with a one unit change in the percentage of non-White variable, we used the formula b1 + b3 × 2 (Weinberg & Abramowitz 2016, p. 515). At one standard deviation below the mean economic blight score, a 1% increase in percentage of non-White correlates to a reduction in change in EAV equal to 59.14% in the median model. This changes to a positive value of 549.24% at one standard deviation above the mean economic blight score. These results run counter to expectations. In TIF districts with lower economic blight scores, a negative correlation exists between the proportion of non-White residents and growth in property values. This relationship, however, changes at higher levels of economic blight, where increases in percentage of non-White correlate to positive changes in EAV.
The economic blight predictor variable also presented a statistically significant coefficient in the lower quantile and median model (β = −35.47, p = .047 and β = −46.59, p = .000). As stated, the relationship between economic blight and change in EAV depends on the extent to which the people of color live in the TIF district. According to the median model, a one-unit increase in the economic blight score correlates to a 16.48% decrease in change in EAV in TIFs where the percentage of non-White residents equals 48% or one standard deviation below the mean. In districts with non-White populations equal to 98% (+1 standard deviation), increasing the blight score by one unit correlates to an increase in the outcome variable equal to 14.88%. The findings support expectations, but only at lower levels of percentage of non-White.
The economic blight × race interaction term displayed a positive coefficient in all three quantile models and performed at a level of statistical significance in the 25th percentile and median model (β = 54.03, p = .026 and β = 67.72, p = .000). To interpret these findings, we generated marginal effects graphs (see Figure 2) in which we plotted the relationship between physical blight and change in EAV while holding percentage of non-White constant at three values: −1 standard deviation, mean, and +1 standard deviation. The marginal effects graphs for the two significant quantile models indicate that when percentage of non-White equals −1 standard deviation, the interaction between economic blight and race is negatively correlated to change in EAV as expected. In the median model, the relationship evokes a positive change in the output variable at percentage of non-White levels slightly above the mean of 72% and a lesser value of 48% in the lower quantile model.
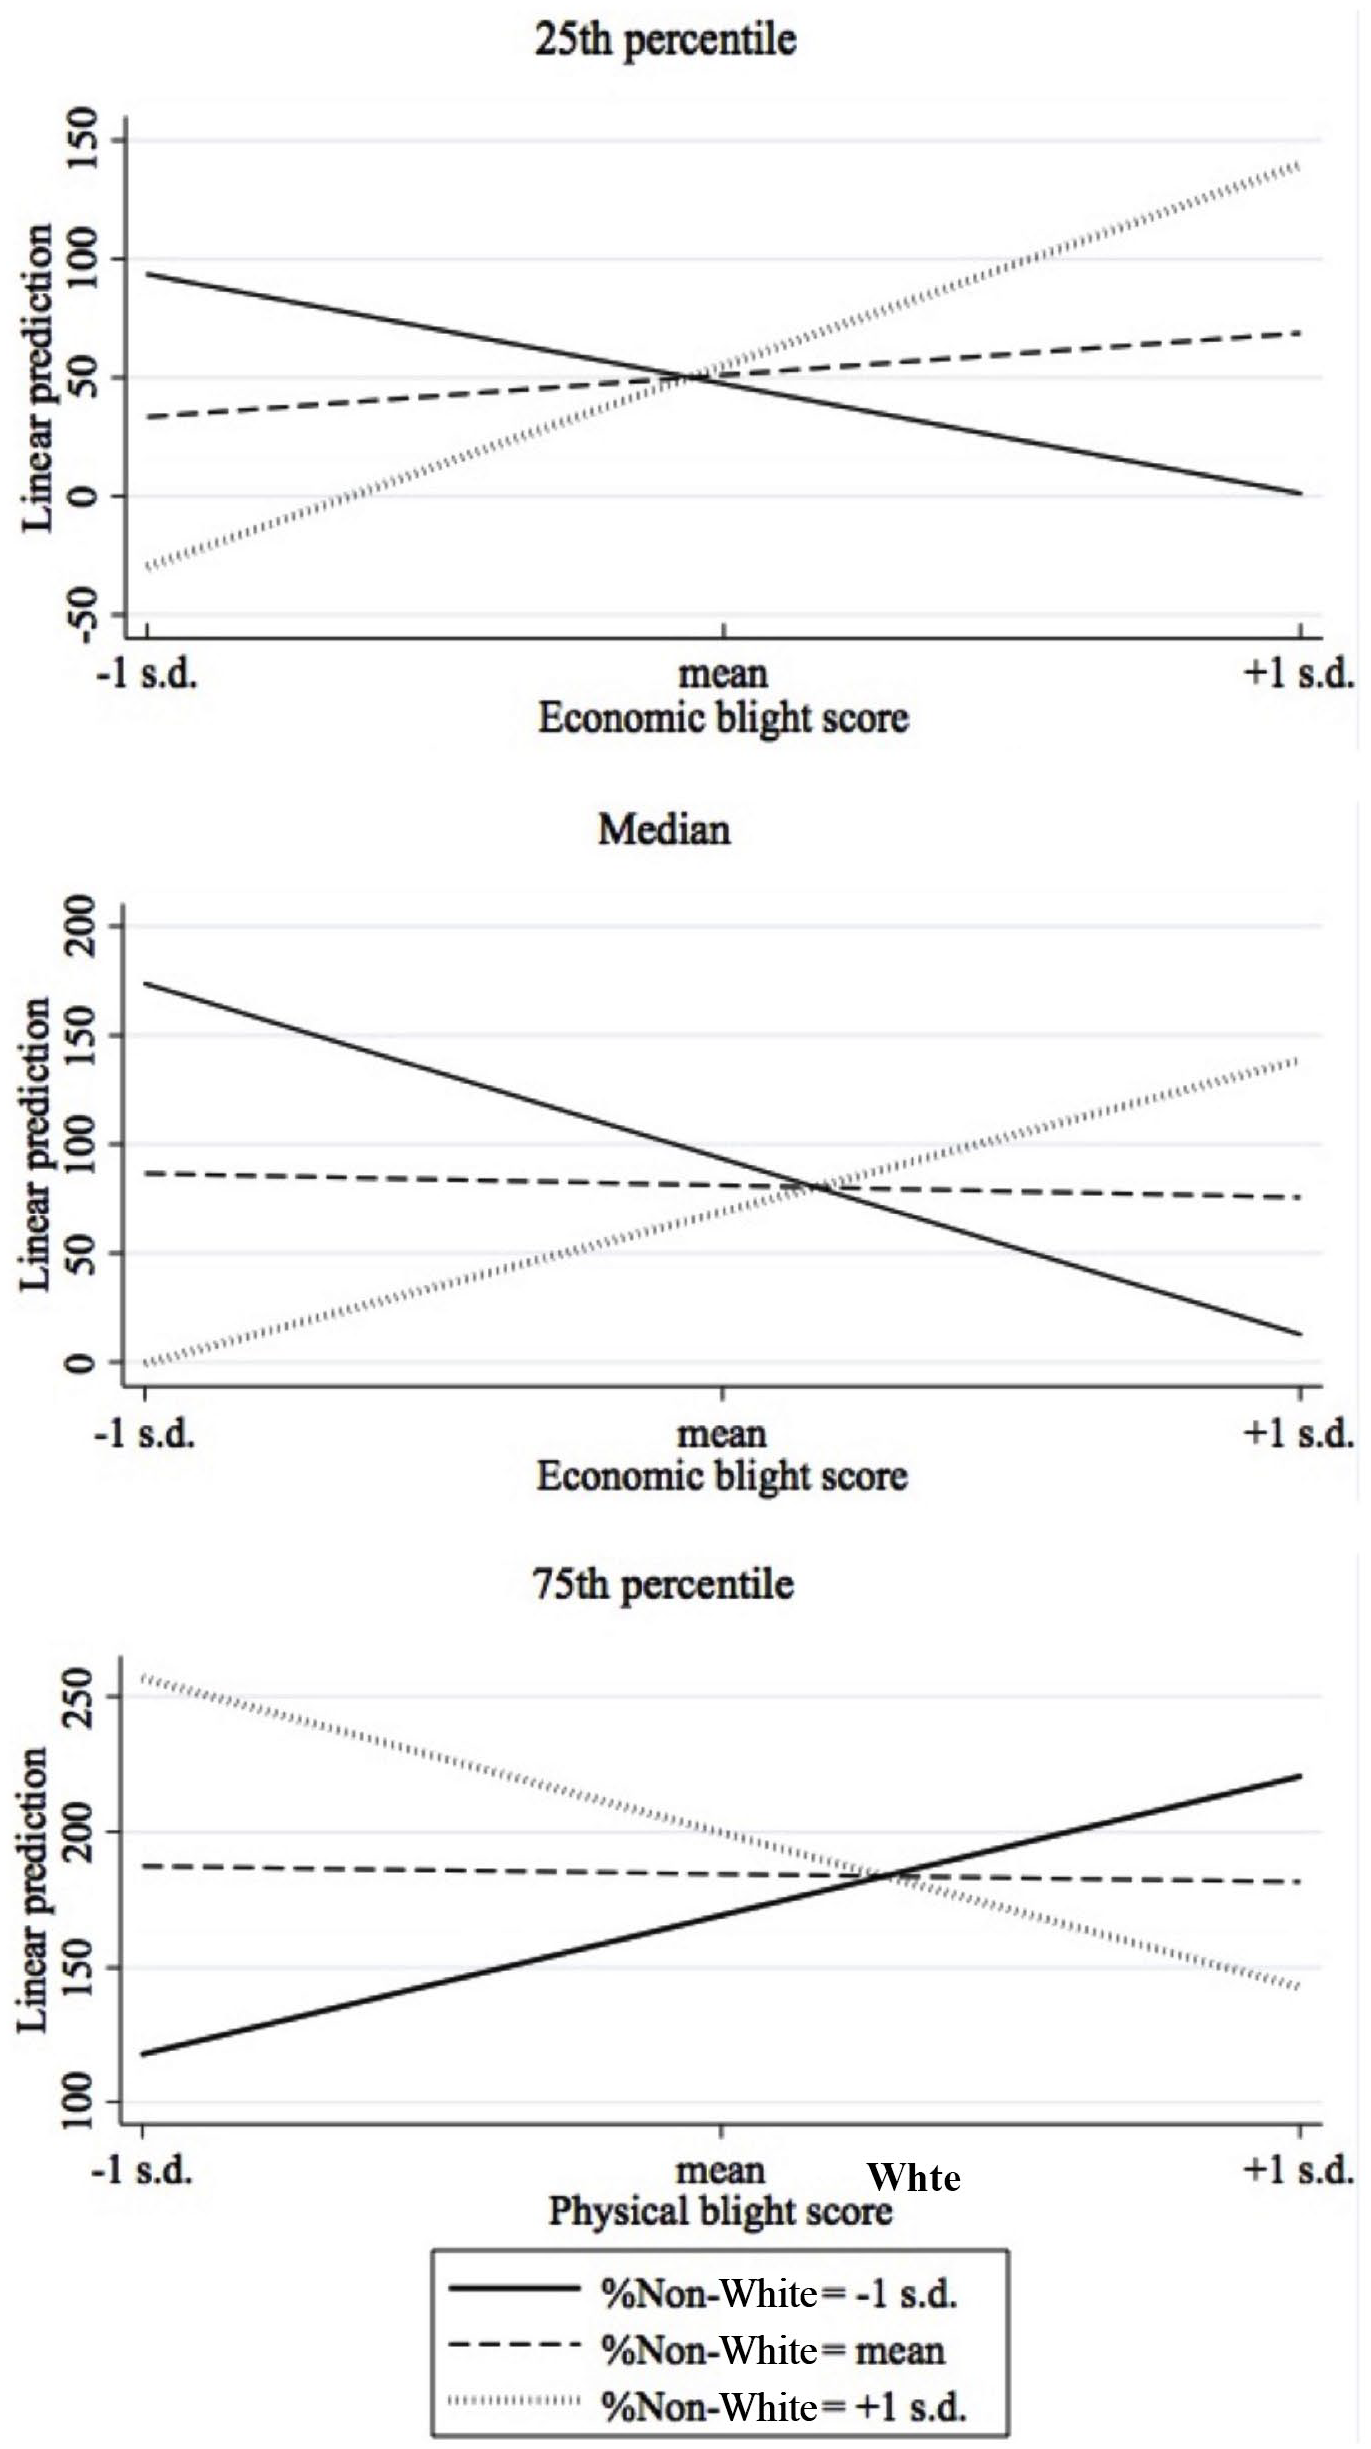
Marginal effects (economic blight × percentage of non-White).
The physical blight variable did not exhibit significant p values and presented positive coefficients in the three quantile models. The physical blight × race interaction term approached statistical significance with a p value equal to .071 (β = −17.72) in the median model. The marginal effects graphs shown in Figure 3 indicate that increases in the presence of people of color reverses physical blight’s positive correlation with TIF performance. Although insignificant, these findings support expectations that the combined effect of physical blight and residents of colors correlate to lower levels of growth in TIF districts.
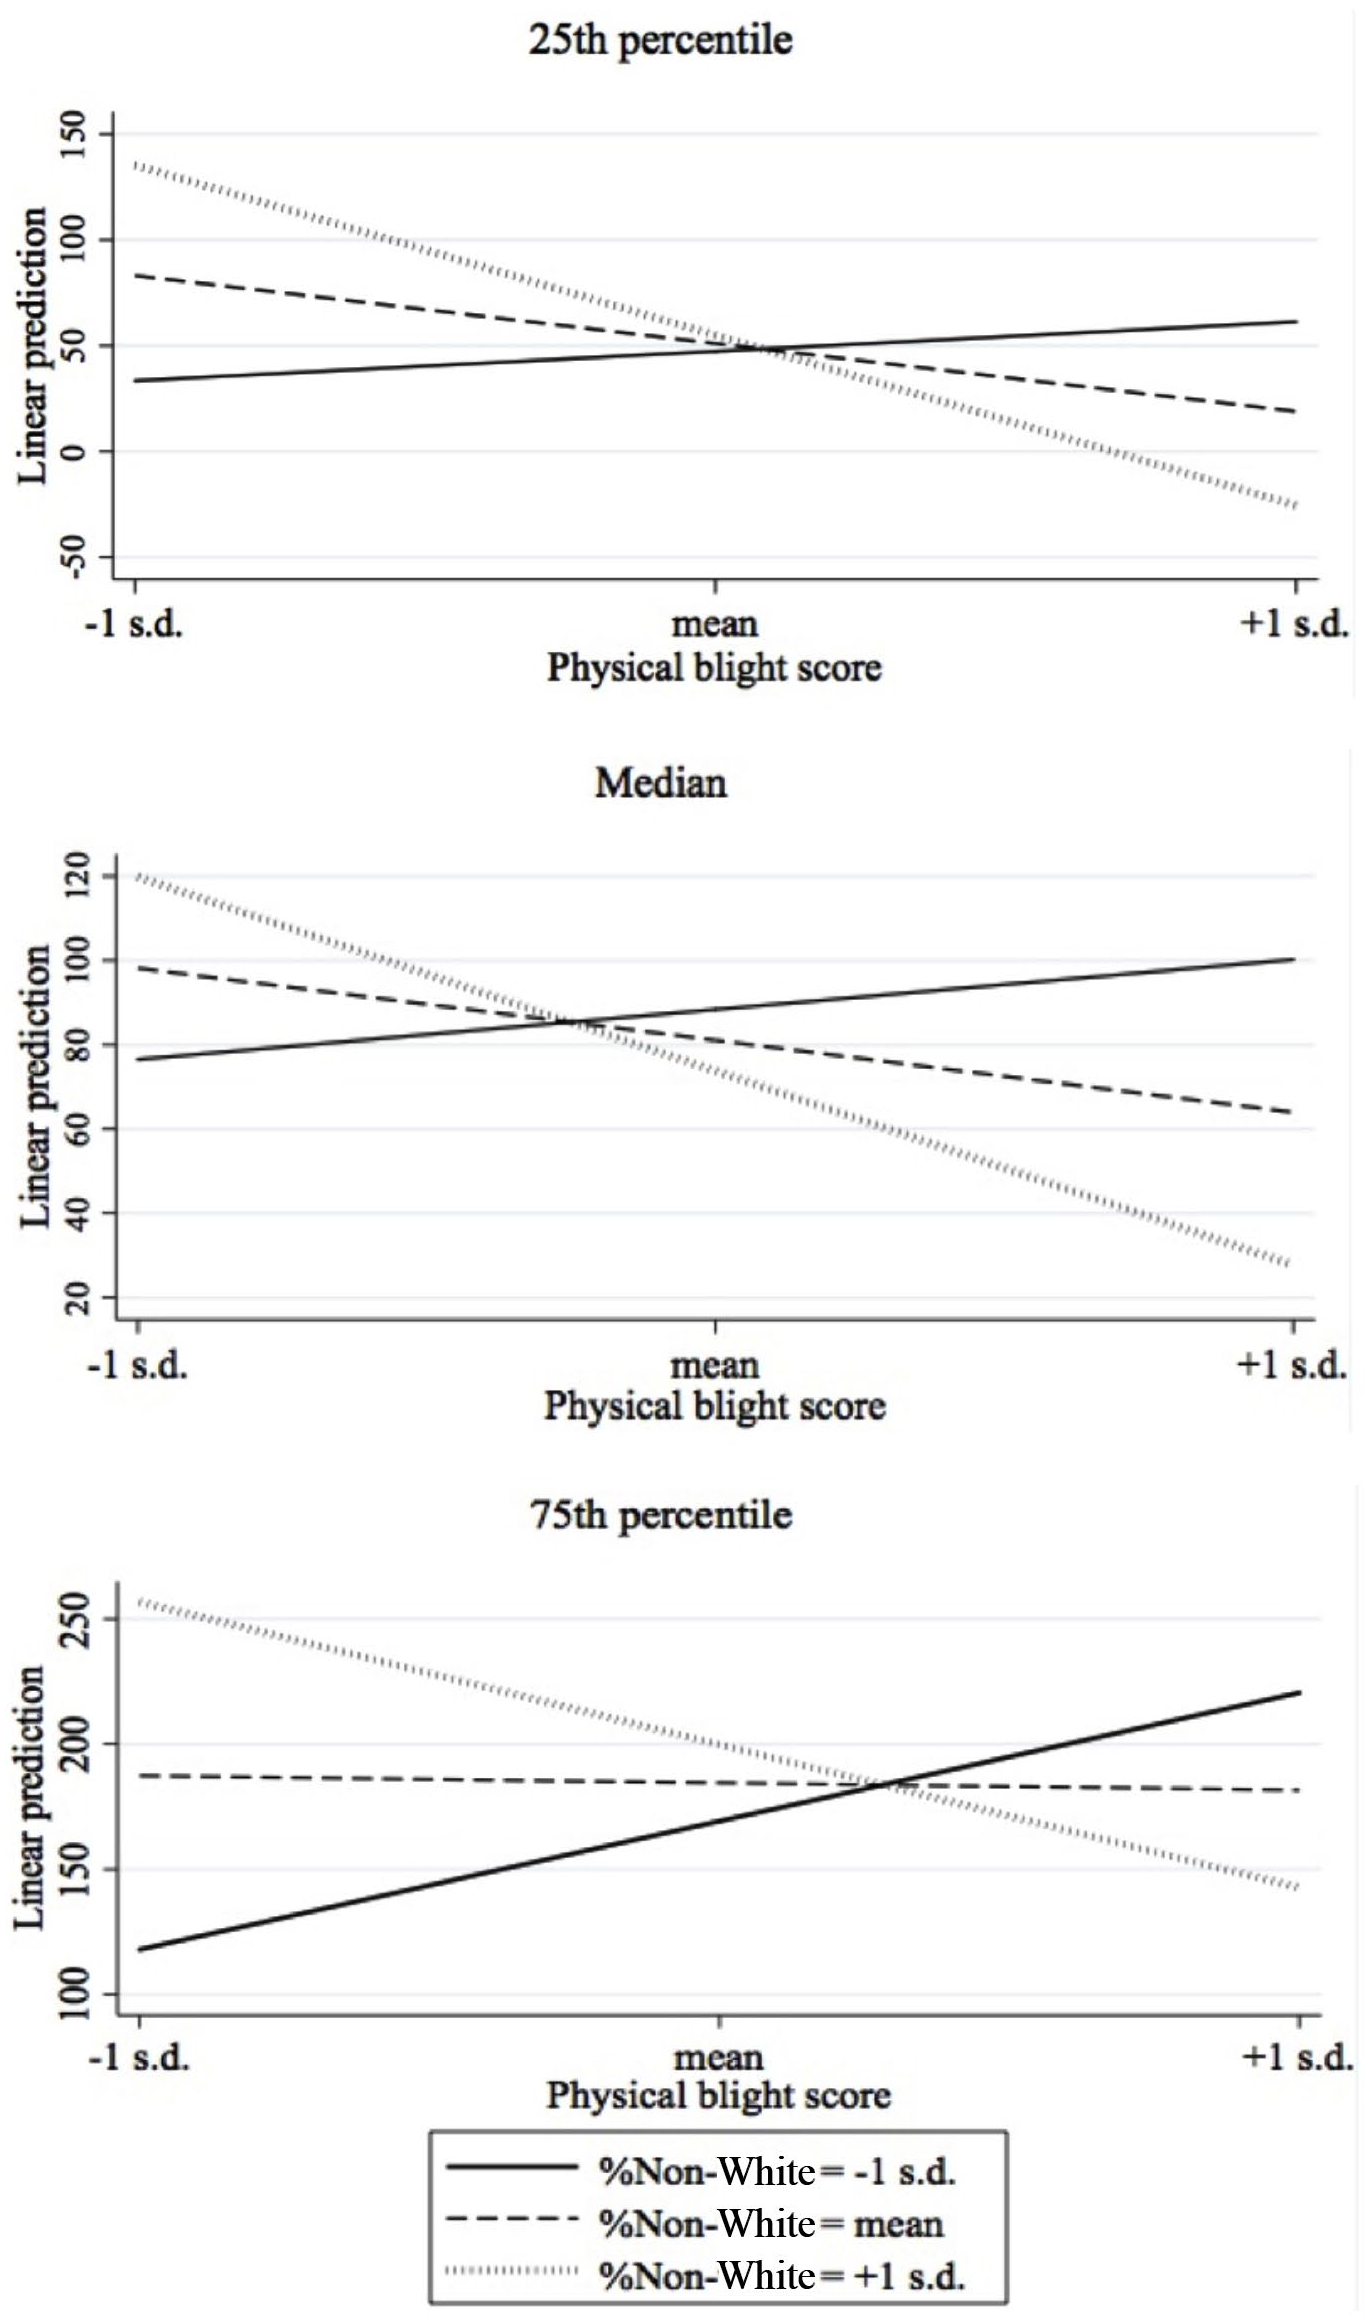
Marginal effects (physical blight × percentage of non-White).
Four control variables (type of TIF, primary usage of land, age of TIF, and distance to central business district) performed at levels of statistical significance. In the median model, the blighted (with vacant land) TIFs experienced an increase in change in EAV equal to 307.39% (p = .018) in comparison with conservation TIFs. Blighted (with improved land) TIFs also secure higher levels of growth than the conservation TIFs, but only approached statistical significance (p = .06). Regarding the primary usage of land in the TIF district, the reference group, mixed-use (residential and commercial) districts, shared positive correlations with TIF performance when compared with most of the other categories. In the median model, only the mixed-use (residential, commercial, and industrial) TIFs presented a significant p value of .003 and correlated to a 52% decrease in property values. In the 25th percentile model, commercial TIF districts (β = −66.03, p = .001) differed significantly from the mixed-use (residential and commercial) TIFs.
Age of TIF (in years) and distance to the central business district (in miles) presented statistically significant coefficients in the 25th percentile and median model. In both quantile regression models, a 1-year increase in the age of a TIF correlated to an increase in change in EAV equal to 9% to 10% (p = .000). On the contrary, a 1-mile increase in the distance between TIF districts and Chicago’s downtown correlated to decreases in property value growth equal to 12% (25th percentile) and 14% (median) at a level of statistical significance of p = .000.
Blight, Race, and the Performance of TIFs
The statistical analysis conducted in this study purported to examine whether blight (physical and economic) correlates to decreased growth, measured as percentage of change in the EAV of property, within TIF districts and if this relationship varied in TIFs with larger proportions of non-White residents. The results show that physical and economic blight occur simultaneously within TIF districts and TIFs with more residents of color exhibit heightened levels of both forms of blight. These findings support the argument that communities of color suffer from more concentrated blight, thereby increasing the likelihood that the neighborhood would have trouble in attracting private investments, which reduces the likelihood of growth in property values. Previous studies also provide evidence of blight and non-White residents correlating to depressed property values in TIFs (Adair et al., 2003; Briffault, 2010; Byrne, 2006; Dye & Sundberg, 1998; Gordon, 2004; Lester, 2014; Weber et al., 2007).
Physical blight did not play a significant role in facilitating or hindering growth in TIFs unless people of color constituted a sizeable majority of the TIFs’ population. While these findings support the presented argument that communities of color experience more difficulty in attempting to overcome blight, the higher p values on the physical blight × race coefficient weakened this claim. However, the other interaction term did perform at a level of statistical significance in the full model but provided results that ran contrary to expectations.
The positive correlation between economic blight and racial composition along with the negative correlation that both factors share with change in EAV would lead one to expect the interaction between blight and percentage of non-White variables to also result in lower rates of growth. The results of the estimated quantile regression models, however, provide mixed support for this line of thinking. In support of our arguments, the findings indicated a negative rate of growth in property values for TIF districts with more people of color. This relationship, however, was limited to districts that exhibited lower economic blight scores. Economic blight also shared a negative correlation with change in EAV, but only at lower levels of percentage of non-White. Increasing the value of one predictor variable (percentage of non-White or economic blight) reversed the negative correlation between the other predictor variable and the output variable. In effect, TIFs appear to function exceptionally well in communities simultaneously exhibiting higher levels of economic blight and residents of color, which contradicts expectations.
Several economically blighted and predominantly non-White TIF districts reported decreases in their EAV, while many exhibited extraordinary increases in property values. Of the 63 TIF districts with economic blight scores and percentage of non-White residents above the means, the change in EAV ranged from −68.48% to 5995.94%. Within this subset of TIFs, 10 districts endured negative rates of growth and 10 districts experienced changes in EAV greater than 390%, with six exhibiting growth rates of above 1000%. According to the arguments presented in this study, TIFs with predominantly minority populations and inundated with poverty should be the least effective in growing property values. While these particular TIFs remain severely blighted, which supports expectations, many of them simultaneously demonstrated the most growth as measured by property values. No studies, however, explain how a community can simultaneously experience heightened levels of property value growth and blight.
Arguably, these findings are an artifact of the dependent variable, percentage of change in EAV. Percentage of change in EAV is a function of two values, initial EAV (X2) and frozen EAV (X1), and was calculated as:
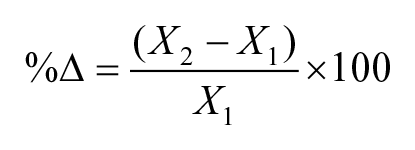
In the instance that the denominator, a TIF district’s frozen EAV, approaches zero, the percentage of change value approaches an especially large value or infinity. Although we excluded several districts with an initial valuation of $0, several TIFs included in the analysis possessed extremely low initial valuations. For these districts, any increase in the EAV represented substantial growth in comparison with less blighted districts that exhibited higher EAV at the time of TIF designation. In effect, growth is proportionally more valuable to distressed areas. Thus, higher rates of change in EAV do not necessarily indicate that the district met the expectations of a genuinely effective TIF that successfully reversed or vanquished blight. Some TIFs with high economic blight scores and large minority populations experienced substantial growth in the EAV of property despite maintaining blight indicators that continue to lag considerably behind the rest of the city.
These findings warrant reconsideration of growth in blighted areas when evaluating TIFs. Limiting our conceptualization of growth to changes in property values could exaggerate the effectiveness of TIF in severely blighted TIF districts. City officials could erroneously conclude that distressed TIFs experienced substantial progress in reversing blight, given increasing property values, despite the continued presence of concentrated blight. To truly understand whether TIF improves communities, it is critical to account for the change in EAV as well as other improvements to the community and residents’ quality of life (e.g., availability of quality affordable housing, commercial activities, and employment opportunities).
Byrne (2010) and Lester (2014) relied on alternative measures of growth, including employment change, business creation, and building permit activity. Both found TIFs to exert no effect on employment in Chicago. Lester (2014) stated that TIFs “were ineffective in increasing tangible economic benefits for residents” because they “failed to produce the promise of jobs, business development or real estate activity at the neighborhood-level beyond what would have occurred without TIF” (p. 670). On the contrary, Case and Marynchencko (2001) found growth in the property values of Chicago’s single-family homes to be twice as high in lower income communities in comparison with higher income areas. When considering these findings simultaneously, it becomes clear that increases in property values do not necessarily translate to increases in other indicators of growth. The findings presented here suggest that although TIFs facilitate higher property values in economically blighted areas with higher proportions of minority residents, concentrated economic blight continues to exist.
Basic site preparation projects (e.g., demolishing deteriorated buildings, removal of trash, painting graffiti) may trigger an appreciation of property values. Weber et al. (2007) questioned the growth of property values in distressed areas arguing that the phenomenon “may be due to the relative expansion of low-income demand—often fueled by immigration, a glut of high-end housing, or gentrification” (p. 262). An influx of lower income immigrants or higher priced housing would shrink the supply of low-income housing needed in impoverished areas, triggering increases in price regardless of the existence of blight. Both instances, however, do not translate to improved living conditions for residents as shown by the heightened levels of blight. This set of TIFs prompt concern about how growth is conceptualized when measuring the effectiveness of TIF in blighted TIF districts. When measuring TIF performance using change in EAV, the performance of TIF in severely blighted areas may be overstated given that the economic conditions of the community remain dismal.
The type of TIF, which categorizes districts according to the blight criteria used for designation, also correlates to TIF performance. More specifically, the blighted (vacant) and blighted (improved land) TIFs experienced more growth than the conservation TIF districts. Applicants for TIFs must provide evidence that the area suffers from various blighted conditions, including obsolete platting, diversity of ownership, tax or special assessment delinquencies, environmental contamination, declining EAV, deterioration of structures or site improvements on adjacent land, dilapidation, obsolescence, deterioration, presence of structures below minimum code, illegal use of structures, excessive vacancies, lack of ventilation (as well as light and sanitary facilities), inadequate utilities, overcrowding of structures, deleterious land use or layout, environmental cleanup, lack of community planning, and severely low growth in the total equalized value of property within the neighborhood. These conditions must be “present to a meaningful extent” and “reasonably distributed throughout the proposed district” (Tax Increment Allocation Redevelopment Act, 1971). The blighted (vacant) and blighted (improved land) TIFs must endure more blighted conditions in comparison with conservation TIFs, which also must consist of a set of physical structures of which half are older than 35 years. The conservation TIF districts displayed less blight than the other two types of TIFs yet experienced less growth in property values. This further supports the idea that TIFs overwhelmed by blight perform at higher rates than nonblighted TIFs. However, the implications for the quality of life within the TIFs districts remains unknown.
Consistent with other studies, the presence of commercial and residential property correlated to higher changes in EAV in comparison with TIFs with only commercial property and TIFs with all types (commercial, residential, and industrial) of property. On one hand, property values for commercial real estate increase in Chicago’s TIF districts when high-quality public services exist (Smith, 2006). Chicago’s industrial TIFs, however, perform at lower levels. Weber et al. (2007) also found that the values of single-family homes appreciated when located near TIFs with commercial and/or residential properties yet depreciated when situated near industrial TIFs. Investments in residential and community development projects contribute to increasing EAVs’ property values, while expenditures in commercial development lead to lesser levels of growth and industrial projects reduce property values (Kane & Weber, 2016). Weber et al. (2003) argued that industrial parcels located in Chicago TIF districts possess lower property values than industrial parcels situated outside of TIF districts largely because of property owners’ wishes to transform the property for nonindustrial use. According to Weber et al. (2007), primary use of land in the TIF interacts with the age of the TIF to influence the appreciation of single-family homes with property values growing faster when located in or near an older mixed-used district and deprecation occurs when examining homes near older industrial TIFs.
Previous studies show a nonlinear relationship between the age of a TIF district and recent performance (Byrne, 2006; Dye & Merriman, 2003; Man & Rosentraub, 1998). In the early years of the TIF’s existence, there is a steady growth resulting from completion of economic development projects that trigger property-value increase. Annual growth generally peaks between the 10th and 20th year of existence. After this point, TIFs experience diminishing returns resulting from negative incremental growth in property’s EAV as fewer new developments occur. This study, however, focuses on growth throughout the entire duration of the TIF. The findings support claims that older TIFs benefit from more time to complete projects and improve property values (Byrne 2006; Dye & Merriman, 2003).
Being located further away from the city’s downtown reduces growth in property values. The potential for higher returns on development projects increases when located closer to Chicago’s central business district or the Loop. This area represents less than two square miles in the center of the city, yet constitutes a considerable amount of commercial activity, particularly related to tourism and entertainment, as well as residential units. Increased distance reduces a TIF district’s capacity to exploit the heightened levels of commercial activity and growth experienced downtown. Byrne (2006) argued that the performance of distance variable probably resulted from the “exceptional” growth in property values of TIF districts near the downtown, which regularly experiences (re)development. While not examined in the present study, Weber et al. (2007) found that distance between TIFs and Chicago’s CBD matter only for mixed-use and industrial TIFs.
It is important to note that the QRA offers findings that would remain unknown with the use of ordinary least squares regression. The effects of the predictor variables changed across the quantile regression models indicating that the factors play a different role in the success of a TIF according to the level of growth experienced by the TIF. The correlation between the outcome and predictor variables performed stronger at lower quantiles. The weakness of the 75th percentile model suggests a need for theory development that focuses on understanding patterns among TIF districts with higher changes in EAV. The lower R2 values of the different estimated quantile models indicates the exclusion of important variables. Our model accounts for the traditional variables included in TIF performance studies, which focus primarily on neighborhood-level attributes. Similar TIF studies that also consider TIF districts’ specific activities (types of projects completed, expenditures for different project types) report higher R2 values (Kane & Weber, 2016). Although we included total expenditures in the model, it did not correlate to changes in EAV. Closer examination of the programmatic achievements within these districts would expand the conversation beyond the mere occurrence of (re)development to the specific types of development, and levels, associated with growing property values.
By focusing on TIF in Chicago, these findings do not apply to the effectiveness of the local economic development tool in other municipalities. The findings presented in this study do provide new insight into discussions about TIF, particularly its capabilities to reverse blight and concerns about the measure of TIF performance and change in EAV.
Conclusion
The city of Chicago remains under criticism for its continued tendency to locate TIF districts in communities whose characteristics do not conform to the conventional definition of blight (Jorvasky, 2015; Jorvasky & Dumke, 2015; McGhee, 2016; Spielman, 2015). The concern is that this practice negatively affects the city, particularly the most distressed communities. By permitting TIF in these communities, cities sacrifice a considerable amount of tax revenue that would otherwise contribute to the city’s general fund (Briffault, 2010; Skidmore & Kashian, 2010). The extensive range in blight scores supports claims that several of the city’s TIF districts would not be considered blighted according to the conventional definitions from which the “but-for” standard for TIF adoption emerged. Projects in nonblighted areas generally would occur without TIF designation (Dye & Merriman, 2000; Hicks et al., 2016). Also, many critics of Chicago’s TIF program complain that the least blighted TIF districts experience the most growth. The results of the estimated quantile regression models, however, show the opposite.
Physical blight did not contribute to the appreciation or depreciation of property values. The proportion of non-White residents and economic blight shared negative relationships with change in EAV as well as with each other. Surprisingly, the combined effect of economic blight and people of color improved the effectiveness of TIF. The highest performing TIFs existed in communities with predominantly minority populations in perpetually impoverished conditions, which contradicts expectations. TIF appears to support property value appreciation, but the findings do not show that it acts as a remedy for economic distress in severely blighted communities with large minority populations. Future research is needed to understand the factors contributing to the increase in property values in blighted TIFs to determine whether the growth is an artifact of housing supply deficiencies or development initiatives. If it is the latter, cities would greatly benefit from learning what type of project contributed to the appreciation of property values and what obstacles prevent these TIFs from also addressing other signs of economic despair.
Byrne (2010) and Lester (2014) showed that Chicago TIFs fail in expanding employment and attracting private investment in blighted areas. One could question the effectiveness of TIF in blighted communities given that the tool increases property rents without strengthening the economic position of the low-income residents to help them afford the higher housing costs. More resources are needed to effectively address economic blight. Carroll and Eger (2006) claimed that blighted TIFs can be successful but require enormous amounts of growth to overcome blight. Dye and Sundberg (1998) stated that “projects that best fit the goals of TIF legislation may be impossible to finance through TIF. Alternative government programs may be required to help towns develop areas in the most need” (p. 90). Thus, if Chicago and other cities intend to address severe blight through TIF, local governments must devise a multifaceted program that can address the various conditions that contribute to economic distress as well as use multiple measures of TIF performance.
Footnotes
Declaration of Conflicting Interests
The author(s) declared no potential conflicts of interest with respect to the research, authorship, and/or publication of this article.
Funding
The author(s) received no financial support for the research, authorship, and/or publication of this article.
