
Abstract
Local economic development programs are primarily aimed at increasing employment and tax revenues. Data on these programs are collected through self-report surveys conducted by the International City Managers Association and others. This study evaluates predictors of accurate self-reporting. Using agency theory as a theoretical framework, the study measures the quantity of internal reporting components and the quality of financial reporting and evaluates how these are associated with accurate self-reporting. As a control, the condition of the local economy is also evaluated. The findings indicate a statistically significant relationship between the quality of financial reporting and the strength of a local economy with accurate self-reporting. Recommendations to improve research in this area are for the Government Finance Officers Association and the International City Managers Association to work together, with the former creating standards for reporting on local economic development programs and the latter aligning its survey with these standards.
Existing research on local economic development programs studies the relationship between priorities, barriers to success, and programming (Reese & Fasenfest, 2004, p. 12; M. E. Warner & Zheng, 2013). These and other studies of local economic development programs primarily rely on self-reported data from national surveys conducted by either the International City Manager’s Association (ICMA) or the National Association of Counties (NACo). A noticeable gap in the research is an assessment of the accuracy of results self-reported by survey participants. There is no known research testing the validity of claims of success (or failure) in these national surveys. The lack of any validation for claims of success in the surveys creates a challenge in evaluating and comparing the effectiveness of various programs and ultimately identifying best practices for communities. Therefore, given the lack of literature addressing this important element, this article starts with an assessment of the accuracy of self-reporting in local economic development programs, and in turn, explores possible predictors of accurate reporting.
Defining the utility of local economic development programs has been a vexing problem for scholars and public officials. Every aspect of planning, organizing, operating, and reporting economic development programs is fraught with complications. The complications start with defining and measuring realistic outcomes. Increasing jobs and tax revenues are two traditional goals (Bartik, 1991, p. 6), but these, as Paul Peterson and others have argued, are typically beyond the resources or political strength of their institutions or elected leaders (Peterson, 1981; U.S. Congress, 1975). If increasing jobs is a priority, the challenge becomes balancing the needs of business with the interests of employed and unemployed people of the community (Adua & Lobao, 2015; Lobao & Kraybill, 2014). If tax growth is a priority, overcoming barriers to intergovernmental cooperation poses significant challenges (Kwon & Feiock, 2010). Measuring and reporting effectiveness, particularly when it comes to job creation, is another test. Past research on local economic development program outcomes is mixed. While Timothy Bartik found a connection between local economic development initiatives and job creation (Bartik, 1991), other researchers have found little in the way of employment, income, or fiscal benefits (Feiock, 2002) or worse, the generation of zero- or negative-sum competition (Reese, 1991; Reese & Rosenfeld, 2004).
Further complicating research on local economic development programs is the lack of any standards for reporting outcomes. Public officials leading these efforts are not bound by any objective standards for reporting success or failures. There are no equivalents to the generally accepted accounting principles that guide the reporting of local revenues and expenditures. One potential source of guidance is the Government Finance Officers Association (GFOA). This organization conducts a nationwide peer-review program to evaluate the quality of annual financial statements and budget documents. However, the rating guides used by evaluators in these programs contain no specific standards on substantiating claims of economic development success (GFOA, 2016). The lack of reporting standards on program performance is not unique to the GFOA’s program, ICMA’s survey, or the economic development programs sponsored by local governments. In fact, issues with the exchange of accurate information between public officials and their principals have spawned a separate stream of research (Bartik, 1994; Larkey & Smith, 1989; Musgrave & Musgrave, 1989).
Study Purpose
There are a couple of important reasons to assess the accuracy of self-reporting in local economic development programs. First, there are known issues with responses to surveys (Dillman et al., 2009) and the potential for self-interests to compromise the accuracy of these responses (Terry, 1998). Second, accuracy is necessary to extract value from these surveys. If responses are inaccurate, the potential to evaluate the effectiveness of specific programs under varying economic conditions is lost, and with it, the opportunity for reasoned discourse exploring urban policy options (Peterson, 1981).
Research Questions
The specific questions of interest in this study are
How accurate are self-reported claims of success and failure in the ICMA survey?
What are the predictors of accurate self-reporting by local governments in the ICMA survey?
Is accurate self-reporting associated with local economic conditions?
The last question seeks to determine if economic conditions result in local officials using relative, rather than objective, measures of success. For example, a community with increasing unemployment rates may claim success with job growth if a greater increase in the unemployment rate was anticipated or possible during the time period under evaluation.
Data and Method
This study starts with identifying the accuracy of self-reported claims of success or failure. In turn, there is an assessment of potential indicators of accurate reporting. The following section on data and methods explains the underlying data and theoretical framework used to conceptualize and operationalize predictive and outcome variables, and to hypothesize the direction of the relationship between them. The first part describes the four data sets used in the study and the steps taken to prepare the data prior to constructing the predictor and outcome variables. The second part, organized by research question, explains how the variables are constructed from the data sources. Following this description of the variables, the hypotheses are outlined and the statistical techniques used to test the relationship between variables are described. The final part of this section is a discussion on the limitations and validity threats associated with the data and methods.
The Data
This study uses four data sets to construct the predictor and outcome variables; the ICMA survey on local economic development, the U.S. Census Bureau’s data sets on unemployment and local tax revenues, and the GFOA’s data on past award recipients for excellence in financial reporting and budget documentation.
The ICMA Survey on Local Economic Development
This ICMA survey on local economic development, along with a similar survey conducted by NACo, are used extensively in academic research. For example, these surveys have been used to quantify the balance between probusiness policies and social services (Adua & Lobao, 2015); determine the interaction of privatization, business attraction, and social services (Lobao & Kraybill, 2014); assess the ability of poor cities to pursue local economic development (Lobao & Kraybill, 2009); and determine the economic climate where business incentives are deployed (M. E. Warner & Zheng, 2013; Zheng & Warner, 2010). The ICMA data set was chosen for this study due to its size and the uniformity of municipalities (the largest segment of respondents to the survey). Counties, special districts, and nonprofits can be organized in several ways, making it difficult to compare survey results (Peterson, 1981).
The ICMA survey used in this study was conducted in 2014. It was distributed to 5,237 member institutions and received a 23% response rate. Municipalities accounted for 827 of the respondents. The survey instrument included 25 questions. Twenty-two of these are close-ended multiple-choice questions. The survey covered local priorities, planning (motivation, barriers, and priorities), programs (tools and incentives), accountability, and claims of success. The variables in this study drew on responses to three multiple-choice questions that addressed barriers, accountability, and program success. Table 1 provides a summary of the priorities and claims of success by the municipalities participating in the survey.
Economic Development Priorities and Success Among Municipalities.
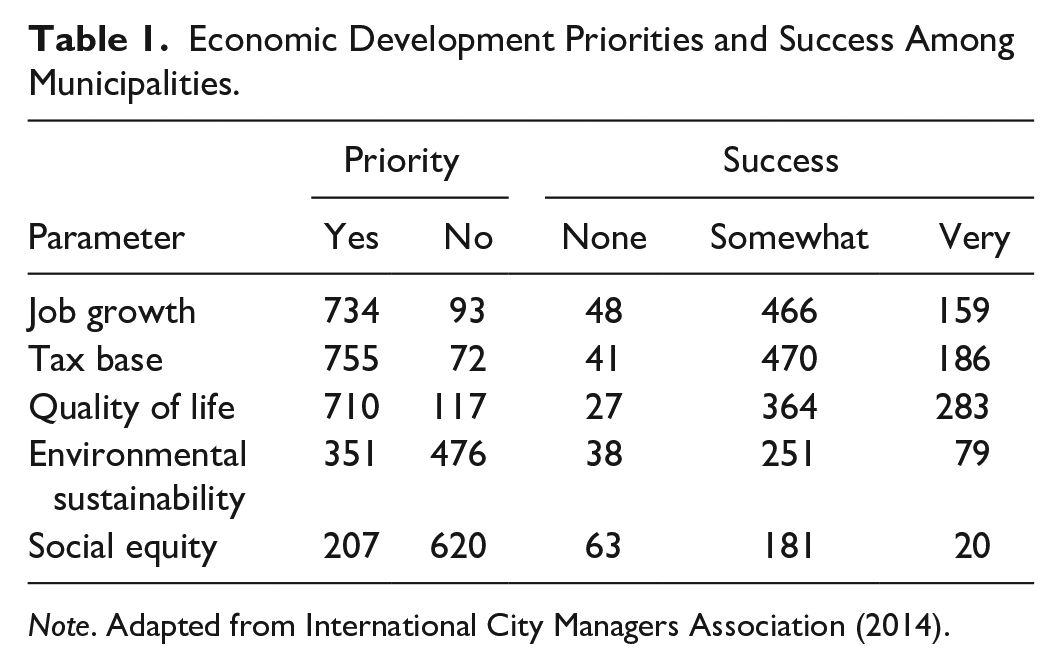
Note. Adapted from International City Managers Association (2014).
The underlying data from the ICMA survey was provided to purchasers in a single Microsoft Excel spreadsheet. Each row in the spreadsheet represented a case (local government). For this study, the data were transferred from Excel to Statistical Package for the Social Sciences (SPSS) before any cleaning took place. Variable names were converted to SPSS format at the time of the transfer. In addition, answers to individual questions distributed across multiple cells in Excel were consolidated into single ordinal variables in SPSS. There were several response errors in the underlying data associated with the survey questions. The steps below were taken to address these errors.
The first question from the ICMA survey used in this study relates to success meeting one or more of the following priorities: jobs, tax revenues, quality of life, environmental sustainability, or social equity. Jobs and tax revenues are the focus of this study because they are easy to measure objectively and multiple years of data are readily available from the U.S. Census Bureau to pair with ICMA survey data. For this question, the potential responses were “Very Successful,” “Somewhat Successful,” “Not at All Successful,” or “New Priority/Too Early to Tell.” If there were multiple answers to either the job growth or tax growth question, the following protocol was used. First, if the answers were adjacent to each other, indicating potentially that the respondent wanted to choose an average of the two scores, the higher of the two scores was entered. Second, if the scores were separated by another answer, indicating an error in data entry or multiple and inconsistent answers, the scores were removed and the answer was treated as a nonresponse. An exception was made to this second rule when one of the duplicative responses was “New Priority/Too Early to Tell.” In these cases, the other response was accepted, working on the assumption that the respondent had some indication of success or failure, but was expecting more results in the future. Nineteen scores with duplicate answers were rounded up, 17 answers were deleted due to inconsistent scoring, and 12 answers of “New Priority/Too Early to Tell” were deleted in favor of a second answer to the same question.
The second question from the ICMA survey used in this study asked respondents to rate the significance of 21 potential barriers to economic development in their communities. The four rating choices were none, low, medium, and high. If no response was given for one or more of the barriers, the response was presumed to be “none” and an entry indicating such was made. If, however, no responses were made for any of the barriers, the entire question was treated as a nonresponse and excluded. Three cases were excluded using this criterion. This same approach was followed for the final question used in this study. For this question on accountability measures, respondents were asked to indicate whether seven different reporting components were used in their program. If no response was given to one or more of the components, the response was presumed to be “no” and an entry indicating such was made. All cases had at least one response, so no cases were excluded for this question.
Census Bureau Data
Data from the U.S. Census Bureau were used as an objective measure to determine if claims of success in the ICMA survey were accurate. To measure job growth, unemployment rates were collected for each municipality from the American Community Survey (Table S2301) for 2010 through 2014 (U.S. Census Bureau, 2010, 2011, 2012b, 2013b, 2014b). Since it is unclear what time frame respondents to the ICMA survey used for gauging success, rates of change were calculated for the periods 2010 to 2014, 2011 to 2014, 2012 to 2014, and 2013 to 2014.
For tax growth, property and sales tax data were collected from the Census Bureau’s State and Local Government Finances survey for 2012 through 2014 (Codes T01 and T09; U.S. Census Bureau, 2012c, 2013b, 2014c). The Bureau notes that this data set may include high sampling errors (U.S. Census Bureau, 2012a, 2013a, 2014a). Again, since it is not clear what time frame respondents were contemplating when making claims of success or failure, rates of change were calculated for the periods 2012 to 2014 and 2013 to 2014. Only two periods were used for tax revenues, because municipalities typically measure and report tax revenues on an annual or biannual basis.
Missing data from Census Bureau data sets were primarily associated with smaller communities and related to methods used by the Census Bureau for data collection. The Census Bureau provides estimates for some municipalities’ missing data; therefore, no additional effort was made to replace missing data.
GFOA Awards for Excellence in Reporting
The GFOA offers local governments the opportunity to subject their budget and financial reports to peer review and possible recognition for excellence in reporting. Budget documents are the primary method for local government staff to exchange information with elected officials on how priorities, policies, programs, and resources are connected. Budgets are subjected to public hearings before adoption, usually on an annual basis. Annual financial statements reflect the financial condition of a jurisdiction and serve as the foundation for estimating resources available for the budget planning. The GFOA Awards Program publishes standards and evaluation criteria used in the peer-review process. As an example, evaluation criteria includes whether a jurisdiction publishes information on a community’s average household income, major industries, top taxpayers, and employment levels, and compares these data with other local communities (GFOA, 2016).
The GFOA publishes annual lists of jurisdictions receiving designations for excellence in reporting for financial reports and budgets (Budget Awards Programs, 2018; http://www.gfoa.org/budgetaward). The listing also provides the number of years the jurisdiction has received the designation. The listing for financial reports includes over 2,556 jurisdictions and the listing for budgets includes 1,230 jurisdictions.
Variables of Interest
Are Claims of Success Accurate?
Dichotomous variables for reporting accuracy were created by combining data from the ICMA survey and the U.S. Census Bureau. The first step simplified ICMA survey data indicating if a local government was successful or unsuccessful at increasing jobs or tax revenues. There were three responses available to respondents to the ICMA survey indicating the level of success with job growth and increasing tax revenues: “Very Successful,” “Somewhat Successful,” and “Not at All Successful.” To reduce the subjectivity of the responses, “Very Successful” and “Somewhat Successful” were combined for each case to be simply “Successful” or “Unsuccessful.” The second step, using U.S. Census Bureau data, was to determine if unemployment and taxes went up or down for each case. Variables were created for four different time periods for unemployment (2010, 2011, 2012, and 2013 to 2014) and two time periods for tax revenues (2012, and 2013 to 2014).
The third step was to create a yes/no binary dummy variable for accuracy in reporting employment growth and tax revenue growth. A “yes” was registered if the municipality indicated success creating jobs and the unemployment rate decreased, or if they indicated no success creating jobs and the unemployment rate increased. A “no” was registered if the municipality indicated success creating jobs and the unemployment rate increased, or if they indicated no success creating jobs and the unemployment rate declined. Accuracy variables are created using the rate of change for all four time periods. The same method was used for creating yes/no variables for accuracy reporting tax revenue growth.
Accuracy on program outcomes (success or failure) was selected for several reasons: first, because it is important to the value of the balance of the survey data. If responses to outcomes are inaccurate, the potential to evaluate the effectiveness of programs is lost and the research value of the survey is greatly diminished. Second, of questions posed in the survey, the response on outcomes appears to be one of the least open to ambiguity. Finally, it was one of the few questions where there are objective data to validate responses.
What Are the Predictors of Accurate Self-Reporting?
Theoretical framework
The theoretical framework to identify predictors of accurate responses is a derivative of agency theory. Agency theory is concerned with the integrity of the relationship between an agent and their principal. One aspect of this relationship is the ability of a principal to obtain accurate reports from the agent. The proposition associated with the reporting problem is this: “When the principal has information systems to verify agent behavior, the agent is more likely to behave in the interests of the principal” (Eisenhardt, 1989, p. 60). Information systems are defined in many ways. Kenneth and Jane Laudon defined it as “interrelated components working together to collect, process, store, and disseminate information to support decision making, coordination, control, analysis, and visualization in an organization” (Laudon & Laudon, 2012, p. 31). The ICMA survey has several questions focused on accountability that indicate the number and type of information components employed by responding entities. The data from these responses, combined with data from the GFOA suggesting the quality of reporting systems, were used to construct variables to test the association with accurate reporting.
The predictor variables
The first variable constructed to predict accuracy was the number of Reporting Components. The ICMA survey instrument contained a series of seven yes/no questions on whether the jurisdiction measured the effectiveness of certain business incentives. The Reporting Components variable was the sum of all “yes” responses to the seven items. Building a scale with dichotomous responses is a common practice (Adua & Lobao, 2015; Osgood et al., 2016; M. E. Warner & Zheng, 2013), although there are critics of the technique. The primary concern with the technique is that it gives equal weight to each component when, potentially, measures have a different relationship with the dependent variable (Basolo & Huang, 2001; Ha & Feiock, 2011).
The second variable constructed to predict accuracy was based on the GFOA awards program for excellence in financial reporting. This variable (GFOA Awards) was created by using a scale set by the number of certifications granted to a municipality by the GFOA for excellence in budgeting and financial reporting. The highest number of annual awards granted to a single jurisdiction is 45 for financial statements and 33 for budgets. To construct the variable, the total number of awards were combined for each jurisdiction. The staff responsible for this award program were not aware of any prior use of these data in academic research (J. Fishbein, personal communication, “Use of (GFOA) Award Program in academic research,” July 31, 2018). The limitation of these data, having not been tested before in other research, is offset by the potential to establish an association between the practices of public finance and local economic development professionals.
Do Economic Conditions Confound Predictors of Accurate Reporting?
As an additional test, the accuracy of self-reported claims was compared with a variable measuring local economic conditions (Barriers). This was intended to test whether self-reporting statements of success were relative to economic conditions in a community (which could be inconsistent with objective measures). The ICMA survey included a question identifying 21 conditions that are potential barriers to local economic success. These included limited major employers, distance from major markets, declining markets, poor quality of life, lack of skilled labor, cost of land, cost of housing, traffic congestion, lack of land, and citizen opposition. Respondents indicated the presence of a condition as a barrier for local economic development using a 4-point scale (1 = none, 2 = low, 3 = medium, or 4 = high). Factor analysis was used to separate and combine these 21 individual measures into two distinct constructs (Table 2).
Factor Analysis of Economic Barriers.
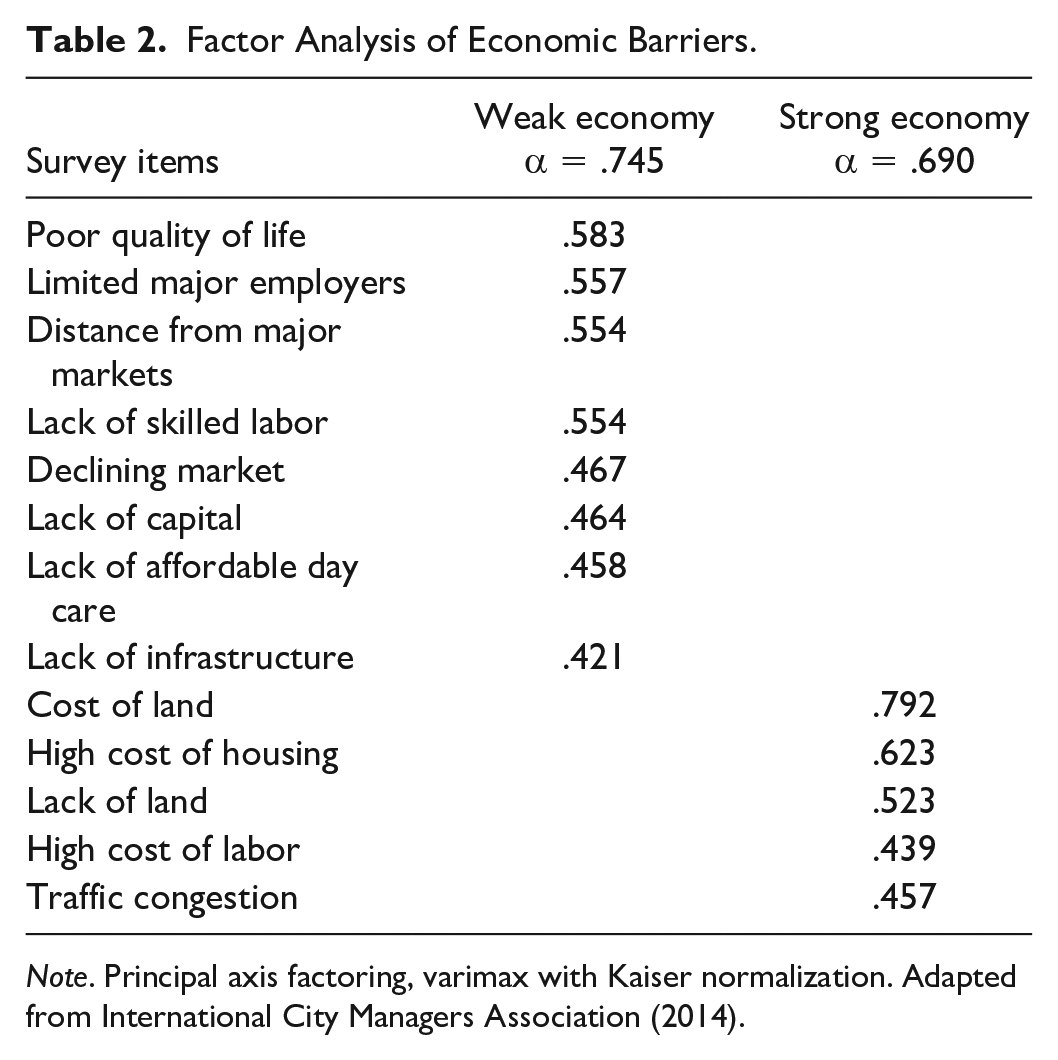
Note. Principal axis factoring, varimax with Kaiser normalization. Adapted from International City Managers Association (2014).
The first construct, with a Cronbach’s alpha of .745, included the following eight barriers: poor quality of life, limited major employers, distance from major markets, lack of skilled labor, declining markets, lack of capital, lack of affordable daycare, and lack of infrastructure. The second construct, with a Cronbach’s alpha of .690, included five barriers: the cost of land, cost of housing, lack of land, high cost of labor, and traffic congestion. The first construct, which featured more barriers, a higher alpha, and responses that indicate a clear weakness in the local economy, was selected for this study to represent local economic conditions. The scale is reversed from the original survey scoring, so that 1 represents the strongest presence of economic barriers and 4 represents the least. The scale was reversed to match the direction of the other two variables—under the assumption that communities with less-perceived economic barriers (a higher score on the reversed scale) would provide more objective (accurate) statements of jobs and revenue gains.
Intercorrelation of Predictor Variables
The three predictor variables (Reporting Components, GFOA Awards, Barriers) were tested for intercorrelation (Table 3). A Pearson correlation test was performed in SPSS, and there is a statistically significant relationship (p at the .01 level) between Reporting Components and GFOA Awards with a coefficient of .115. There is also a statistically significant relationship (p at the .05 level) between GFOA Awards and Barriers with a coefficient of .143 (Table 3). The conclusion from this test is that each independent variable is measuring a distinctly different condition.
Intercorrelation of Predictor Variables.
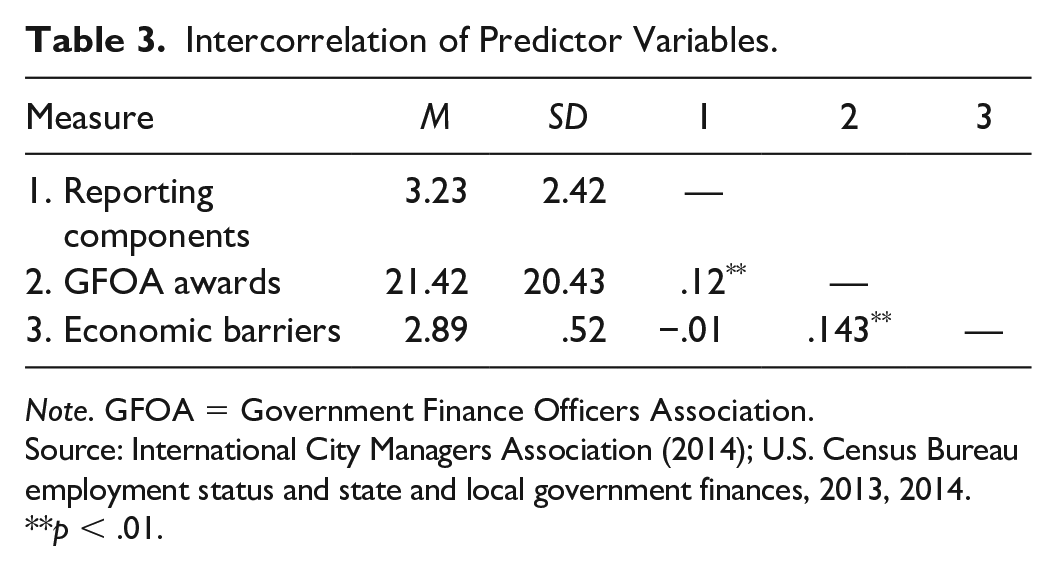
Note. GFOA = Government Finance Officers Association.
Source: International City Managers Association (2014); U.S. Census Bureau employment status and state and local government finances, 2013, 2014.
p < .01.
Descriptive statistics for each variable are provided in Table 4.
Descriptive Data for Variables.
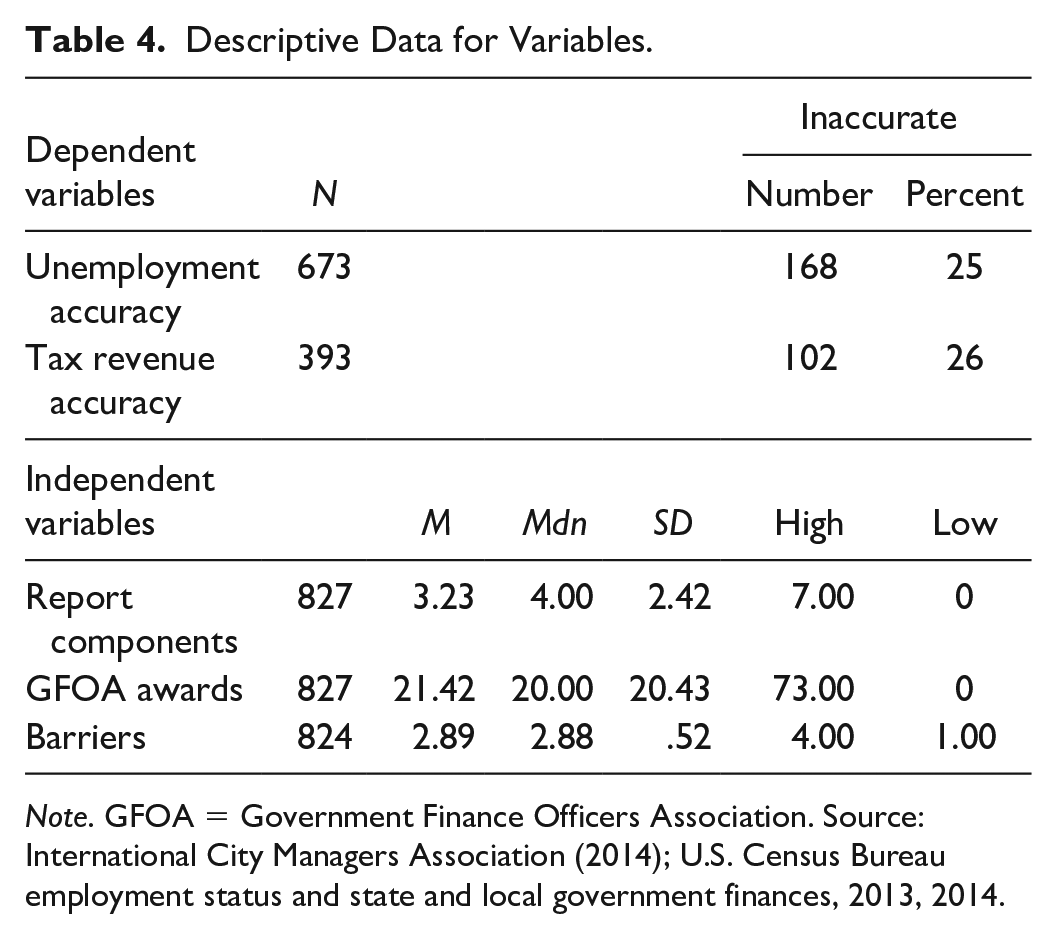
Note. GFOA = Government Finance Officers Association. Source: International City Managers Association (2014); U.S. Census Bureau employment status and state and local government finances, 2013, 2014.
Hypotheses
Four discrete hypotheses, using agency theory as a theoretical framework, are posited that accurate self-reporting is associated with (1) an increased number of reporting components and (2) the quality of key financial documents (validated by awards received in GFOA’s peer-review program):
The model to test the various hypotheses is illustrated in Figure 1.
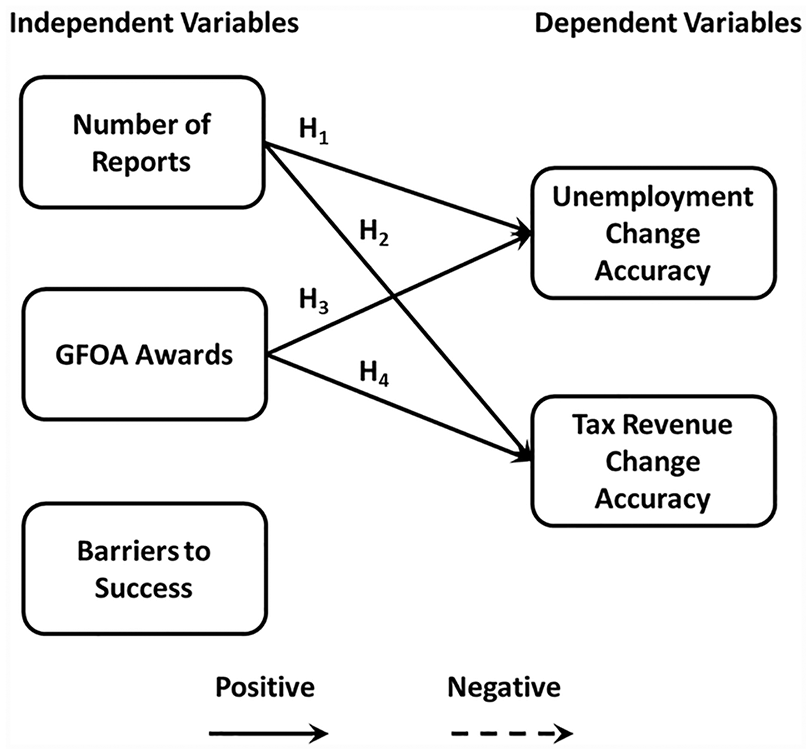
Hypotheses model.
Statistical Techniques for Data Analysis
Descriptive Statistics
Three tables of descriptive statistics are used in the analysis of the data. One table is presented using the accuracy variables that tabulates incorrect claims for job growth and tax growth across four different time periods. This analysis is used to determine which time period respondents could have been contemplating when completing the survey. The time period with the most accurate rate is used in the subsequent analysis. Another table with common descriptive statistics is prepared for all variables used to test the hypotheses and the association of local economic conditions with reporting accuracy. Finally, a cross-tabulation between predictor and outcome variables is used to review general patterns of association.
Logistic Regression
The outcome variables (accuracy reporting job growth and tax changes) in this study are dichotomous; therefore, it is not possible to use a linear regression model where incremental changes in units of the predictor variables (X) are associated with incremental changes in units of the outcome variables (Y; Osborne, 2015). Instead, logistic regression is employed to determine, given various incremental changes in the predictor variables, the probability that a municipality will be associated with either group (accurate/inaccurate reporting). To aid in the interpretation of the results, logits (Li) and probabilities (
Limitations and Validity Threats
This study is conducted with a nonexperimental associational cross-section design. The objective of the design is to determine the strength of association (correlation) between variables. This is not a causal study and no inference is intended. The study is limited by the nonrandom selection of participants in the ICMA survey. Therefore, findings cannot be generalized to the entire population of local governments.
Validity threats include the accuracy of self-report information provided in the ICMA survey used to construct all or portions of the predictor and outcome variables. Data from the U.S. Census Bureau are also subject to validity concerns. The Census Bureau cautions that the State and Local Government Finances survey is subject to high sampling errors. Finally, the scale created by adding together various reporting components (Reporting Components) gives equal weight to each component when, potentially, each measure has a different relationship with the dependent variables. Each of these limitations should be considered when evaluating the findings.
Findings
Are Claims of Success Accurate?
Descriptive statistics for dummy variables indicating accuracy are presented in Table 5. The inaccuracy of claims of success (or failure) by respondents decreased with the shorter time frames. For job growth (using unemployment rates), 46.4% of claims were incorrect if the 2010 to 2014 period is used. If the 2013 to 2014 time period is used the incorrect claims fall to 25%. Incorrect claims for tax revenue dropped slightly, 28% to 26%, contrasting 3- and 2-year periods. For the analysis that follows, the time period with the best accuracy rate (2013 to 2014) is used as the outcome variable. It is presumed that, based on the higher accuracy rate, this is the time period contemplated by the respondents. This shortest time frame is also supported by common practices in the profession, since public officials typically plan and report on annual cycles through budget documents and financial statements.
Descriptive Statistics: Time Frames and Inaccuracy.
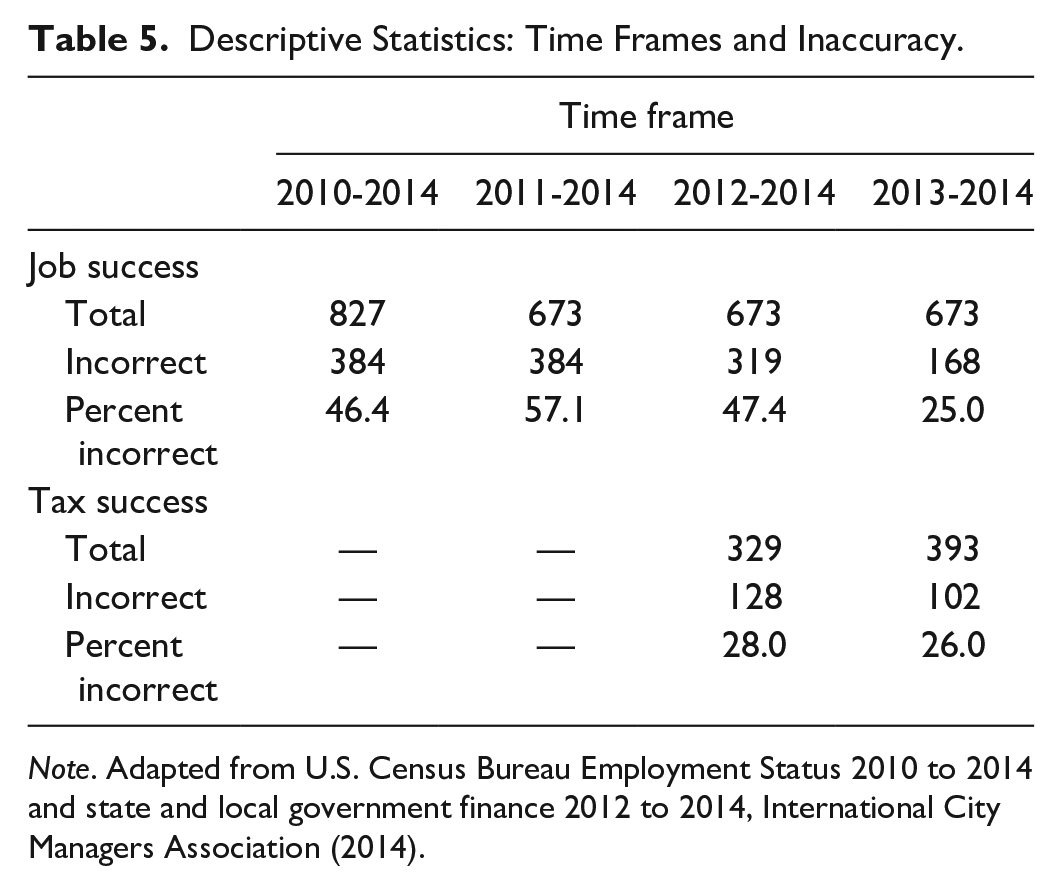
Note. Adapted from U.S. Census Bureau Employment Status 2010 to 2014 and state and local government finance 2012 to 2014, International City Managers Association (2014).
What Are the Predictors of Accurate Self-Reporting?
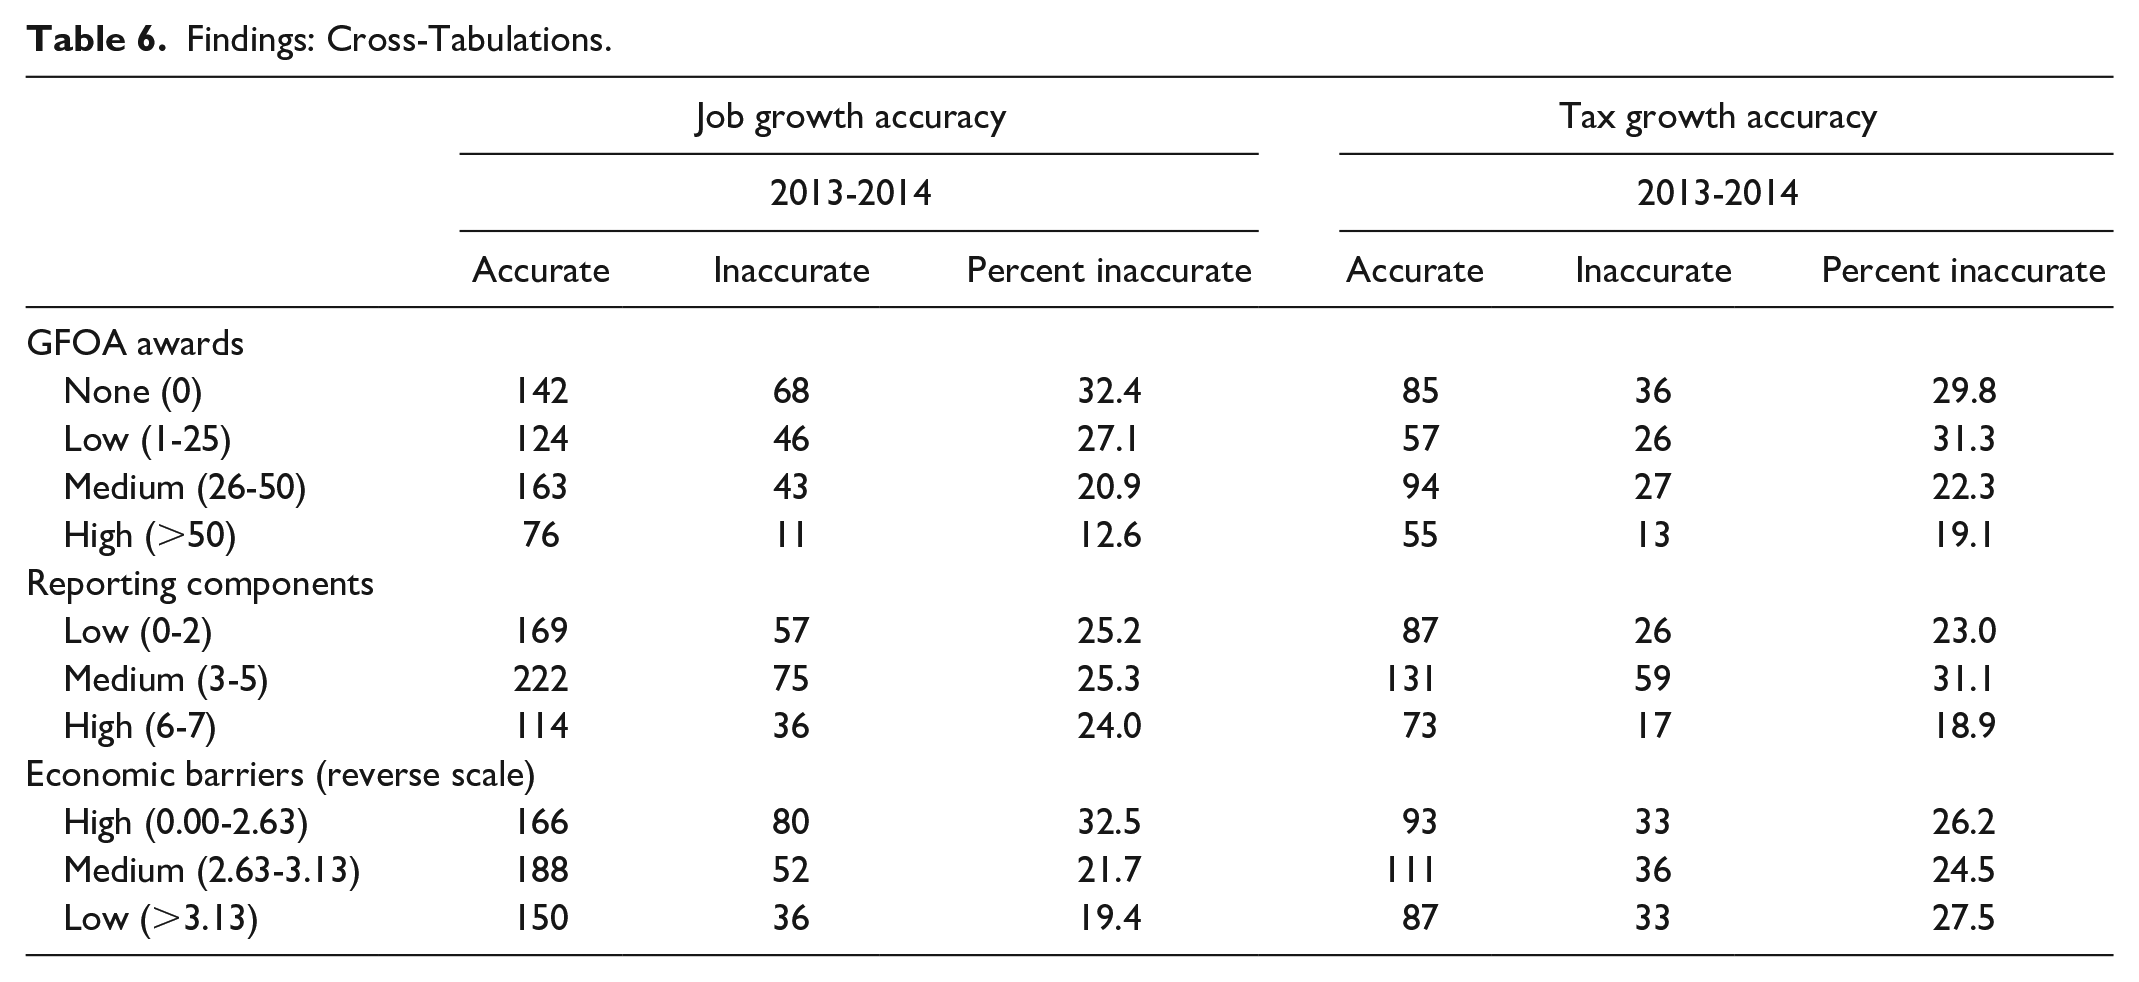
A cross-tabulation of the predictor and outcome variables was performed to identify any patterns in the relationships between variables (Table 6). Due to space limitations, independent variables were grouped into categories. The analysis revealed a negative relationship between the GFOA Awards and inaccuracy reporting job changes. Job change inaccuracy dropped from 32.4% (no GFOA Awards) to 12.6% (over 50 awards). Tax revenue change accuracy, for the same categories, dropped from 29.8% to 19.1%.
Findings: Cross-Tabulations.
Direct logistic regression was performed using two models to assess the association between the three predictor variables, and (1) accurate self-reports of job changes and (2) accurate self-reports of tax changes. The logistic regression procedure in SPSS was used to perform the analysis.
The full model for job change accuracy containing all predictors was statistically significant, χ2(3, N = 672) = 31.088, p < .001, indicating that the model was able to distinguish between municipalities who provided accurate or inaccurate responses on job changes. As detailed in Table 7, Panel A, two of the three independent variables made a unique, statistically significant contribution to the model (GFOA Awards and Barriers). The strongest predictor of accurate reporting was Barriers, with an odds ratio of 1.77. GFOA Awards were also statistically significant, with an odds ratio of 1.02. The full model for tax revenue change accuracy containing all predictors was not statistically significant, χ2(3, N = 393) = 5.847, p = .119, indicating that the model (Table 7, Panel B) was not able to distinguish between municipalities who provided accurate and inaccurate responses on job growth.
Findings: Logistics Regression.
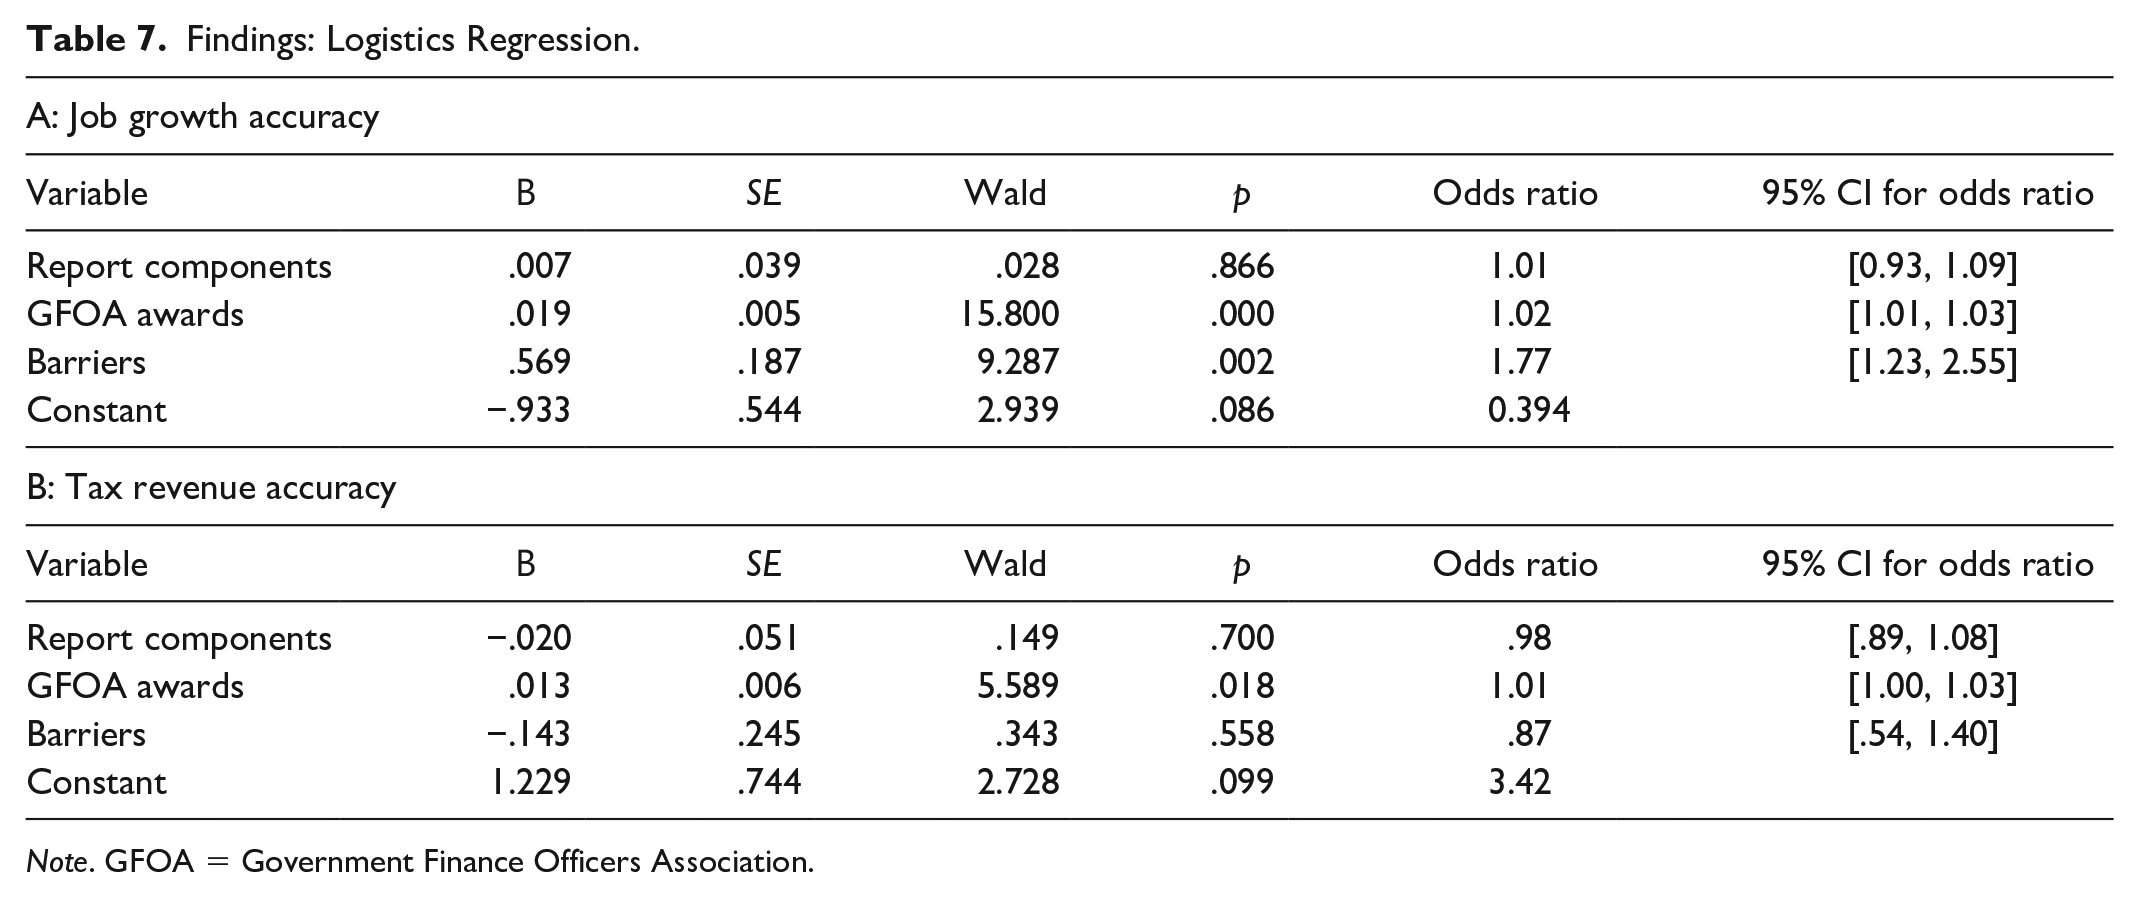
Note. GFOA = Government Finance Officers Association.
Based on these results, just one of the four hypotheses was confirmed: GFOA Awards are associated with accuracy reporting job growth (Hypothesis 3). This partially validates the elements of agency theory used to predict this relationship. Figure 2 illustrates the statistically significant relationships between the predictor and outcome variables.
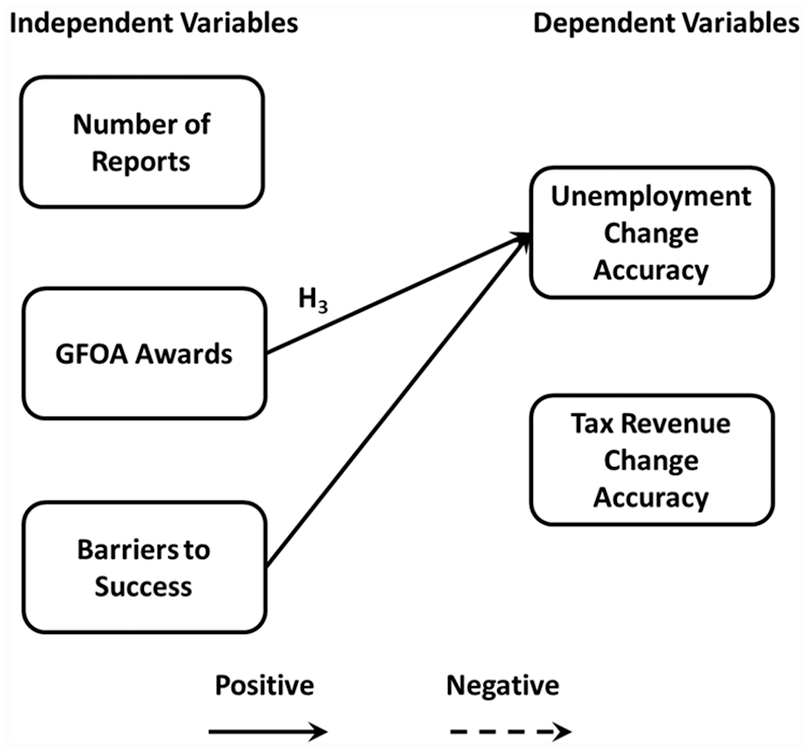
Findings.
Since the overall model for predicting accuracy with job changes is statistically significant, the coefficients (b) for all three predictor variables can be transformed into a new variable, which can be used to predict how one unit of change in the one or more of the variables changes the probability that a municipality will provide an accurate report on job changes. To create this linear model, the coefficient is transformed in three steps (R. M. Warner, 2013). The calculations that follow are most easily executed in an Excel spreadsheet. The first step is to calculate a logit (Li) for each variable. Li is calculated by adding the reported constant (b0) with the products of the coefficients and a selected value for the predictor variables (b1x1, b2x2, b3x3). The calculation is as follows:
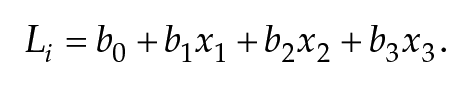
The second step is to calculate the antilog of the calculated Li (eLi). This is accomplished in Excel with the exponential function (=EXP[Li]). The final step to produce the probability (

Table 8 provides various combinations of values for the predictor variables and the resulting values for Li, eLi, and
Findings: Analysis of Logistic Regression Results for Job Growth Accuracy.
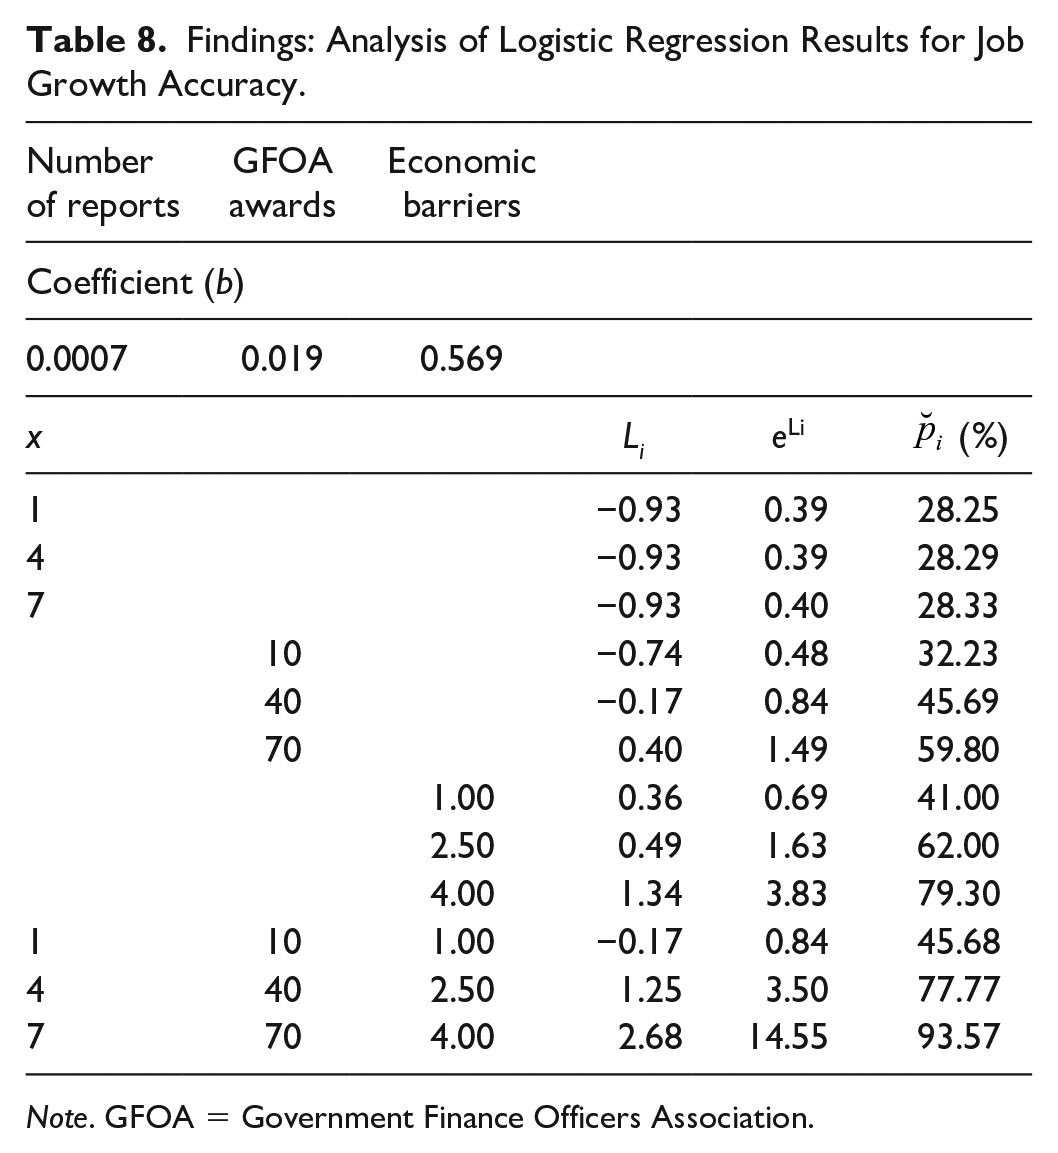
Note. GFOA = Government Finance Officers Association.
Conclusions
The purpose of this study was to assess the accuracy of self-reported data in the 2014 ICMA survey and to identify potential predictors of accurate reporting. Claims of success for the top two priorities of local governments—job growth and increasing tax revenues—were the focus of the study. Using data from the U.S. Census Bureau on unemployment rates and tax revenue collections, it was determined that the accuracy rates on claims of success in the ICMA survey, using 2013 to 2014 as the time frame, was approximately 75% for both job growth and tax revenues. The strongest predictor of accuracy reporting job growth was economic barriers (OR 1.77). The quality of reporting systems (GFOA Awards) was the second, with an odds ratio of 1.022. The quantity of reporting components had a negligible impact on accuracy.
The association between economic conditions (Barriers) and accuracy suggests that local governments are providing subjective judgments when responding to questions in the ICMA survey regarding program outcomes. This is understandable, but it raises concerns about the use of these responses when evaluating program effectiveness. Researchers using the ICMA survey for program evaluation should consider measuring outcomes with objective data from independent sources. Also, to account for the relative nature of defining success and to address potential issues with self-reported responses in the survey on economic barriers, independent sources should also be considered to measure these barriers.
The association between participation in the GFOA Awards program and accuracy reporting results for job changes provides a partial validation of agency theory, and a potential path forward for ICMA to strengthen the validity and thereby the value of its survey to local governments across the country. If ICMA were to partner with the GFOA to this end, it could be a transformative partnership to create a valuable feedback loop for one of local government’s most challenging public policy areas: local economic development.
A partnership between ICMA and GFOA, where both organizations work to create reporting standards for local economic development and ICMA aligns its survey with these standards, would be a significant step forward in providing valuable feedback to local government officials, and better data for researchers to conduct program evaluations and identify best practices. Local government officials would be compelled to incorporate the GFOA standards, otherwise they would lose their annual certifications. This should, in most cases, overcome any internal opposition to providing objective data on the success or failure of local economic development programs.
This prospective partnership between ICMA and GFOA could build on an initiative by the Governmental Accounting Standards Board (GASB), which recently introduced a reporting requirement for local government financial statements relating to local economic development programs. Introduced in 2015, GASB now requires local governments to report in annual financial statements each tax abatement program, its public purpose, the amount of revenue abated, and whether the program includes a clawback provision in the abatement agreements. GASB recommends, but does not require, that local governments add other details to the program reporting, such as the names of entities receiving significant abatements, the number of abatement agreements, and projections of future abatements. At a minimum, ICMA could advance the quality of its survey by providing an avenue for local governments to incorporate these objective data into their survey.
The ICMA survey provides a great resource for researchers interested in how local governments respond to local economic development challenges. Based on one finding of this study, I conclude that there are specific measures researchers can take to work around validity issues with some self-reported data in the survey. More important, however, are the measures ICMA could take to transform this survey from a collection of data points into a catalyst for changing the way professional associations work across disciplines to give governments better resources to address the vexing challenges with local economic development.
Footnotes
Declaration of Conflicting Interests
The author declared no potential conflicts of interest with respect to the research, authorship, and/or publication of this article.
Funding
The author received no financial support for the research, authorship, and/or publication of this article.