



Abstract
While much of the economic development literature attempts to quantify the effectiveness of tax incentives on growth outcomes, less attention has been paid to the relationships between incentive use and local economic base composition, despite the fact that many economic development strategies are aimed at changing industrial base makeup. Local industrial base diversity has implications for the pace and stability of future growth. Using newly available annual data on incentives at the metropolitan statistical area (MSA) level, this article explores the relationship between incentives and economic diversity between 2005 and 2015. The descriptive analysis finds that MSAs with less diverse economic bases target incentives to industries with low concentration and that regardless of overall diversity, MSAs are more likely to incentivize industries that are less specialized locally. Panel regression models indicate that use of customized job training subsidies are associated with increases in diversity net of local government and population characteristics.
Motivation and Background
The drive to improve well-being and prosperity is the foundation of local economic development. Tax incentives are one of the most recognized tools available to policy makers to attract and retain business in their jurisdiction. Much of the literature focuses heavily on the effectiveness of incentives in relation to growth outcomes, defined as increases in the size or productivity of the economy as a result of incentive use (e.g., Bartik, 1991; Man, 2001; Patrick, 2016; Wasylenko, 1999). In general, evaluations of efficacy of incentives on growth outcomes has demonstrated mixed results, and many scholars and practitioners have criticized their pervasive use as a means to achieving growth (Hassink, 2010; Noll & Zimbalist, 1997). The utility of incentives in the face of the billions of dollars spent on them and their questionable success in influencing individual firm location decisions has led to questions of whether the appropriate outcomes are being evaluated. Some have called for broader interpretations of welfare, beyond merely counting jobs, to be considered when determining the success of incentives (Bartik, 1994; Courant, 1994).
One risk of offering generous business tax incentives is potentially wasting public resources if the incentives are ineffective. A related risk of offering incentives is that it places governments in the role of picking winners and losers. If decision makers are wrong and pick losers, then resources are wasted. A less appreciated risk is picking winners such that incentives lead to accelerated growth in specific local industries that subsequently leaves that more-specialized local economy more susceptible to volatile growth (Spelman, 2006). Furthermore, while research has shown that more diverse economies are better positioned to withstand national or local economic shocks (Brown & Greenbaum, 2017; Deller & Watson, 2016), there are also powerful political forces that might lead to the targeting of incentives toward incumbent industries (Courant, 1994; Greenbaum & Landers, 2009). Indeed, there is evidence that business incentives are poorly targeted (Bartik, 2017) or targeted at industries that already have a large local presence (Greenbaum et al., 2010).
Despite the fact that incentives may alter the economic base in ways that affect the pace and stability of future growth, very little research has examined the relationship between incentive use and industrial base diversity. While a robust, established literature exists on the various growth models involving industrial base composition and their relationships with productivity, economic growth, and resilience, few studies ask the more basic question about the relationship between incentives as a policy intervention and the resulting changes in industrial base composition that these models are founded on, even at a descriptive level. Such basic knowledge is necessary to inform ongoing empirical research on incentive use, particularly as various economic growth outcomes are reconsidered and redefined.
By taking advantage of simulated data on incentives and taxes from the new Panel Database on Incentives and Taxes (PDIT), establishment and employment data from disaggregated industry classifications from the Wholedata Establishment and Employment Database, characteristics of the local business environment from the American Community Survey, and local government policy from the Annual Survey of State and Local Government Finances, this article explores the relationship between incentives and metropolitan statistical area (MSA) 1 economic diversity between 2005 and 2015. In taking up this understudied aspect of business tax incentives, this article contributes in four ways. First, it moves away from examining individual firm location decisions and looks at the result of aggregated location behavior on a concept fundamental to both growth theories and economic development practice: industrial base composition. Second, it looks at change over a longer period than typically examined in studies of incentive use, 11 years, which captures both short- and long-term changes in the MSAs’ economic bases. Third, it uses 46 MSAs, including all the country’s largest metropolitan areas, as the units of analysis. This fairly fine-grained unit of analysis and geographic comprehensiveness is relatively uncommon in incentive studies. Finally, it utilizes simulated incentive data unique in its comprehensive scope and scale, an improvement on existing simulated databases of incentive use.
After reviewing relevant literature and establishing a conceptual framework for subsequent analysis, descriptive statistics and panel regressions are used to examine the relationship between MSA-level industrial diversity and incentive use. The article first examines the relationship between MSA-level industrial diversity and the use of five types of business tax incentives. Next, the article examines whether economic development incentives are associated with a change in industrial diversity over time. To measure these effects, a diversity index is regressed on lagged measures of incentive use and on business environment and policy controls with year and MSA fixed effects. Our descriptive analysis shows that MSAs with the least diverse economic bases offer more incentives to the industries in their bases. There is also evidence that, regardless of an MSA’s level of diversity, incentives are offered at a higher rate to industries with the lowest employment concentration; this is especially true of MSAs with the lowest levels of baseline industrial diversity. Results from panel regressions of lagged measures of incentive use on a diversity index demonstrate a positive relationship between customized job training subsidies and changes in diversity over time in the short term; in the medium term, property tax abatements and research and development (R&D) credits are associated with changes in diversity. Subgroup analysis based on initial level of diversity show more pronounced relationships between incentives and diversity: MSAs with the highest initial levels of diversity show a significant association between investment tax credits and movement toward decreased diversity. MSAs with the lowest initial levels of diversity show significant association between job creation tax credits, income tax credits, R&D credits, and customized job training subsidies and changes in diversity. The article briefly discusses these results and concludes with implications for policy and practice.
Conceptual Framework and Literature
The existing empirical research on incentives focuses mainly on evaluating whether incentives influence firms’ location behavior and subsequent growth outcomes. The foundation of this stream of research is firm location theory, which holds that firms seek to optimize their physical location to maximize profits (Moses, 1958). When multiple locations could be suitable, firms will choose the location that most minimizes their costs. Competition thus ensues between local governments eager to stimulate growth by adding new firms to their area. Local communities may use a mix of economic development strategies to attempt to influence location decisions. Strategies such as economic base theory, industrial targeting, and clusters rely on identifying particular industries that support generating local wealth (Reese & Sands, 2013). However, while some communities might strategically target key growth industries to support, others may instead attempt to hold on to legacy industries. Baldwin and Robert-Nicoud (2007), for example, presented a model that explains government support of struggling industries at the expense of expanding industries as a function of lobbying and sunk costs that create greater potential rents for lagging industries. Rent-seeking action on the part of firms also points to the potential political gains to local politicians that can be gleaned from incentive schemes (see, e.g., Coyne & Moberg, 2015). Alternatively, in some cases, local economic development officials may be happy to just respond to whichever businesses might have an interest of locating in their community (Rubin, 1988).
Implicit in commonly used economic development policies that seek to attract new firms to an area, like incentives, is the assumption that attracting firms leads to growth through simply having more local businesses (Zheng & Warner, 2010). More firms translate into more jobs, more wages, and thus more growth, a strategy Hammer and Pivo (2017) labeled as “more of the same” (Flammang, 1979). Measures of such growth outcomes in evaluations and other empirical studies have included increases in jobs, higher wages, increased income, more firms in the area, more firm births, plant expansion, relocations, and higher gross domestic product (GDP; Courant, 1994; Peters & Fisher, 2004). Patrick and Stephens (2020) have extended work such as this to examine the industries that are incentivized. They found that targeting incentives on higher wage and creative class industries may have detrimental effects on employment in working-class and middle-wage industries. Reflecting on the variable success and substantial cost of incentive schemes, some scholars argue that economic developers might define successful growth as more than simply counting jobs, focusing on more holistic measures of growth or development as key outcomes. These alternative measures might include stability, resiliency, or growth as operationalized by new growth theories (Acemoglu, 2012; Aghion et al., 1999; Spelman, 2006).
The core of both the traditional and alternative foci is the composition of the area’s economic base, and whether and how much it is specialized or diversified (where diversity means having a higher portion of differentiated industries in the economic base). Literature on stability and resiliency has discussed economic base composition in terms of broad-based industrial diversity, dating back at least to Chinitz’s (1961) discussion of the benefits of diversity in cities like New York and costs to specialization in cities such as Pittsburgh. Growth theories and the cluster approach (Porter, 1990) discuss the relative merits of concentration of related industries and intense specialization. The relationship between growth and changes in industrial base composition has motivated important research, particularly on theories of dynamic externalities, agglomeration, and clustering (Glaeser et al., 1992). The scholarly exchanges on Marshall–Arrow–Romer (MAR) versus Jacobs (1969) agglomerations, as well as Porter’s work on urban agglomeration, all engage industrial base composition and its relative benefits for growth outcomes. In the MAR model, the local economy benefits from agglomeration economies generated by knowledge spillovers that accrue from a density of firms in the same industry (Chen, 2020). On the other hand, Jacobs agglomerations stem from spillovers generated by firms in a diverse variety of industries (Frenken et al., 2007).
Subsequent to Glaeser et al. (1992), many papers have examined relationships between the composition of the economic base and productivity and growth. As De Groot et al. (2016) found in their meta-analysis of 73 articles, there are benefits to agglomeration economies stemming both from specialization and diversity. While the literature has thoroughly examined the implications of agglomeration economies, as well as ways to measure diversity and concentration (e.g., Chen, 2020; Frenken et al., 2007; Jackson, 1984), very few have examined whether the incentives that are now so ubiquitous actually affect industrial structure. In the growth literature, some research on regional economic development in Europe has pursued this line of reasoning more or less directly (Neffke et al., 2011; Özçelik & Taymaz, 2008). For example, Barrios et al. (2006) looked at the impact of incentives on multinational corporations’ location decisions in the Republic of Ireland and found that incentives had no impact on the resulting diversity of the economic bases of disadvantaged areas. Garcia-Mila et al. (2002) proposed a promising model outlining the use of incentives to build agglomeration economies, taking a portfolio approach to the locality’s industrial base. Borrowing from finance theory, this approach proposes that taking risks must be rewarded with higher returns and that maintaining a portfolio of assets that have low correlations in terms of growth rates can help reduce overall risk. Thus, the portfolio approach implies a trade-off of slower growth in exchange for greater stability and resilience. Consistent with that, Chiang (2009) and Brown and Greenbaum (2017) both found empirical evidence of economic diversity buffering the effects of economic downturns as evidenced by lower relative unemployment rates at the cost of higher relative unemployment rates during periods of greater prosperity. Wagner and Deller (1998) and Spelman (2006) both contended, however, that there are ways to manage an economy’s portfolio to minimize these trade-offs between diversity and growth. Chen (2020) found that cluster diversity can lead to both increased stability and growth.
Thus, our departure is to examine whether more intense economic development incentive use is associated with greater industrial diversity. We investigate the following research questions: First, is there a relationship between MSA-level industrial diversity and incentive use? Are incentives generally associated with an increase in industrial diversity over time? Relatedly, are specific types of incentives associated with an increase in diversity over time? Is this influenced by business environment or local government factors previously shown in the literature to affect the location decisions that accumulate over time to affect industrial base composition? It should be clarified that describing the relationship between incentives and diversity does not necessarily imply that broad-based diversification or agglomeration are more worthy growth and development objectives. While this article does not seek to add to this debate, it will provide additional information that is relevant to these ongoing scholarly discussions.
Data Sources, Research Design, and Methods
This article takes a descriptive approach to investigate the relationship between incentive use and changes in industrial base diversity. The analysis utilizes two main data sets. Incentive offers for 45 industries across 33 U.S. states and 47 MSAs were sourced from the PDIT, a simulated database of incentive offers created by researchers at the W.E. Upjohn Institute for Employment Research (Bartik, 2017). These locales were selected by the PDIT creators to achieve broad geographic coverage and comparability with other incentive-offer databases. According to the PDIT methodological documentation, they represent the main cities in 30 of the largest metropolitan areas in the United States, with an additional 14 cities representing the largest metropolitan areas in their states (Bartik, 2017). In total, these metropolitan areas amounted to 61% of private sector GDP in 2013 (Bartik, 2017). All but one of these MSAs were retained for matching to establishment data; thus, 46 MSAs were used in the analysis. 2 Table 1 lists these MSAs. Eleven of the 26 years in the database, covering the period between 2005 and 2015, are utilized in our analysis. The decision to use fewer years than the full 26 years offered in the PDIT was made to accommodate the more limited number of years of data available from the Annual Survey of State and Local Government Finances (U.S. Census Bureau, 2005-2015), our source for policy control data.
List of MSAs Included in Analysis.
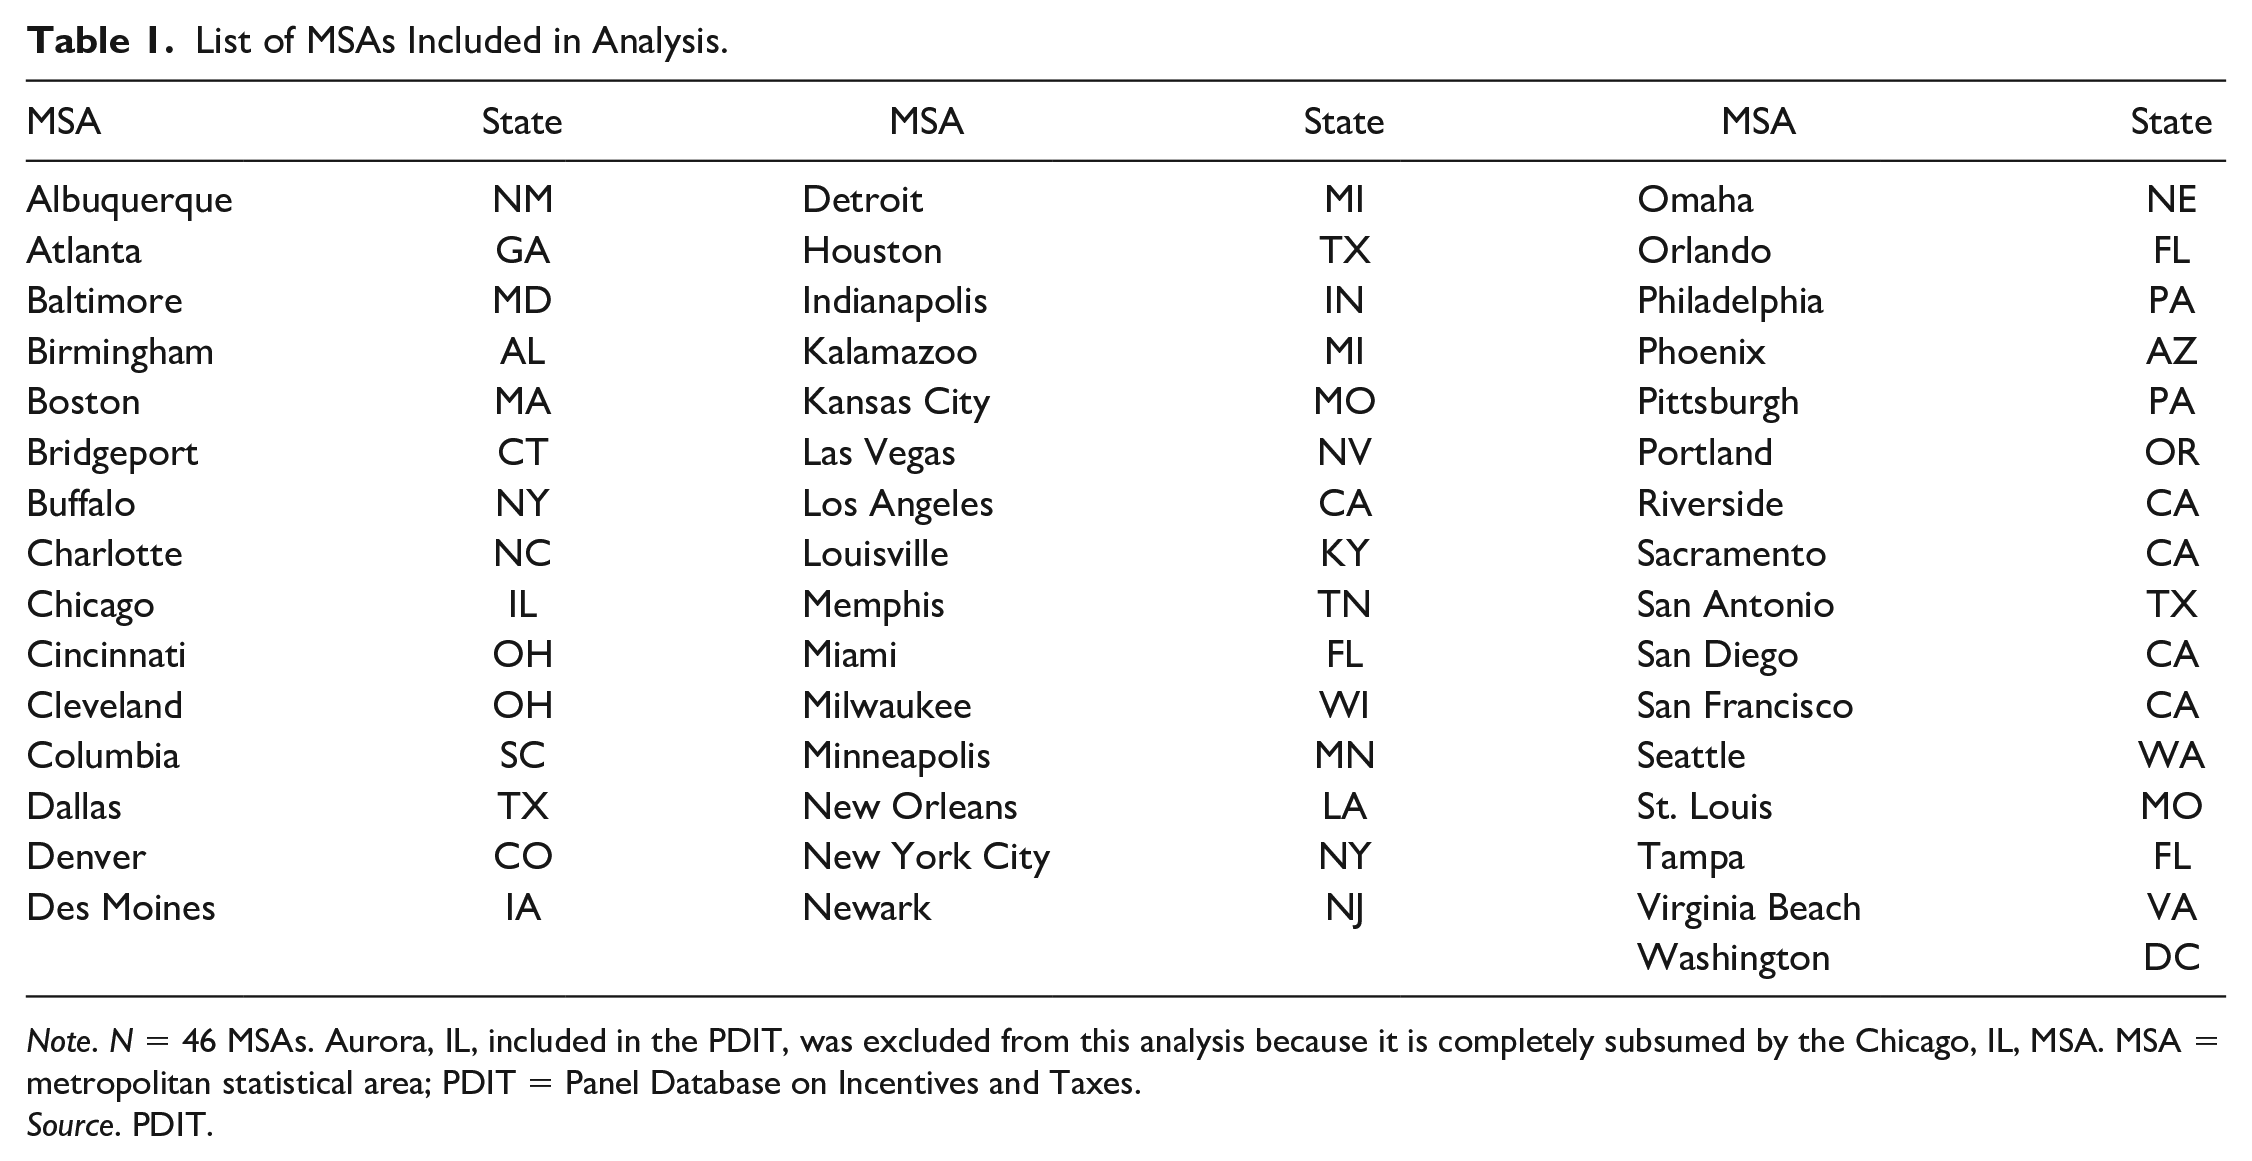
Note. N = 46 MSAs. Aurora, IL, included in the PDIT, was excluded from this analysis because it is completely subsumed by the Chicago, IL, MSA. MSA = metropolitan statistical area; PDIT = Panel Database on Incentives and Taxes.
Source. PDIT.
The incentive types included in the PDIT, and thus used in our analysis, are job creation tax credits, R&D credits, property tax abatements, investment tax credits, and customized job training subsidies. PDIT methodological documentation explains that these incentives were selected because they represent a “standard deal” that might be made to a “medium-sized export-base new facility” (Bartik, 2017). Though there are certainly other incentives frequently used by local governments, these five were selected by PDIT creators because these represent the bulk of incentive money commonly made available to firms in a metropolitan area, particularly medium and medium-large export-base industries (Bartik, 2017). 3 Table 2 further describes incentive inclusion and exclusion criteria as documented in the PDIT technical appendix (Bartik, 2017). Incentive offers from the PDIT are measured as a ratio of incentive value to industry value added and are discounted at 3%. 4 We retain all incentive types for our analysis. We utilize incentives in their ratio form and in the form of a time-varying dichotomous variable indicating whether the incentive was offered in the MSA a particular year.
Inclusion, Exclusion Information for Incentives From PDIT.

Note. PDIT = Panel Database on Incentives and Taxes.
Source. Bartik (2017).
Establishment and employment data are used to create a measure of industrial diversity. To do this, we use unsuppressed county-level employment data from the Wholedata Establishment and Employment Database (Wholedata). The Wholedata data set includes comprehensive employment data for 2,015 industries per year. Because the PDIT contains select industries to appropriately estimate incentive values, it does not reflect the full range of industry classifications contained in the Wholedata database; Table 3 presents the industries included in the PDIT and in this analysis. According to PDIT technical documentation, the 45 industries included in the database cover over 90% of the private-sector employment and wages of the MSAs in the database, so we can be confident that the vast majority of economic activity in an MSA is covered by these industries (Bartik, 2017, pp. 12-14). 5 We preserve employment data for these 45 industries. Thus, for the purposes of this article, an MSA’s industrial base may be comprised of any combination of (or all) the 45 industries in that MSA included in the PDIT in a given year. To correctly match PDIT industries to Wholedata industries, PDIT industries were assigned North American Industry Classification System codes according to raw data used to compile the PDIT, provided by the W.E. Upjohn Institute for Employment Research. This ensured that employment figures from the Wholedata files reflected precisely the industries intended by the PDIT industry category and was important to avoid undercounting or overcounting industry employment.
Industries Included in PDIT.
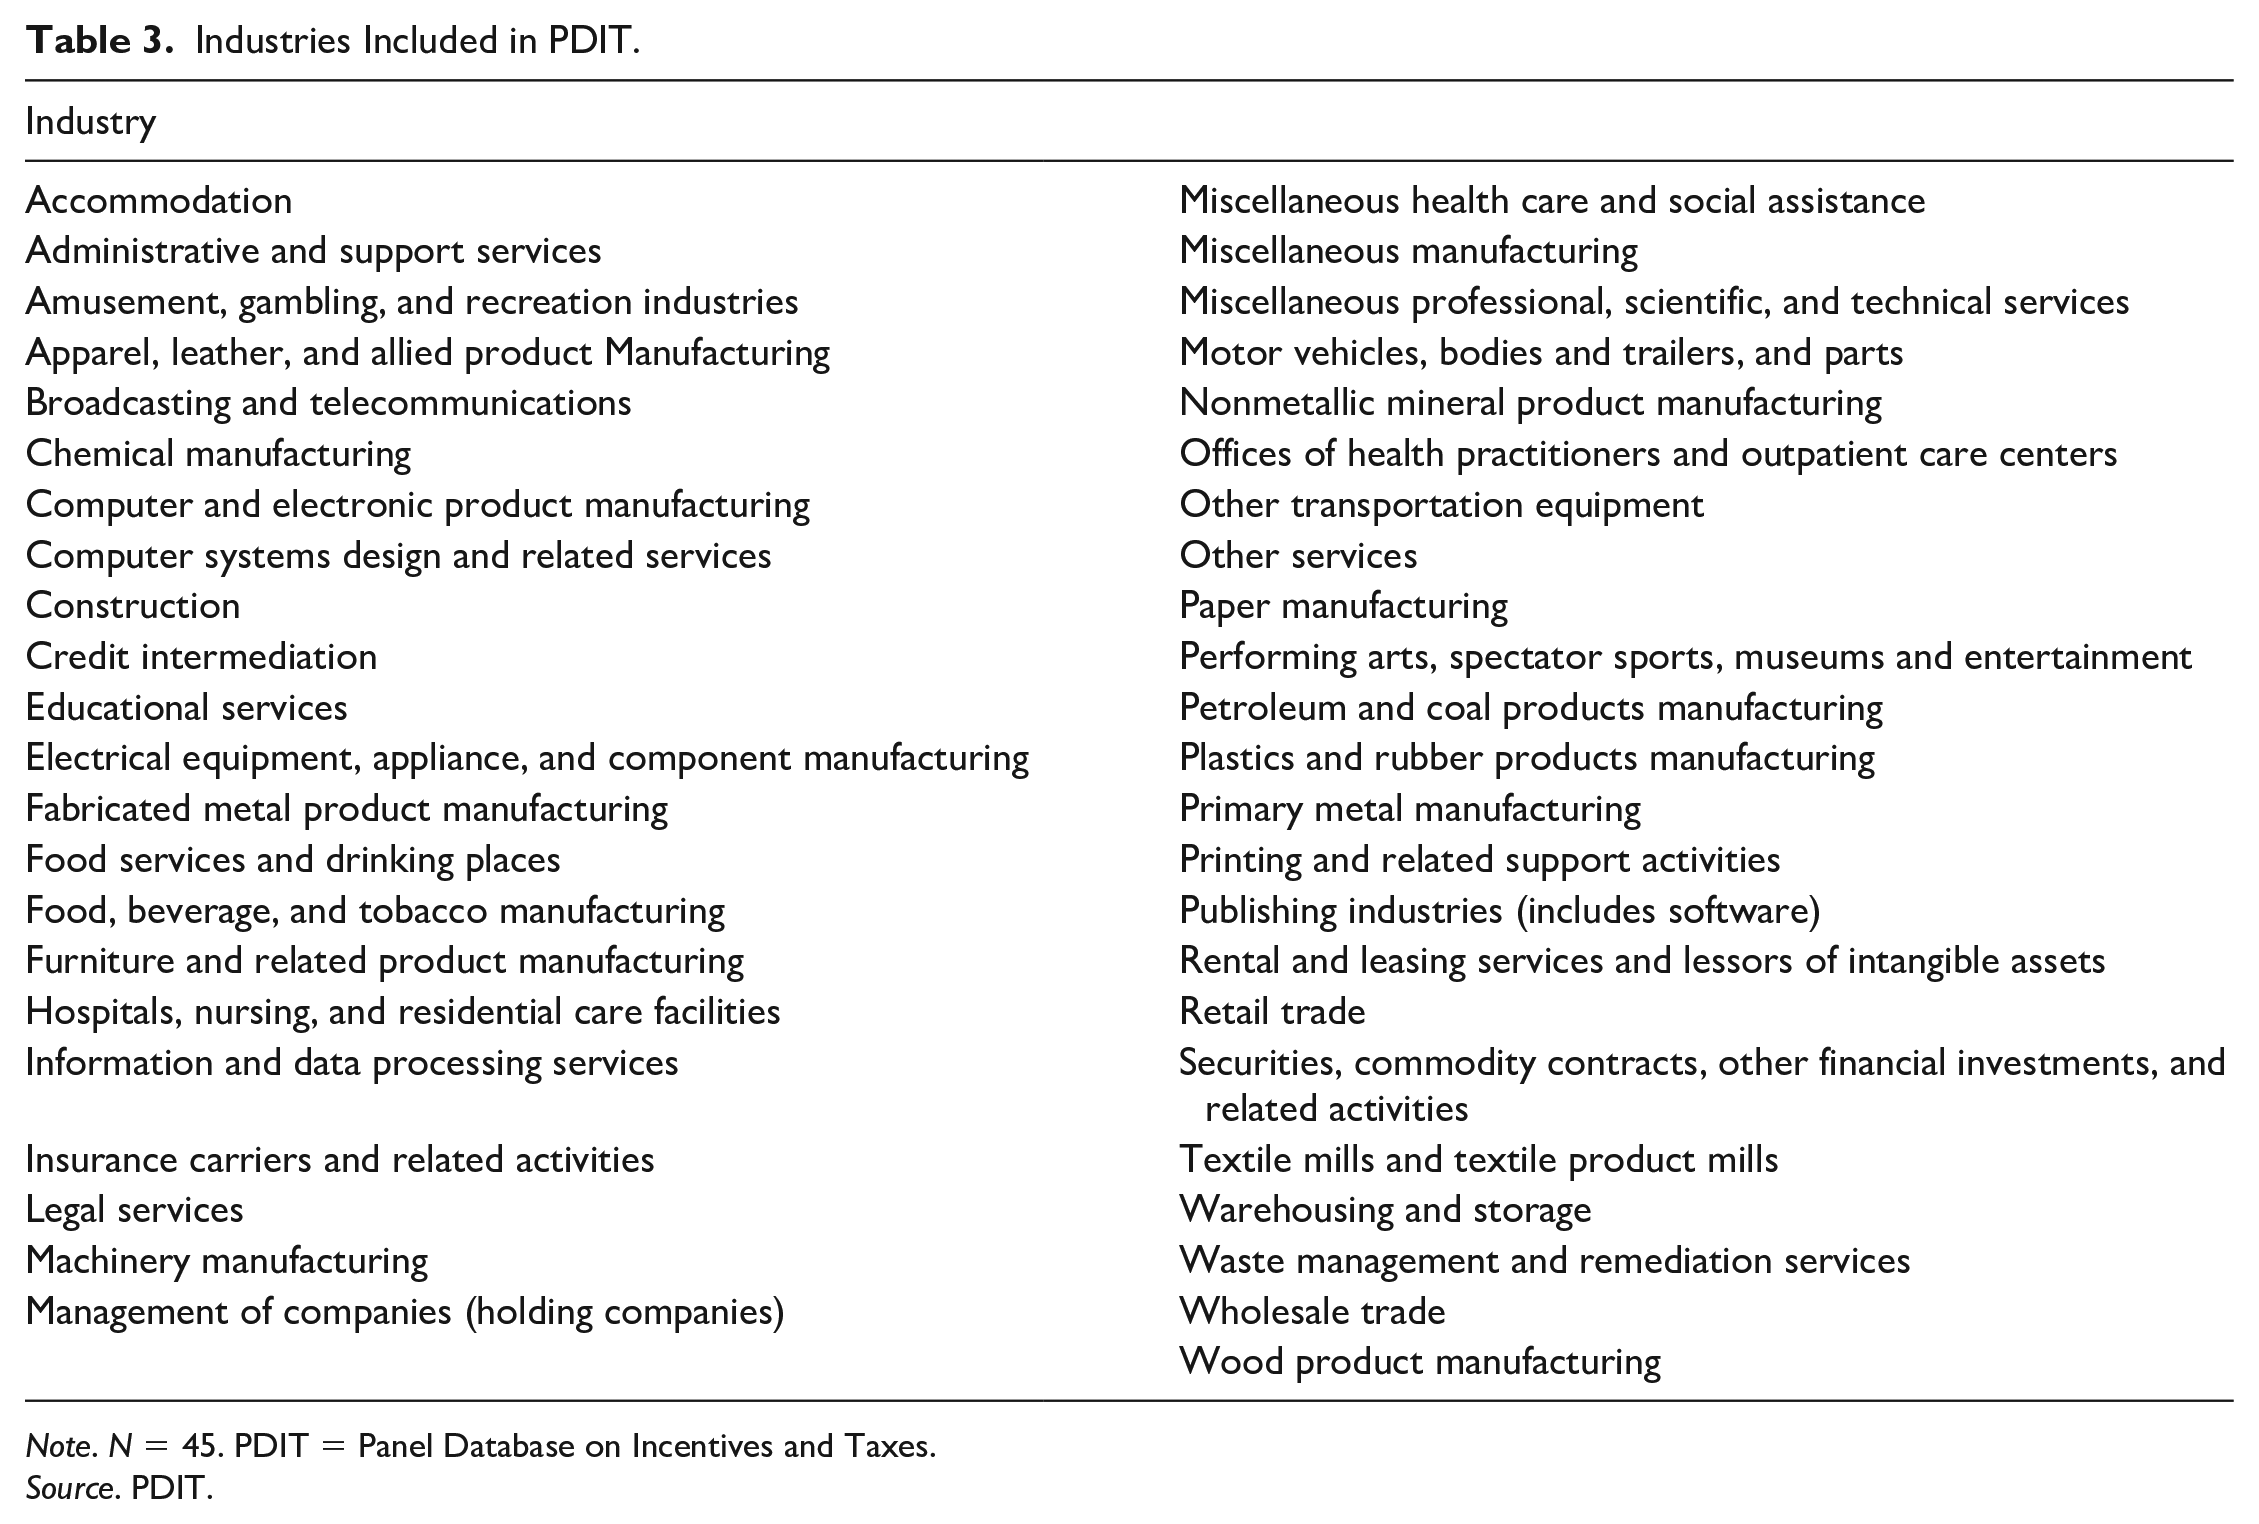
Note. N = 45. PDIT = Panel Database on Incentives and Taxes.
Source. PDIT.
Two key variables were constructed from this employment data for subsequent descriptive analysis. The first was a diversity index (DI), an entropy measure of industrial diversification at the MSA level. This was constructed by taking the negative of the summation of the product of the portions of employment in the PDIT industries multiplied by the natural logarithm of those proportions (Kort, 1981).

As seen in Equation 1, pis =
The DI is calculated for an MSA for each year in the panel. At baseline, MSA’s DI scores range from .012 to .22, with a median of .066. The maximum possible value of the DI in any year is 3.80 and the maximum observed value at baseline is .22; the maximum value observed across the panel is also .22. Figure 1 demonstrates the spread of MSAs’ DI scores in the base year of the analysis, 2005. The range of DI scores is broken into quartiles at baseline (2005), with the first quartile representing the lowest DI scores (ranging from .012 to .045 in 2005) and thus the lowest levels of baseline diversity, and the fourth representing the highest DI scores (ranging from .10 to .22) and thus the highest levels of baseline diversity. It is notable that MSAs are tightly clustered in the lower two quartiles and are comparatively less clustered in the upper two quartiles at baseline. The largest MSAs are generally in the fourth quartile. Figure 1 shows this clustering.
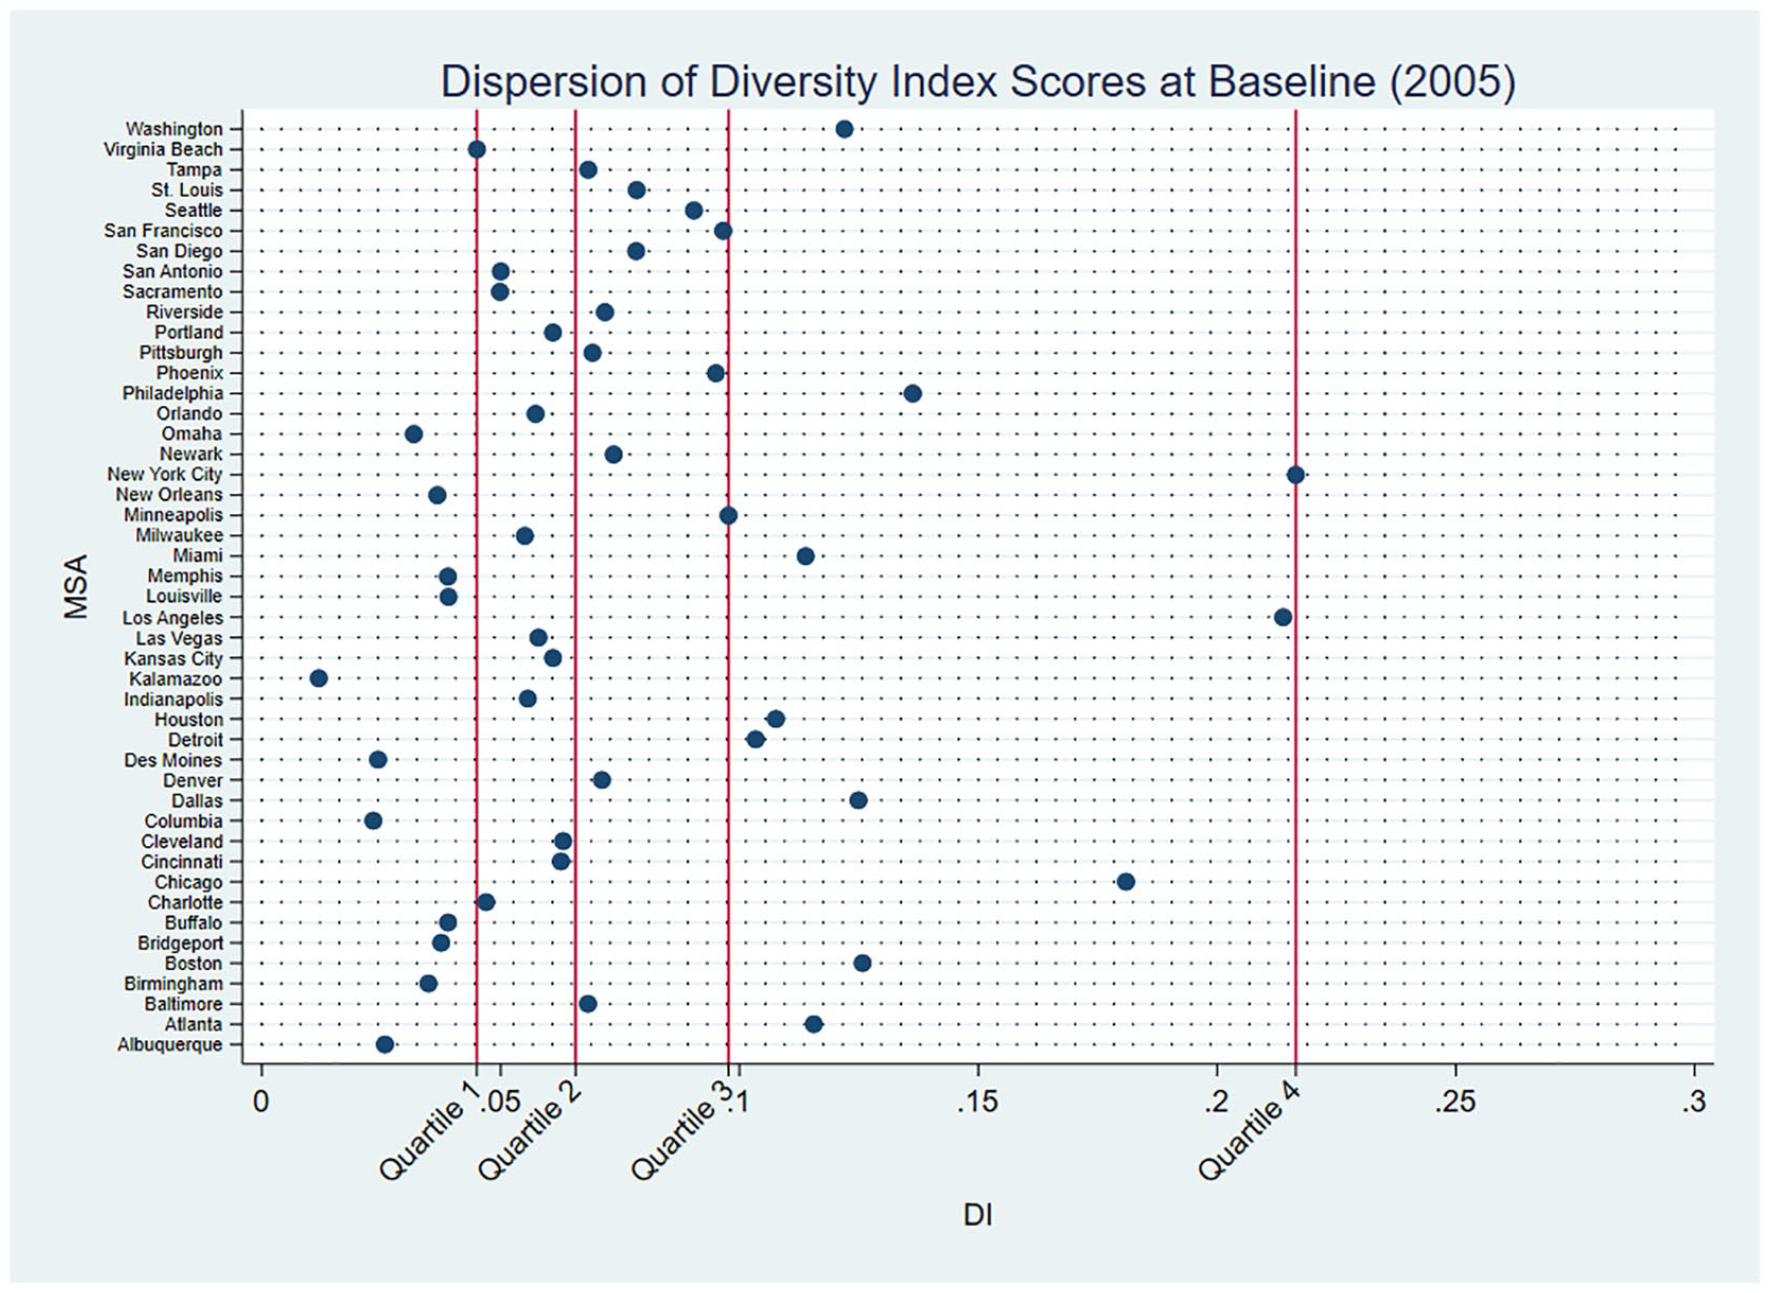
Dispersion of diversity index scores at baseline.
The second set of measures constructed were location quotients (LQ), which measure specialization or concentration of employment in an industry within an MSA relative to the other MSAs in the PDIT. A higher LQ for an industry in an MSA indicates greater concentration of an MSA’s employment in that industry. While the DI encompasses the spread of employment in all industries in an MSA’s economy, LQs capture employment concentration within a single industry. LQs are used in initial descriptive analysis to examine patterns of incentive offers and targeting. At baseline, LQ values ranged from 0.0094 to 13.84, with a median of 0.90.
Because the research questions proposed are descriptive in nature, panel descriptive statistics are first used to explore basic relationships between incentive use and industrial base diversity, including the frequency of incentive offerings and the portion and characteristics of industries in the base to which incentives are offered. For this initial analysis, the data are structured as three-level, with time nested in industries nested in MSAs; the unit of analysis for these initial descriptive statistics is the MSA industry (e.g., the accommodation industry in Albuquerque).
Descriptive Results and Discussion
Examining the relationship between any change in industrial base diversity and incentive use first requires understanding baseline characteristics of MSAs’ industrial composition, incentive use patterns, and administrative characteristics that could influence variation in diversity. We begin by assessing the diversity of MSAs’ industrial bases as measured by employment dispersion across each of the 45 industries by MSA in the baseline year, 2005, as captured by the DI. Overall, we observe variation over time in MSAs’ DI scores, though the net change is often quite small. This is more specifically illustrated in Table 4, which lists the five most and least diverse MSAs at baseline (2005) and at the end of the analysis period (2015), along with their DI scores at each time.
Most and Least Diverse MSAs in 2005 and 2015.
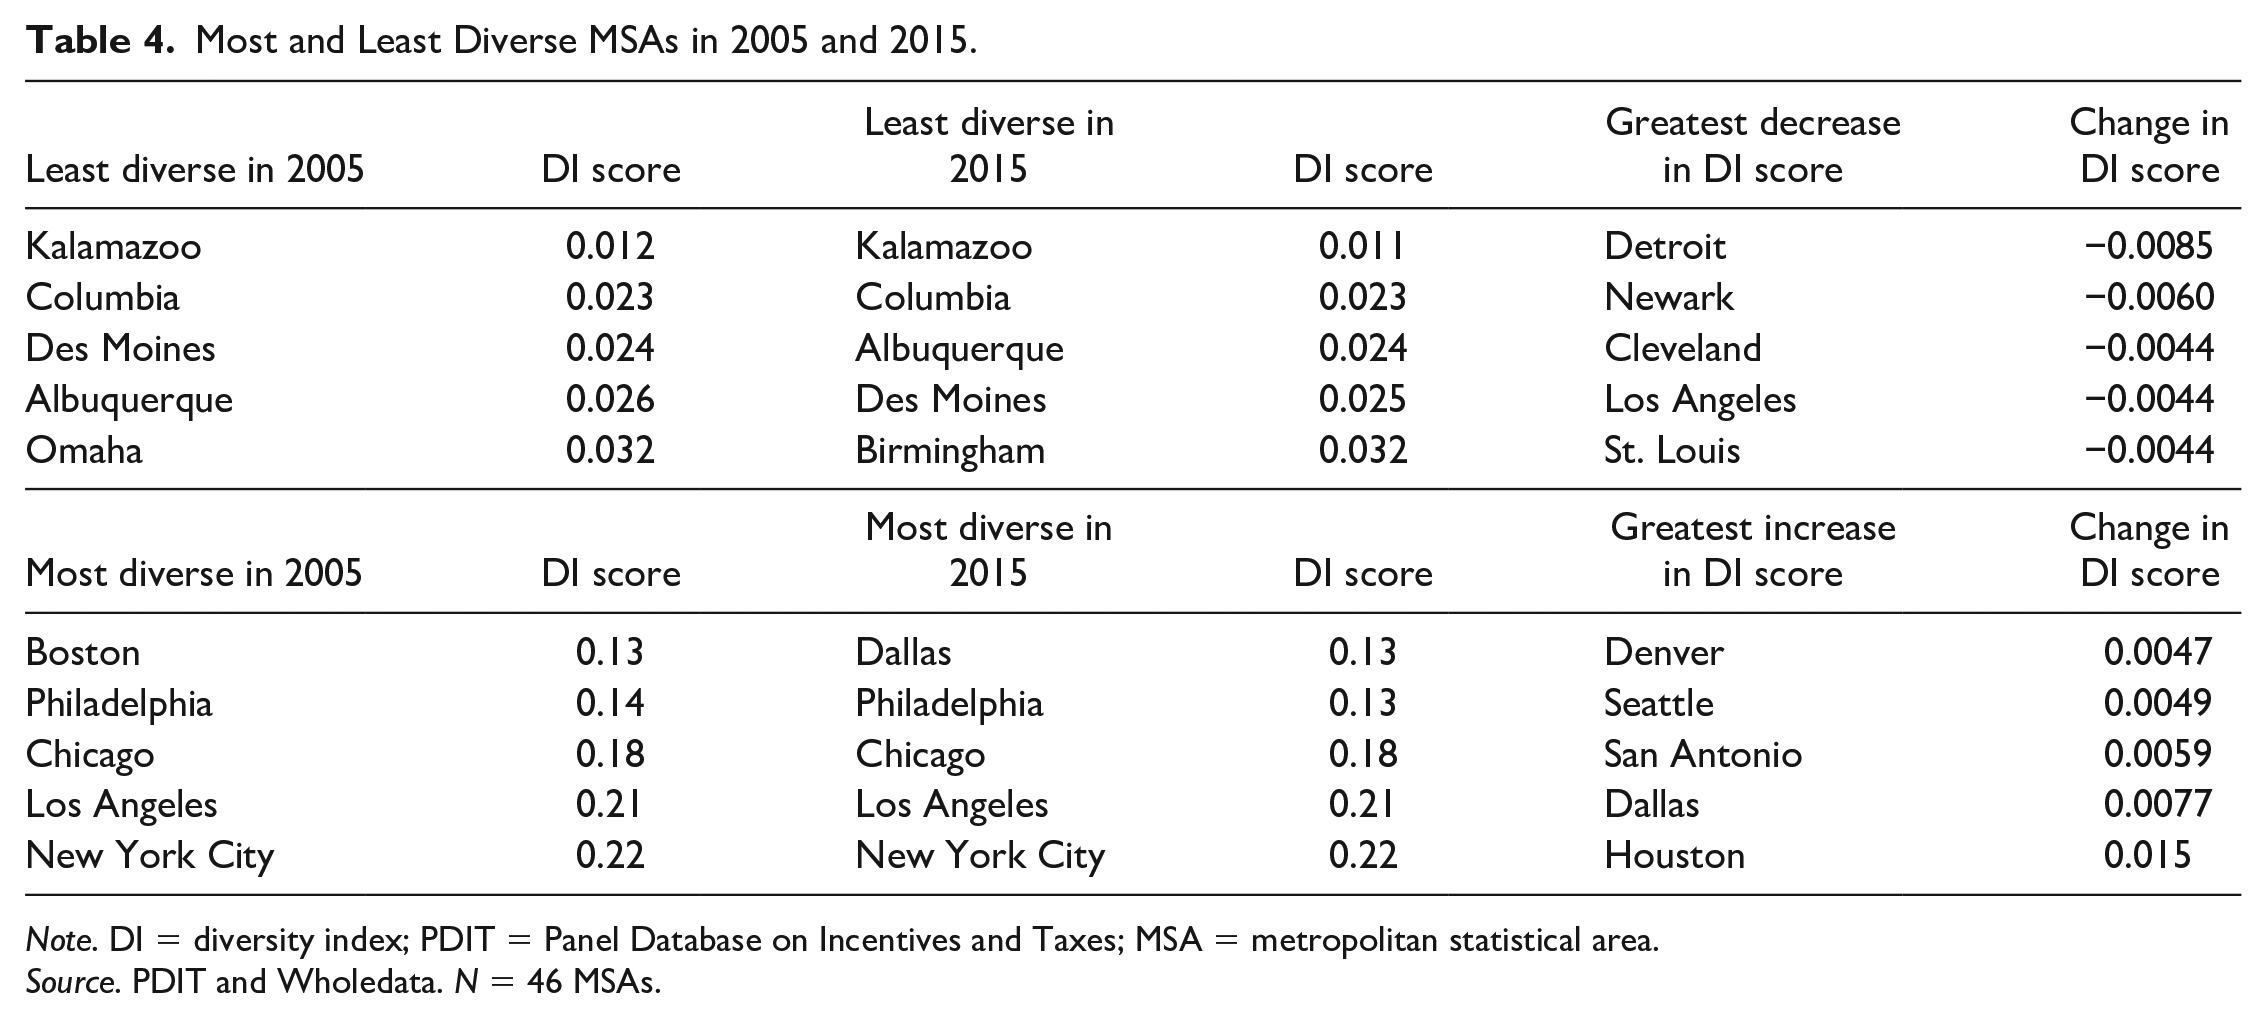
Note. DI = diversity index; PDIT = Panel Database on Incentives and Taxes; MSA = metropolitan statistical area.
Source. PDIT and Wholedata. N = 46 MSAs.
Table 4 demonstrates relative permanency of incumbents in the most diverse group. Indeed, four of the most diverse MSAs in 2005 (Los Angeles, Chicago, Philadelphia, and New York City) always appear in the five most diverse MSAs across the 11-year panel. There is very little change in the DI scores of the top five most diverse MSAs over the analysis period, with the largest net change in DI score of these MSAs over the panel being a decrease of 0.0044 for Los Angeles. There is similar incumbency among MSAs least diverse at the baseline: Four of the five least diverse MSAs in 2005—Kalamazoo, Columbia, Des Moines, and Albuquerque—were among the least diverse MSAs in 2015. It is notable that MSAs with the highest DI scores tend to be larger MSAs while those with the lowest DI scores tend to be smaller. Examining transition probabilities confirms these findings. Changing focus to look across the panel (2005-2015), the likelihood of ever being in the quartile of most diverse MSAs was 37%; of those MSAs ever in this quartile, 65% were always in the quartile. In fact, year to year, there is an 80% chance that an MSA in the most diverse quartile would remain in that quartile. For the least diverse quartile, 50% of MSAs were ever in the lowest quartile of the DI, and MSAs that were ever in the lowest quartile spent 52% of their panel years in that quartile. The likelihood of transitioning to any other quartile from the lowest quartile across the years was 28%.
These indicators point to a minor degree of change in the diversity of MSAs’ economic bases over time, and substantial net movement is rare. Based on examining net change and transition probabilities, membership in the most and least concentrated quartiles seems to be “sticky,” with a high propensity to remain in the DI quartile in which an MSA started in 2005. Comparing the transition probabilities between the most and least diverse quartiles over time, there is greater likelihood of net movement (either to diversify or concentrate) among the least diverse MSAs and comparatively little net movement among the most diverse MSAs. Despite this, the tighter range in DI values in the least diverse quartile compared with the wider spread in the most diverse quartile means that real, net gains in economic diversity are small. Despite year-to-year fluctuations, the diversity of MSAs’ economic bases are fairly stable over time, and thus it seems likely that incentives would need to have a substantial effect on business location decisions for a relationship to be detected.
While one avenue for observed diversification is growth from the addition of employment in emerging local industries, increased diversification could arise from decline through deindustrialization and related losses in an MSA’s major industries. To examine the possibility that diversification might be a function of employment loss rather than job growth, we compared MSAs’ average growth rates at the baseline and over the 11-year analysis period and found diversification to be driven by growth, although we cannot prove causality. The 18 MSAs that became more diverse over the panel had statistically significantly faster employment growth rates than the 28 MSAs that did not become more diverse (an average growth rate of 0.14 percentage points per year versus 0.034 percentage points; p < .01). Significant differences in employment growth rates were also observed when disaggregating manufacturing and export industries (p < .01). MSAs that became more diverse had higher growth rates in their manufacturing industries and in their export industries than MSAs that did not. When examining changes in the industries with the greatest share of employment in the base year, all MSAs except for Las Vegas posted a net decline in employment in at least one of the MSA’s five top-ranking industries by 2015. 6 Thus, while all MSAs experience decline in industries with the most concentrated employment (i.e., highest LQs) at baseline, MSAs that do not increase in diversity over the panel experience decline more acutely and across a larger portion of their employment portfolio.
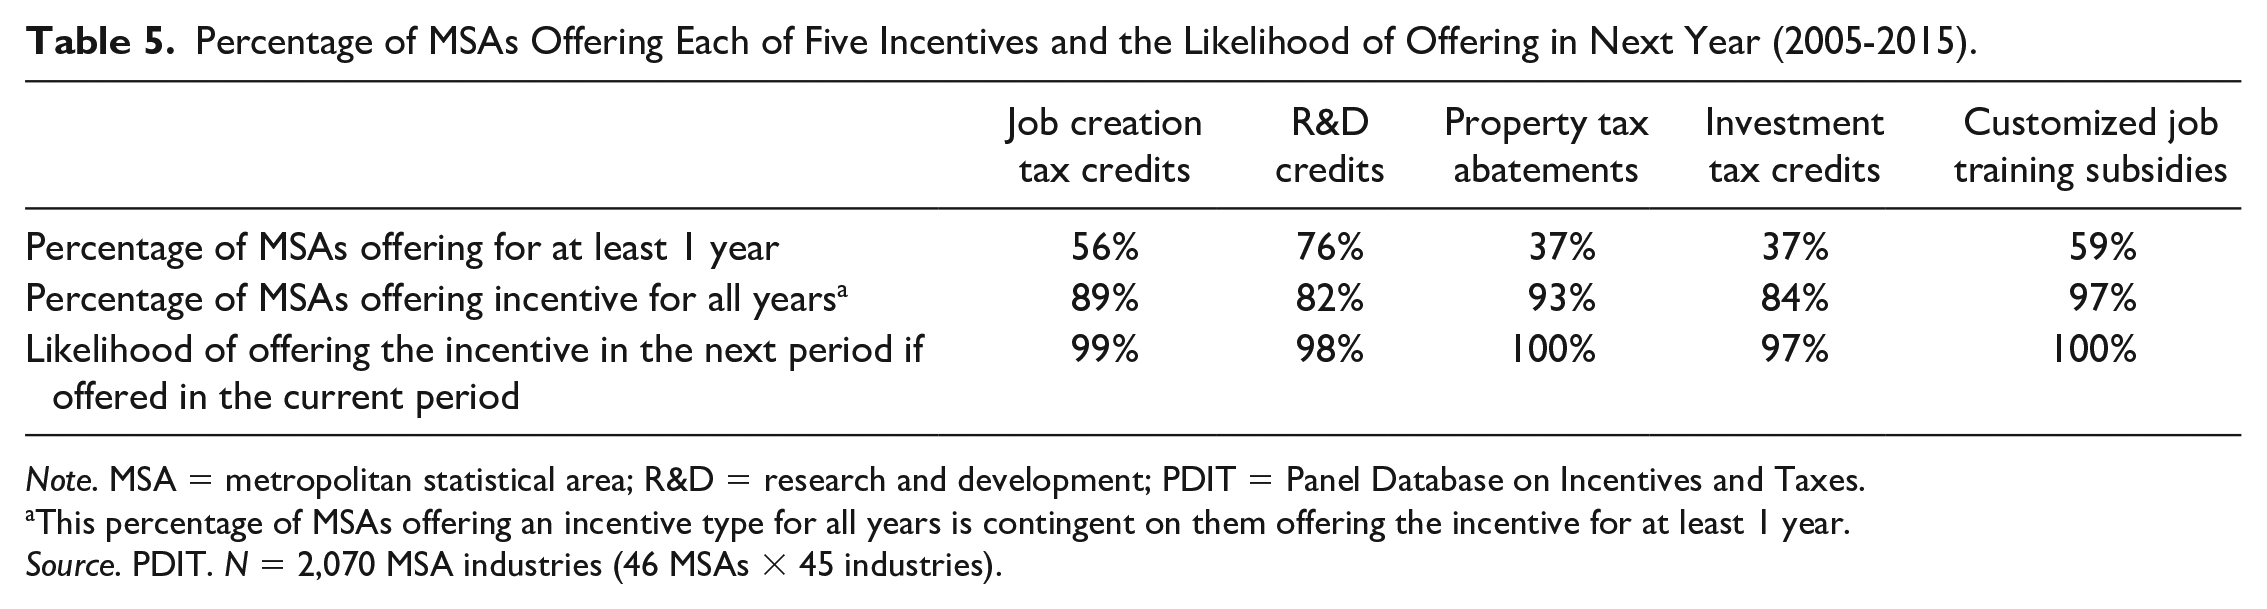
In addition to examining changes in diversity, we trace variation in incentive use to understand how MSAs are implementing incentive schemes. This is particularly necessary to detect strategic targeting. The first notable pattern of incentive use emerges when examining the prevalence of incentive offers. Table 5 shows that the majority of MSAs offer job creation tax credits, R&D credits, and customized job training subsidies across the panel.
Percentage of MSAs Offering Each of Five Incentives and the Likelihood of Offering in Next Year (2005-2015).
Note. MSA = metropolitan statistical area; R&D = research and development; PDIT = Panel Database on Incentives and Taxes.
This percentage of MSAs offering an incentive type for all years is contingent on them offering the incentive for at least 1 year.
Source. PDIT. N = 2,070 MSA industries (46 MSAs × 45 industries).
Across all MSAs and across the full panel period, on average, property tax abatements and investment tax credits were offered by the fewest MSAs (37%), while R&D credits (76%) and customized job training subsidies (59%) were offered by the most. All MSAs offered at least one of the incentives at some point in time, and 22% offered all five types of incentives at least one point in time (though no MSA offered all types of incentives for the full panel; the maximum number of years that all types of incentives were offered was four). The bottom row of Table 5 demonstrates that MSAs that offered a particular incentive in any given year were extremely likely to continue to offer the incentive in the subsequent year. There is low variation over time in whether incentives were offered. This is true for all incentive types.
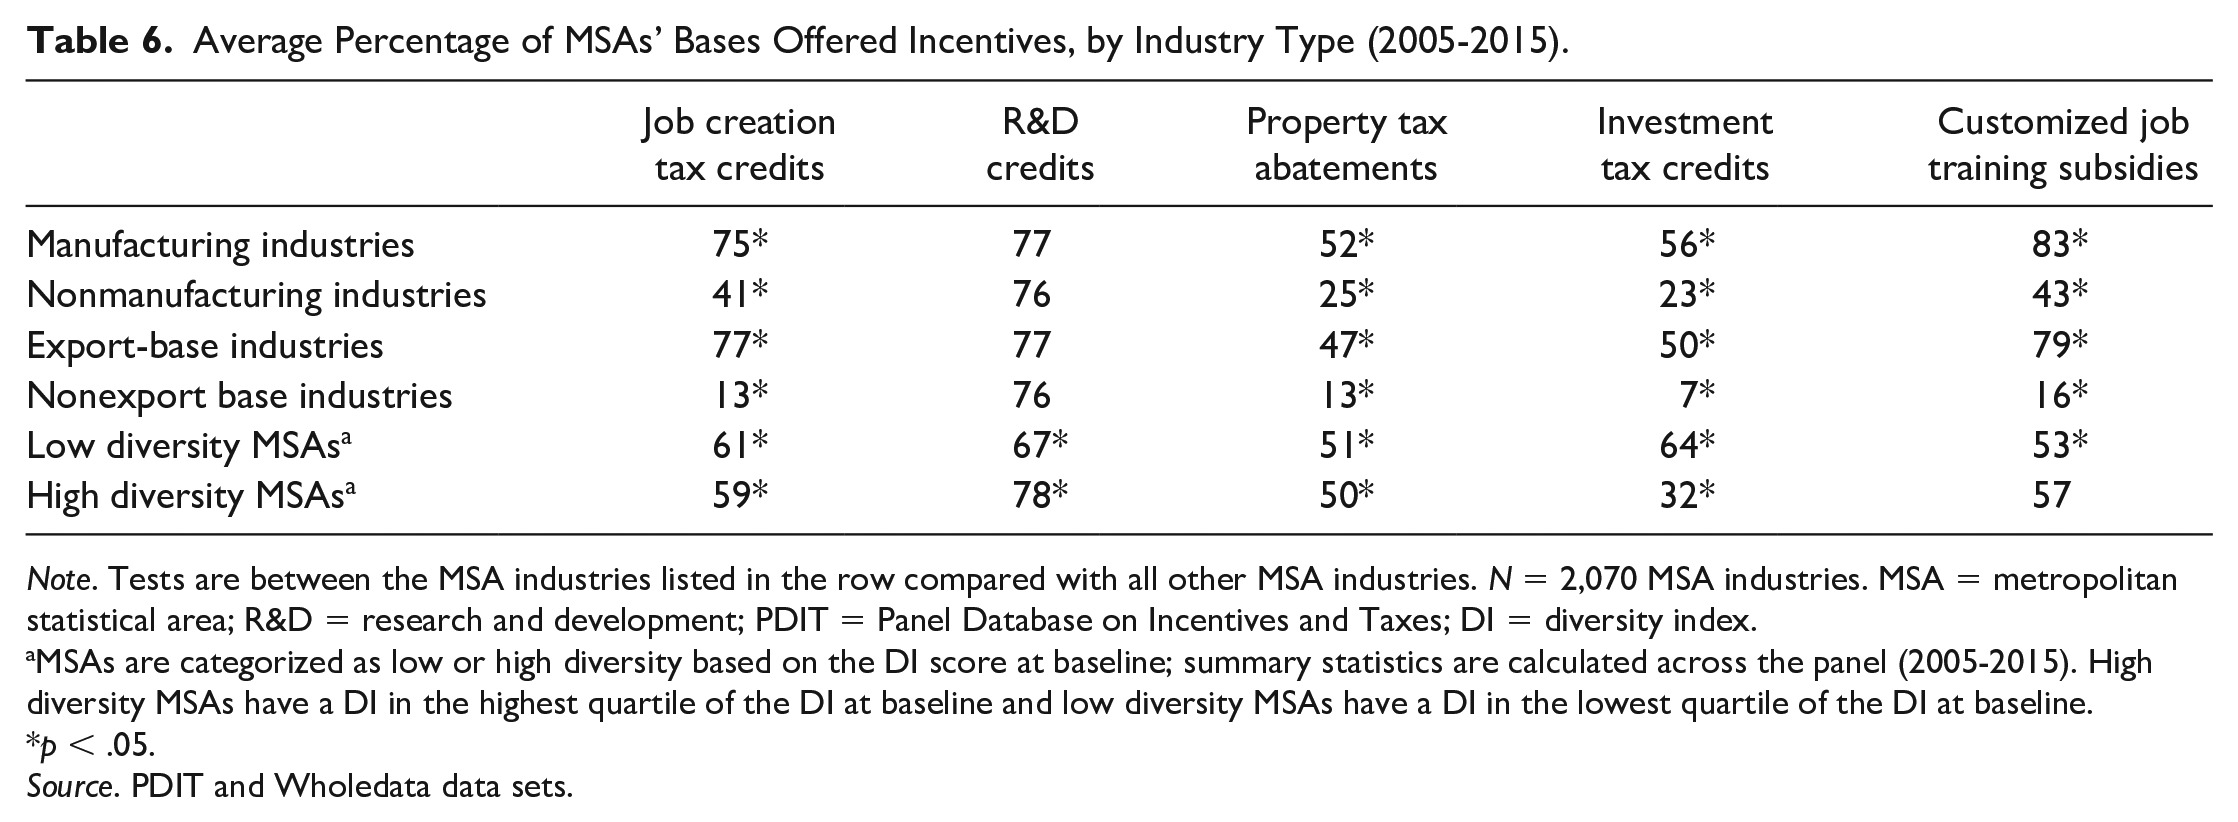
This becomes somewhat more nuanced when broken out by MSAs’ level of diversity at baseline. Table 6 shows MSAs in the highest and lowest DI quartiles at baseline-offered incentives to a significantly greater portion of their base across the panel years than all MSAs not in these DI quartiles at baseline. These differences indicate that we may detect different relationships between incentive use and diversity across low and high diversity subgroups.
Average Percentage of MSAs’ Bases Offered Incentives, by Industry Type (2005-2015).
Note. Tests are between the MSA industries listed in the row compared with all other MSA industries. N = 2,070 MSA industries. MSA = metropolitan statistical area; R&D = research and development; PDIT = Panel Database on Incentives and Taxes; DI = diversity index.
MSAs are categorized as low or high diversity based on the DI score at baseline; summary statistics are calculated across the panel (2005-2015). High diversity MSAs have a DI in the highest quartile of the DI at baseline and low diversity MSAs have a DI in the lowest quartile of the DI at baseline.
p < .05.
Source. PDIT and Wholedata data sets.
It is also possible that we could observe variation in diversity due to MSAs’ differential targeting of incentives to manufacturing and export industries. With the exception of R&D credits, manufacturing and export-base 7 industries were much more likely to be offered any of the five incentive types at baseline than non-manufacturing and non-export-base industries. Manufacturing and export-base industries have nearly double the incentive coverage (or more) of non-manufacturing and non-export-base industries, differences that are statistically significant at p < .05 for all incentive types except R&D credits. Incentive offers to manufacturing and export-base industries show patterns of high persistence over time: Once offered, the incentives tended to be offered for duration of the panel. We would thus expect to see MSAs with greater concentration of manufacturing and export industries more susceptible to any effect of incentives on diversity.
Variation in incentive use is also observed across industry concentration. Table 7 demonstrates that, in general, industries with the lowest LQs in an MSA (defined as industries with LQs in the bottom 25% of LQs in any year) had greater incentive coverage across panel years than industries with higher LQs. In other words, a greater percentage of industries with the lowest numbers of people employed were offered all incentive types but R&D credits (in comparison to all other quartiles of industry LQs). There is no significant difference in the percentage of industries with the highest LQs in an MSA (defined as industries with LQs in the top 25% of LQs in any year) offered incentives (as compared with all other quartiles of LQs). This is counter to the idea that incentives may be offered to incumbent industries to encourage retention. In fact, the higher percentages of low LQ industries offered property tax abatements (42%) and customized job training subsidies (73%) may suggest that MSAs are attempting to bolster employment in nascent industries. The high rate of persistence in offering incentives to the least-concentrated industries further supports this.
Percentage of Industries in MSAs’ Bases Offered Incentives by Highest and Lowest Employment Concentration (LQs; 2005-2015).

Note. N = 2,070 MSA industries. Tests compare industries in the highest LQ quartile with all other quartiles of industry LQs and industries in the lowest LQ quartile with all other quartiles of industry LQs. Summary statistics are calculated across the panel (2005-2015). LQ = location quotients; MSA = metropolitan statistical area; R&D = research and development; PDIT = Panel Database on Incentives and Taxes.
p < .05.
Source. PDIT and Wholedata data sets, 2005-2015.
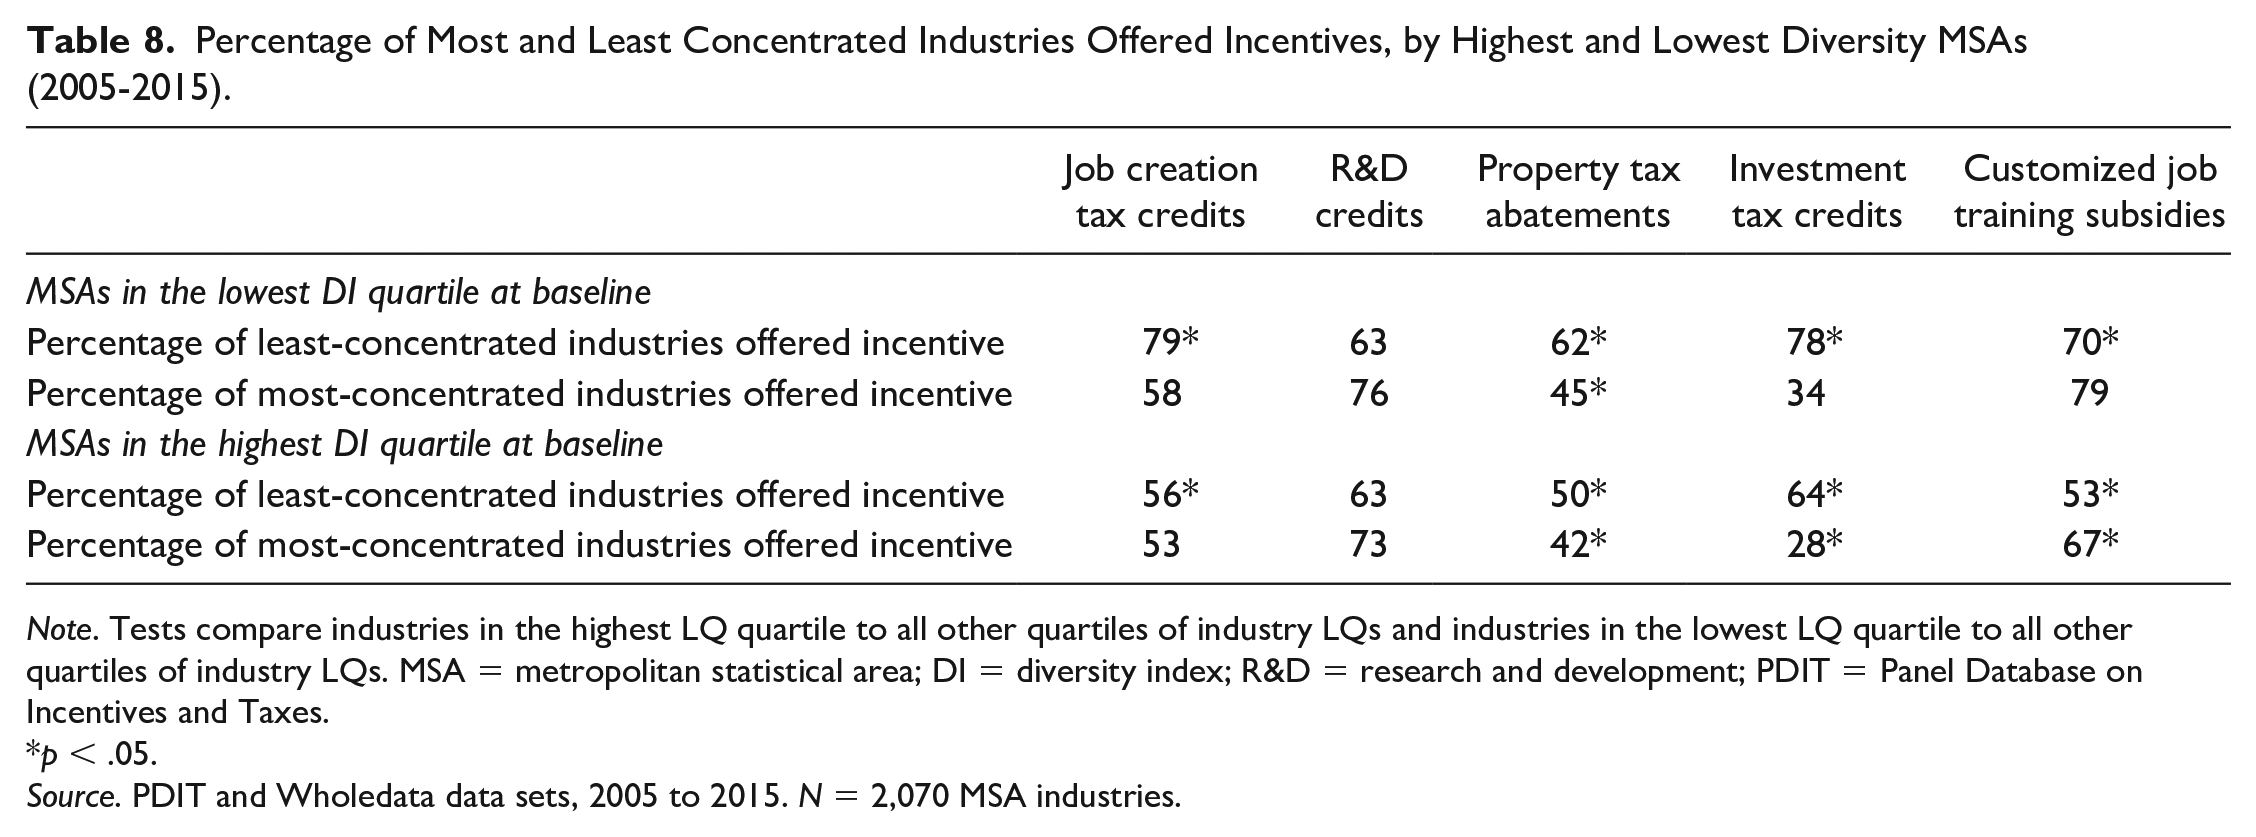
Does this pattern hold when an MSA’s baseline diversity is taken into consideration? In other words, do the highest and lowest diversity MSAs differ in how they target the most and least concentrated industries in their base? Comparing MSAs in the lowest and highest baseline DI quartiles on incentive coverage of highest and lowest industry LQs shows an interesting divergence. Table 8 shows that a statistically significant greater percentage of industries with the lowest levels of employment concentration were offered job creation tax credits, property tax abatements, investment tax credits, and customized job training subsidies by MSAs in the lowest DI quartile. This pattern is not as strong for the industries with the highest LQs in MSAs in the lowest DI quartile at baseline. This runs counter to the political economy argument that large, incumbent industries are more likely to be successful at lobbying for resources (at least within the lowest DI quartile). Patterns for MSAs in the highest DI quartile are similar to those of MSAs in the lowest DI quartile. A statistically significant larger percentage of industries with the lowest LQs were offered job creation tax credits, property tax abatements, investment tax credits, and customized job training subsidies. A statistically significant smaller percentage of industries with the highest LQs were offered customized job training subsidies, income tax credits, and property tax abatements in MSAs in the highest DI quartile.
Percentage of Most and Least Concentrated Industries Offered Incentives, by Highest and Lowest Diversity MSAs (2005-2015).
Note. Tests compare industries in the highest LQ quartile to all other quartiles of industry LQs and industries in the lowest LQ quartile to all other quartiles of industry LQs. MSA = metropolitan statistical area; DI = diversity index; R&D = research and development; PDIT = Panel Database on Incentives and Taxes.
p < .05.
Source. PDIT and Wholedata data sets, 2005 to 2015. N = 2,070 MSA industries.
The descriptive statistics presented above indicate that there is some variation in diversity over time as well as variation in incentive use patterns, particularly when examining different levels of baseline diversity and industry concentration. MSAs’ least-concentrated industries are slightly more likely to receive incentives, particularly within low diversity MSAs, potentially reflecting strategic targeting of emerging industries.
The Relationship Between Incentives and Changes in Diversity: Panel Regression Analysis
Next, we exploit the pooled cross-sectional nature of the data to estimate descriptive multivariate panel models that regress the diversity index (DI) on lagged measures of incentive use, and a lagged vector of control variables to isolate the effect of incentives on diversity, net of other local contextual factors. For this analysis, the data are collapsed to be twolevel, with time nested in MSAs; thus, the unit of analysis for the following panel regression analysis is the MSA. The extant literature more typically utilizes diversity or similarity indexes as explanatory rather than dependent variables, thus offering little guidance on how to specify a model predicting diversity. This is especially challenging because we are not seeking to predict either concentration or broad diversification specifically. Instead, we model changes in base composition in either direction. Because industrial base composition is a function of location decisions, we specify a model that accounts for neoclassical and institutional determinants of location decisions that fall into two categories: business environment factors and policy factors (Arauzo-Carod et al., 2010). Environmental factors are features of the business environment that may attract or repel new firms through communicating costs and returns to productivity, such as low-quality human capital, high wages, or insufficient level of market demand. Here, we employ MSA size, measured by population; MSA wealth, measured by median household income; and the percentage of the working-aged population in the labor force. Population has been operationalized in the location decision determinants literature as a measure of market demand, urbanization economies, and size of labor pool. It generally has a positive relationship to location decisions (Florida, 1994; Gabe, 2003; Holl, 2004; Neffke et al., 2011). We also include the percentage of working-age population in the labor force to measure the size of the labor pool and availability of human capital. Wages are typically employed as a measure of cost of labor in an area, which further links to productivity. Coughlin and Segev (2000) noted that, historically, the impact of wages on location decisions is mixed, as high wages may indicate either productive workers (an attractant) or cost inefficiencies (a deterrent; List, 2001). Lacking industry-averaged wage data, we use median household income as a proxy. All three variables were drawn from the American Community Survey’s single-year estimates (2005-2015). Median household income is deflated to 2015 dollars using a GDP-implicit price deflator (U.S. Bureau of Economic Analysis, 2015, see Table 1.1.9).
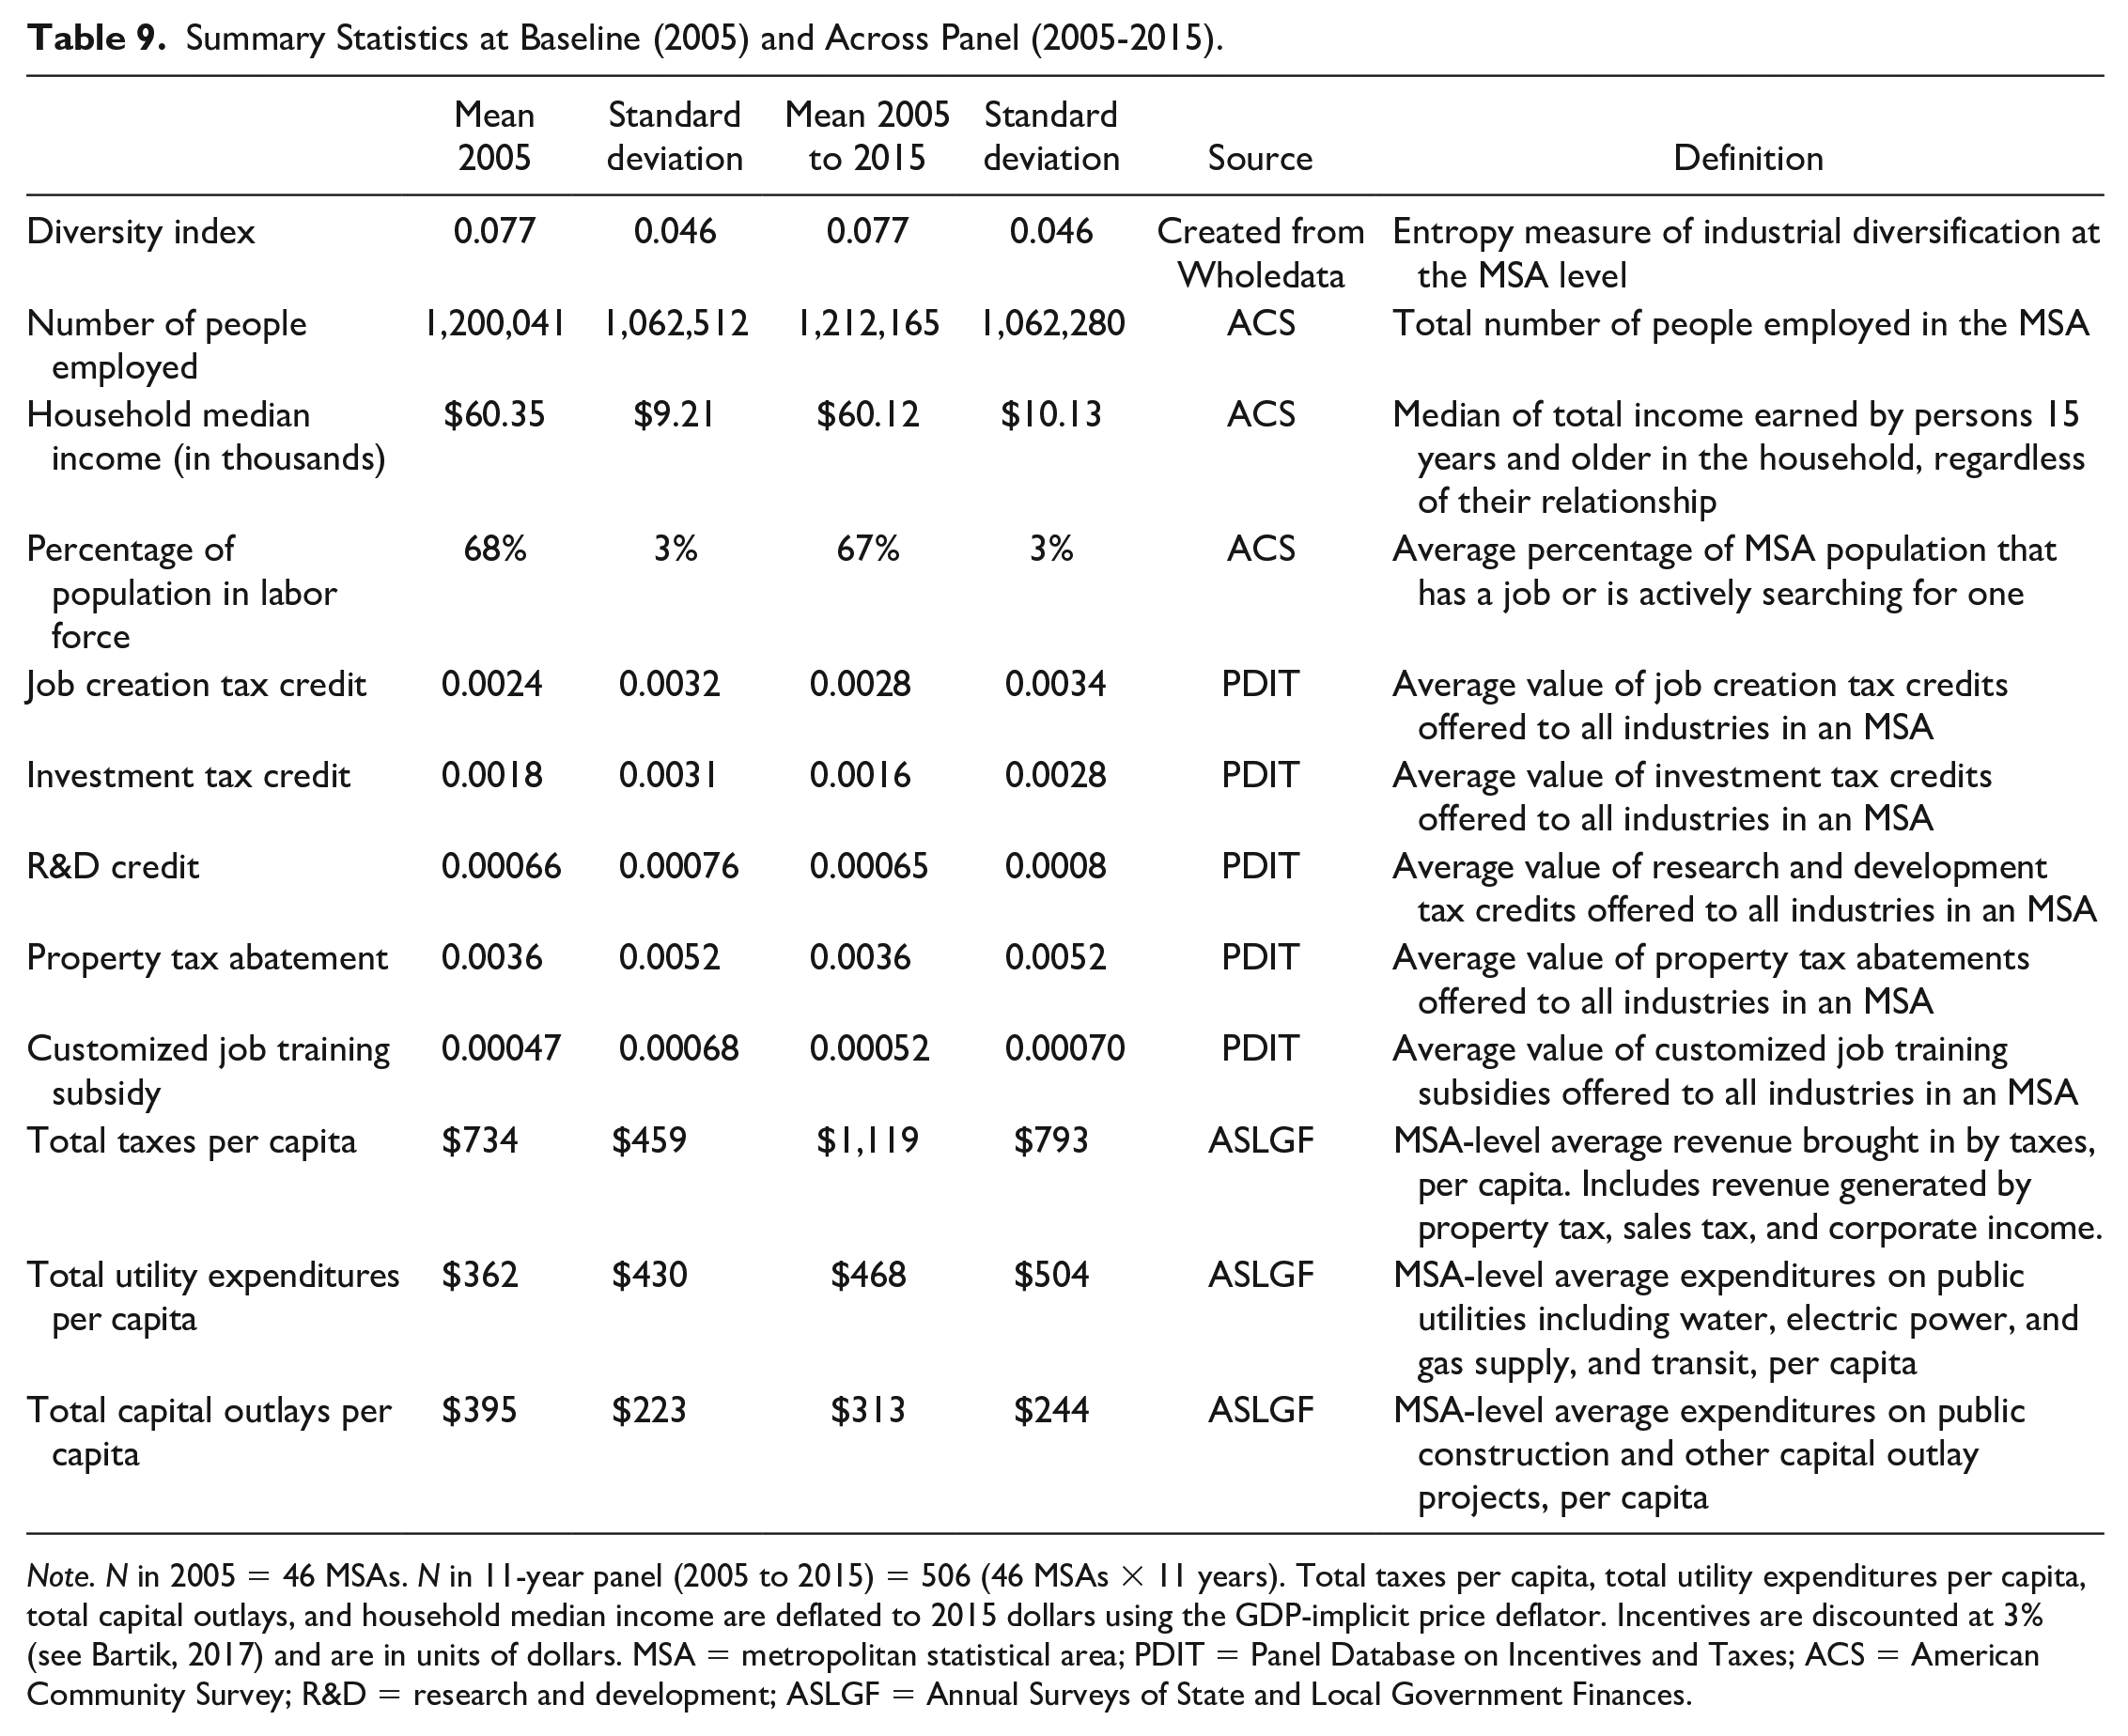
Policy factors are strategic efforts by public administrators to influence and attract firms to locate and remain in the area. Our main explanatory variable, incentive use (by incentive type), is only one such factor. Local governments communicate to potential new firms through their investments in components necessary for them to thrive, including transportation and technological infrastructure. These two areas, in particular, are noted in the literature on agglomeration as critical preconditions for cluster development (Duranton & Puga, 2004; Menon, 2009). We have included total capital outlays per capita and total utility expenditures per capita to measure such investment, as they provide comprehensive coverage of spending in these two areas. We also include a measure of tax revenue generated to capture local governments’ capacity to affect other important areas of investment, such as local workforce capacity and knowledge development, both of which are critical to generating spillovers and building clusters (Gabe & Bell, 2004). These three variables are sourced from the Annual Survey of State and Local Government Finance (U.S. Census Bureau, 2005-2015) and are deflated to 2015 dollars using the GDP implicit price deflator. Table 9 presents summary statistics for the DI, incentives, and control variables. Summary statistics are presented for the baseline period (2005) as well as for the full panel (2005-2015).
Summary Statistics at Baseline (2005) and Across Panel (2005-2015).
Note. N in 2005 = 46 MSAs. N in 11-year panel (2005 to 2015) = 506 (46 MSAs × 11 years). Total taxes per capita, total utility expenditures per capita, total capital outlays, and household median income are deflated to 2015 dollars using the GDP-implicit price deflator. Incentives are discounted at 3% (see Bartik, 2017) and are in units of dollars. MSA = metropolitan statistical area; PDIT = Panel Database on Incentives and Taxes; ACS = American Community Survey; R&D = research and development; ASLGF = Annual Surveys of State and Local Government Finances.
Equation 2 represents the main panel regression model to be estimated.
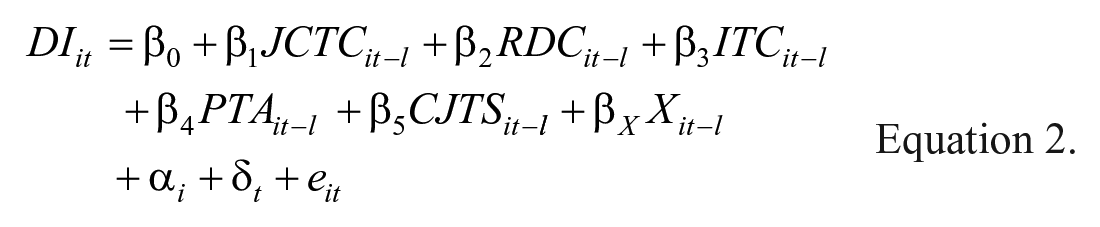
The incentives regressors include JCTC, a lagged dummy for job creation tax credits offered in MSA i in year t − l, where the lag, l, is 1 or 6 years; RDC, a lagged dummy for R&D credits offered; ITC, a lagged dummy for investment tax credits offered; PTA, a lagged dummy for property tax abatements; and CJTS, a lagged dummy for customized job training subsidies. Additional regressors include X, a vector of t − l lagged, and logged population and local government control variables described above. MSA and year fixed effects (α i and δ t , respectively) are included and standard errors are clustered at the MSA level. We present both 1- and 6-year lags to demonstrate the effects of short-run and medium-run firm location decisions. While we assume that decision makers draw on current information to make a location choice, the effects of these decisions may take longer to manifest. Testing a 1-year lag would surface any immediate changes related to incentives, while a 6-year lag would detect location changes that accumulate over the medium run. 8 We use incentive dummy variables as a conservative test of any relationship between incentives and diversity; this way, the availability of the incentive offer is examined rather than the magnitude of the offer. To further explore patterns identified in panel tabulations, the base model is also reestimated for two subgroups: MSAs with the lowest and highest DI scores at baseline. 9
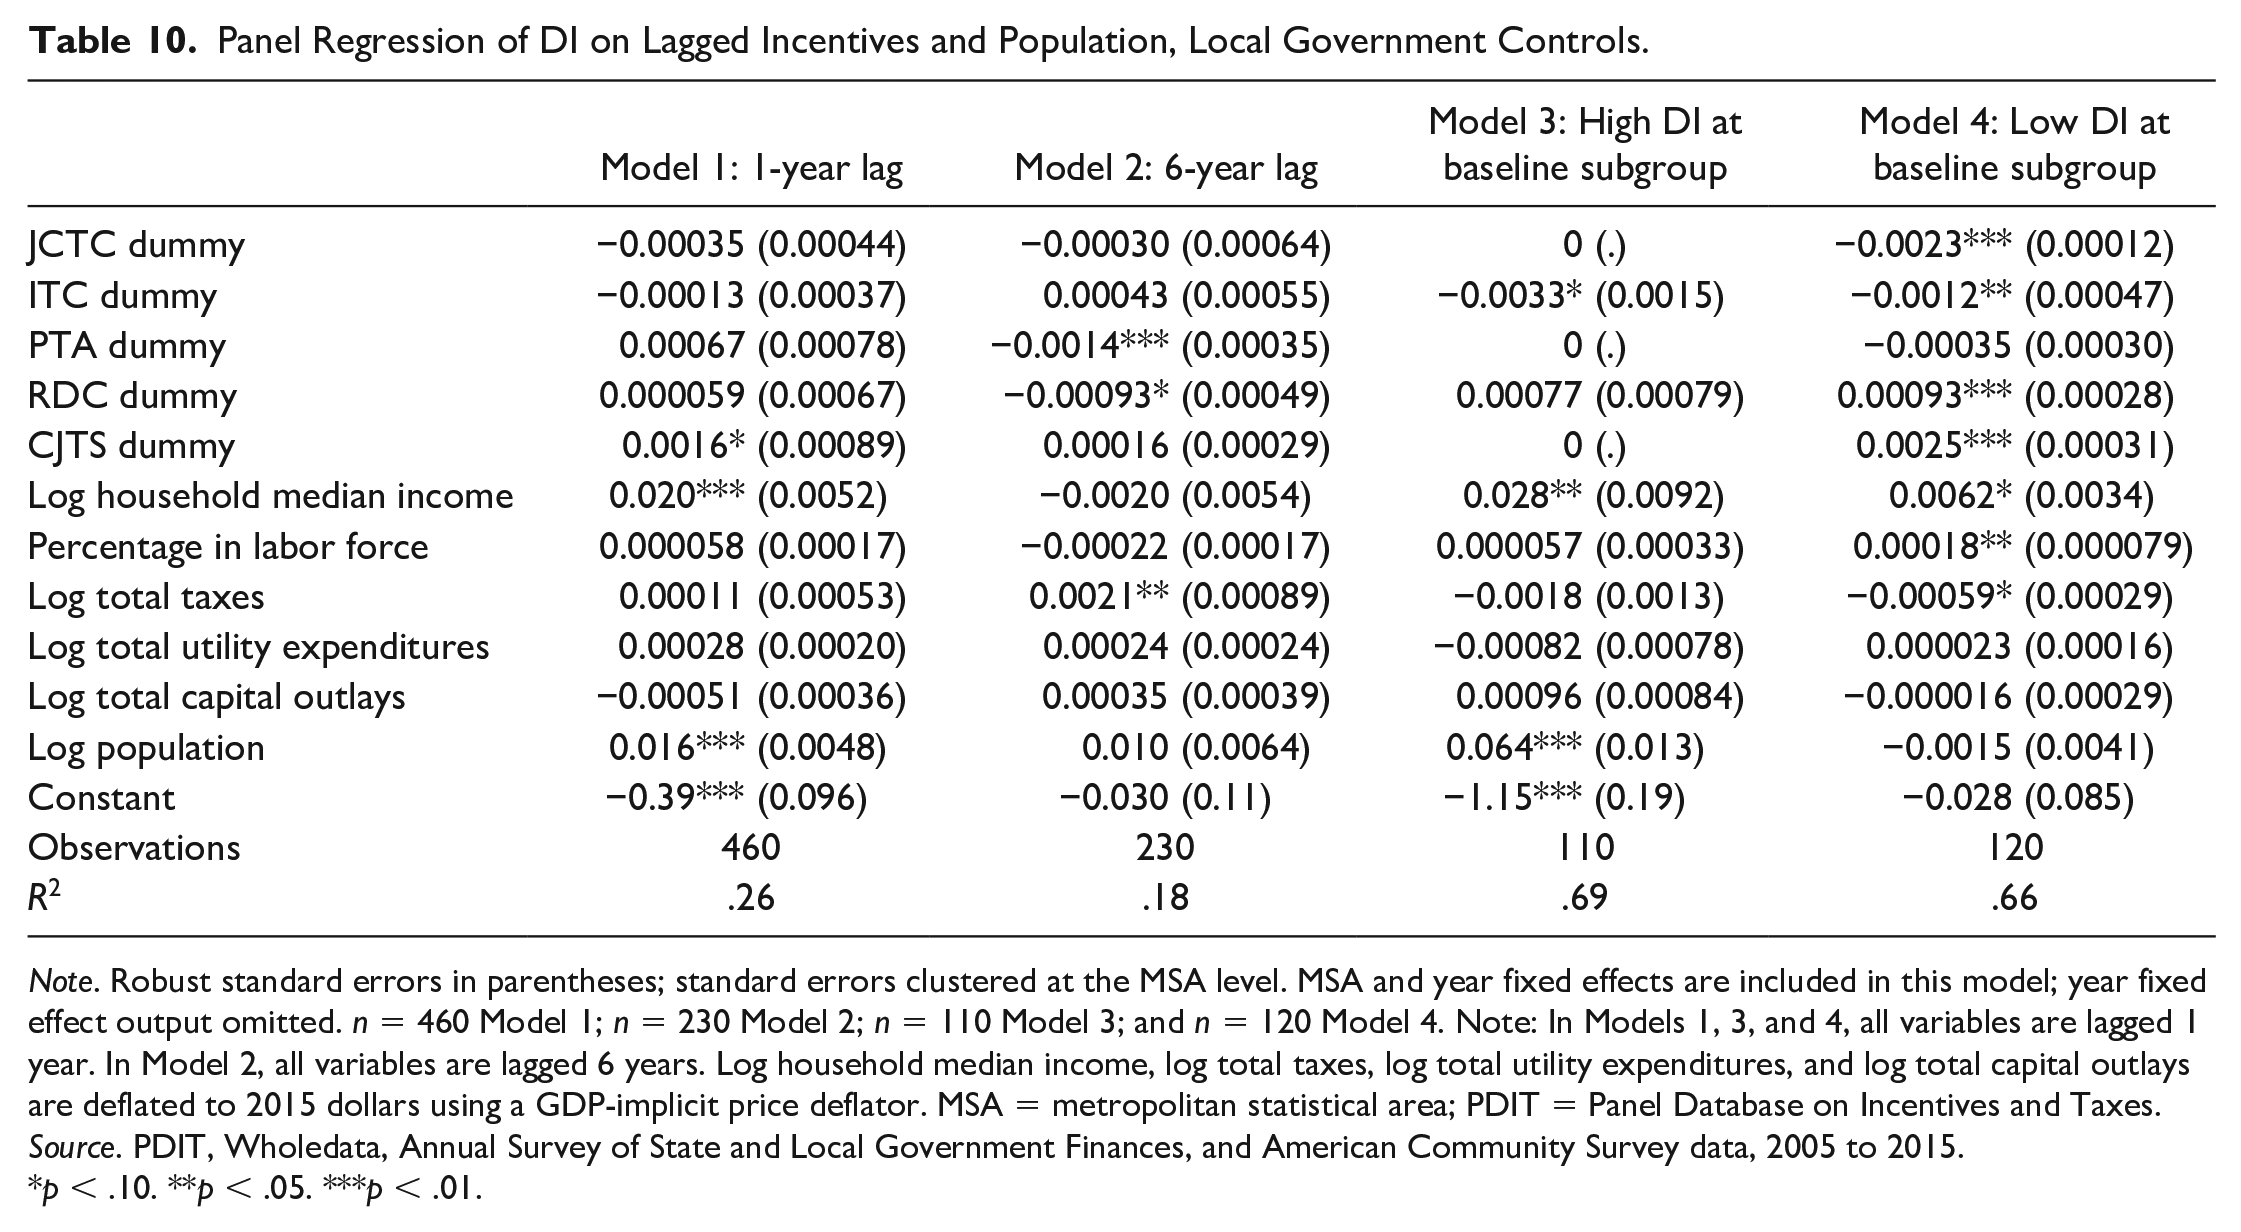
The base model, Model 1 (see Equation 2), regresses the diversity index on 1-year lagged dummy variables for each incentive type as well as a vector of 1-year lagged local government and population characteristics. Model 2 repeats the base model with 1-year lags. Models 3 and 4 apply the base model to high and low baseline diversity MSA subgroups. These models examine whether the relationship between incentive use and diversity differs for MSAs that begin the panel with the highest and lowest DI scores (as represented by a baseline DI score in the top and bottom quartiles). In particular, based on the patterning observed in the tabulations described in the prior section, we expect Model 3 for the low DI subgroup to show a stronger relationship between diversity and incentive use. MSA and year fixed effects, as well as robust standard errors clustered at the MSA level, were included in all specifications. Table 10 presents the results from the four models.
Panel Regression of DI on Lagged Incentives and Population, Local Government Controls.
Note. Robust standard errors in parentheses; standard errors clustered at the MSA level. MSA and year fixed effects are included in this model; year fixed effect output omitted. n = 460 Model 1; n = 230 Model 2; n = 110 Model 3; and n = 120 Model 4. Note: In Models 1, 3, and 4, all variables are lagged 1 year. In Model 2, all variables are lagged 6 years. Log household median income, log total taxes, log total utility expenditures, and log total capital outlays are deflated to 2015 dollars using a GDP-implicit price deflator. MSA = metropolitan statistical area; PDIT = Panel Database on Incentives and Taxes.
Source. PDIT, Wholedata, Annual Survey of State and Local Government Finances, and American Community Survey data, 2005 to 2015.
p < .10. **p < .05. ***p < .01.
The results of Model 1 show that, of the five incentive types offered, only customized job training subsidies are a statistically significant (p < .10) predictor of the DI. All else equal, offering customized job training subsidies increases an MSA’s DI score by 0.0016, on average. The effect size is small (recall that at baseline, the mean diversity index is 0.077). Yet, given the density of the lowest three DI quartiles, the magnitude of this change is substantial enough to shift an MSA within its DI quartile, and for MSAs near the top of their DI quartiles, it could be enough to move them into the next-highest (most diverse) quartile. For example, at baseline the top quartile DI score for the lowest DI quartile was 0.045 and increasing this by 0.0016 gives a DI score of 0.047. This is in the lower ranges of the next highest DI quartile that ranges from 0.045 to 0.066. So, while the average increase is small, it does impact MSAs’ relative positioning. Of the control variables in Model 1, only the log median household income (−0.020, p < .01) and log population (0.0162, p < .01) coefficients are significant. Ceteris paribus, increases in log median household income are associated with a small decrease in DI score, while log population is associated with a small increase in diversity. Both of these effect sizes are larger than the effect of customized job-training subsidies; this syncs with the literature on both determinants of location decisions and clustering.
Model 2 extends the lag to 6 years. Now, the coefficient on customized job training subsidies is smaller and is no longer significant, but coefficients on property tax abatements (−.0014, p < .01) and R&D credits (−.00093, p < .01) are. It is notable that the direction of the effect of these incentives is negative, moving the DI toward greater concentration. This contrasts the effect of customized job training subsidies in Model 1, which moves the DI toward greater diversity. In Model 2, log household medium income and log population coefficients are no longer significant but log total taxes (0.0021) is significant at the p < .05 level. In the medium run, it seems that a different set of influences on diversity may be at work, potentially elevating the importance of local government capacity to provide a high quality environment in which to work and live.
Model 3, limiting the analysis to the highest baseline DI MSAs, shows that investment tax credits (−0.0033) are statistically significant (p < .10) and are associated with the DI moving toward concentration. Log household median income (0.028, p < .05) and log population (0.0635, p < .01) are also significant but move the DI toward diversification; this is opposite of what is observed in Model 1. A limitation of Model 3 is that job creation tax credits, property tax abatements, and customized job training subsidies were dropped from the analysis due to lack of variation in the subsample. Model 4, which is limited to the lowest baseline DI MSAs, shows that four of the five incentive types have significant coefficients: job creation tax credits (−0.0023, p < .01), investment tax credits (−0.0012, p < .05), R&D credits (0.000927, p < .01), and customized job training subsidies (0.0025, p < .01). Job creation tax credits and investment tax credits are associated with DI movement toward concentration, while R&D credits and customized job training subsidies are associated with movement toward diversification among the low DI MSAs. Additionally, log median household income (0.0062, p < .10), percentage in the labor force (0.00018, p < .05), and log total taxes (−0.00059, p < .10) are significant. The direction of the relationship with log median household income syncs with Model 3. Comparing these two models shows that the relationship between incentives and diversity is more salient for MSAs with the lowest baseline diversity, as expected from the descriptive statistics presented earlier.
The results highlight the fact that incentives differ in their relation to changes in diversity depending on the type of incentive offered, the initial industrial base diversity of the MSA, and to a more varied extent, the MSA’s business environment; except in the medium run, local government factors (like tax revenue) appear not to exert a strong influence. In the short run, and without accounting for initial conditions, the relationship between incentives and changes in diversity is rather weak. Yet these relationships become much more salient when looking within subgroups based on initial diversity conditions. As seen in the initial descriptive summary, the lowest diversity MSAs see the most pronounced relationship between incentives and diversity over time. In the medium term of 6 years, the relationship between incentive offers becomes slightly stronger, though the specific incentives that are relevant changes. It is possible that different incentive types take longer to manifest any effect on base composition and relate differently to underlying mechanisms driving change in industrial base composition. The relationship between a productive tax base (reflected by the total taxes variable) and diversity seems to vary over the short and medium run as well. Some evidence of this has been indicated in case study research (see, e.g., Cowell, 2013). Given the inconsistency in significance of incentive types between Model 1 and Model 2, it is possible that incentives function symbolically rather than exert a unique influence.
There are important cautions to the analysis presented. First, the PDIT records simulated incentive offers to industries rather than actual uptake of incentives by industries. It does not limit the analysis presented above, but it does condition interpretation of the results. Second, the study period, 2005-2015, may not be representative of other periods to which we may want to generalize. In particular, this panel covers a major recession and recovery period during which local government revenue, in particular, and perhaps therefore incentive offers, were at historically low levels. Finally, this study cannot, and does not seek to, identify incentives as a causal mechanism driving changes in industrial base diversity. To facilitate causal inference, a more robust design would be needed to eliminate threats to internal validity. 10
Conclusions
For MSAs interested in encouraging change in the composition of their industrial base, identifying effective mechanisms for influencing change remains a major challenge (Conroy, 1975; Neffke et al., 2011). There are powerful economic, social, and political forces that likely hinder the efficacy of incentives as an approach to economic development. This is evidenced in the differential employment growth rates combined with net stability in MSAs’ DI scores and lack of relative movement within DI quartiles identified in the analysis presented above. Yet there is still evidence of a relationship between incentives and change in diversity net of local government and employment context. This evidence exists at both the overall and DI subgroup levels. Given that just one incentive type was found to be associated with changes in diversity in the short run, and that the relationship salience varied between highest and lowest baseline diversity MSAs, future work could identify key characteristics of these MSAs that may influence the relationship between diversity and incentives. Additional exploration into the way in which customized job training subsidies are deployed in these MSAs could also help clarify the relationship identified. A longer panel might also help explore how relationships change in the long run, particularly whether policy and environmental factors gain additional relevance and whether certain incentive types become more or less salient. Regardless of the mechanism by which incentive offers relate to changes in diversity, the substantial direct costs and opportunity costs of incentives require practitioners to carefully consider whether they should be a key economic development policy. Our analysis points to a modest relationship between incentives and relatively small increases in industrial base diversity that hold at an overall level and for MSAs with low initial levels of industrial diversity. Economic developers may thus want to consider the spread of employment across industries in their MSA when developing incentive strategies to achieve growth or stability goals.
Footnotes
Acknowledgements
The authors wish to thank Dr. Jim Landers, participants at the Upjohn Institute’s 2018 Researchers’ Workshop on Tax Incentives, the John Glenn College of Public Affairs’ first-year PhD seminar, and Dr. Stephanie Moulton for comments on early iterations of the analysis and manuscript. The authors also thank the three anonymous reviewers and the associate editor for their detailed feedback.
Declaration of Conflicting Interests
The author(s) declared no potential conflicts of interest with respect to the research, authorship, and/or publication of this article.
Funding
The author(s) received no financial support for the research, authorship, and/or publication of this article.
