
Abstract
This article proposes a new economic development framework – regional economic connectivity – to address the deep and growing urban-rural divide. Regional economic connectivity calls attention to the benefits to local communities of fostering connectivity to industry clusters and economic specializations that are already present in their broader regions. This analysis examines the relationship between growth and connectivity across all U.S. counties and their regions from 2010 to 2016 and finds that local cluster employment grows faster when those jobs are part of regional clusters. The magnitude of the relationship between growth and connectivity varies across the urban-rural hierarchy, with particularly strong results for micropolitan communities. A targeted analysis of Virginia is presented to illustrate these trends and implications for practice.
The urban-rural divide has become one of the preeminent economic issues of our time. Once characterized by steady convergence in which market forces rectified regional economic disparities, the U.S. economy has shifted its trajectory toward divergence over the past 40 years (Ganong & Shoag, 2017). The rapid rise of highly concentrated urban agglomeration economies, coupled with significant technological advances and the decline in manufacturing, have left many rural and less talent-rich places behind. Noted economic geographer Enrico Moretti (2012) described a “winner-take-all economy” where “winners tend to become stronger and stronger, as innovative firms and innovative workers keep clustering there, while losers tend to lose further ground” (p. 79). The result has been extreme growth in a handful of high-tech and coastal regions, while rural and heartland regions have experienced historic levels of brain drain, poverty, drug abuse, and unemployment (Parker et al., 2018).
Despite the magnitude of the challenges posed by the growing urban-rural divide, as well as the substantive research and evidence documenting its underlying causes, solutions for effective economic revitalization in lagging communities have been difficult to come by. Recommendations have ranged from people-based strategies that assist population migration away from declining places toward opportunity-rich places, to broader strategies that rebuild foundational assets such as health-care access, workforce skills, infrastructure, and housing stock. While investments in these assets are critical for renewed growth, they fall short of providing strategic direction for developing new economic drivers in lagging places. For example, workforce development programs can develop skills, but for which industries?
This article proposes a place-based, regional economic connectivity approach focused on developing the industrial base of lagging communities. Specifically, it calls attention to the potential benefits to local communities of fostering connections to industry clusters and economic specializations that are already present in their broader regions. Connectivity to industry clusters in the regional economy can offer direction and prospects for local growth by broadening the asset base available to communities from which to build anew. This analysis examines the relationship between growth and connectivity to regional specialization across all U.S. counties and their regions from 2010 to 2016 and finds that local cluster employment grows faster when those jobs are part of broader regional industry clusters. The magnitude of the relationship between growth and connectivity varies across the urban-rural hierarchy, with stronger results for rural communities, particularly micropolitan communities. A targeted analysis of Virginia is also presented to illustrate these trends and the implications for the practice of economic development.
Regional Connectivity as an Economic Development Framework
This analysis explores the viability of a new frame on cluster-based strategies to help bridge the urban-rural divide: regional connectivity. A regional connectivity framework suggests that local employment growth can be spurred by tapping and nurturing economic specializations that are present outside of the locality and within the broader region, even spanning urban and rural areas. This approach contrasts traditional notions of cluster development that tend to focus on agglomeration within concentrated urban areas.
Two proven features of regional economies support how economic specialization at the regional level can drive local cluster growth and bridge urban-rural divides. First, most regions comprise a diverse array of local communities along the urban and rural spectrum. Second, the drivers of regional economies are industry clusters, or networks of businesses, and labor pools, whose linkages often cross local jurisdictional boundaries. In terms of the first feature, studies of regional economic diffusion and concentration often suggest an antagonistic relationship between urban and rural communities within the same regions, specifically that urban economic growth weakens surrounding rural communities, leading to further divergence and backwash effects (Lewin et al., 2013; Myrdal, 1957).
However, economic geography studies offering a more contextual perspective, particularly when accounting for proximity to urban agglomeration, confirm economic opportunities for rural areas (Barkley et al., 1996; Partridge et al., 2008). For example, Partridge et al. examined how proximity of rural communities to urban cores affected population and employment growth in rural areas over the period 1950 to 2000. They found that rural counties near urban areas have stronger job and population growth, and noted the challenges of forging economic relationships for more remote rural communities. The authors attribute the benefits of proximity to the ascendance of regional agglomeration economies and to the ability of proximate rural counties to provide services and quality of life to regional industries and workers.
The second foundational feature of regions builds on the first, that the drivers of regional economies are industry clusters, or firms in related industries that are geographically cohesive and able to leverage the benefits of their proximity, such as knowledge spillovers, thick labor markets, and specialized suppliers. For industry clusters to provide a development pathway for disparate parts of regions, however, the spatial scale of their linkages must be regional. The industry cluster literature discusses the spatial implications of these linkages, noting that innovation and knowledge-based activities are associated with greater urban density, while other activities such as supply chain relationships and commuting exhibit a broader regional, including rural, footprint (Audretsch & Feldman, 2004; Dabson, 2011; Feser & Isserman, 2009; Jaffe et al., 1993; Rosenthal & Strange, 2001). Overall, the literature suggests that linkages and spatial scales vary by cluster, indicating that some clusters are better suited as targets for a regional connectivity strategy than others.
Additionally, Porter (2003) and Delgado et al. (2010, 2014) examined regional economic performance, the composition of regional economies, and the role of industry clusters in the economy measuring clusters at the spatial scale of broad regions inclusive of highly urban and highly rural places (Economic Areas). They found that key indicators of regional economic performance at this scale, including wages, wage growth, employment growth, and innovation, are strongly and positively influenced by the strength of each region's clusters. Overall, studies of industry clusters suggest the power of intraregional cluster connectivity that spans urban and rural areas, but they lack clarity on how different clusters are situated within their regions or the prospects for connectivity to positively impact different parts of regions.
Delgado and Zeuli (2016), however, offer one of the few studies that specifically explored the impact of industry cluster linkages within regions on local economic outcomes. The authors examined whether inner-city industry connections to metropolitan regional clusters impacted inner-city cluster employment growth. The authors found that the strength of the cluster in the metropolitan region is positively associated with employment growth in the inner-city cluster. This relationship between local employment and regional clusters indicates that the mechanisms of agglomeration –such as skilled labor, sophisticated and demanding local customers, niche markets, suppliers, and related industries– are at work regionally and have an influence on local development. Delgado and Zeuli (2016) offered a regional connectivity framework, which our analysis extends to examine the urban-rural divide.
Regional Specialization and Local Growth
Studies of urban-rural economic relationships and of regional industry clusters suggest that greater regional industry cluster specialization is indicative of the vast web of economic activity and assets required to sustain and grow the cluster. These activities and assets are often leveraged throughout regions, contributing to growth in the communities where they are located. For example, the emerging biotech cluster in Sacramento is anchored by a new innovation district at the University of California-Davis in the urban part of the region, with wet lab space, commercialization support, and ag-tech firms sprouting in rural parts of the region. These local assets are connected regionally by a strong university infrastructure and leadership, broadband upgrades, and workforce development initiatives (Dabson & McFarland, 2021). To put a finer point on the relationship between regional cluster specialization and local cluster growth, case examples demonstrate the influence of connectivity on growth through mechanisms such as market access, knowledge spillovers, and supply chains. For example, in a study of urban-rural cluster connections in Oregon, Martin (2011) found that rural hops growers leverage nearby urban markets to test and refine their products before taking them to the global market. The region is highly specialized in the industry with a strong presence of craft beer consumers available to offer market signals and implicit feedback about the hops. This led to improvements and a product that is more successful in the regional market, as well as national and global markets. A similar study of European rural entrepreneurship by Mayer et al. (2016) found that rural entrepreneurs benefit from proximity to urban cores because they could access urban knowledge and markets related to their industry while profiting from the typically lower production costs in their peripheral location. In these instances, connectivity to strong regional clusters with market accessibility between rural hops growers and urban consumers, or rural entrepreneurs and urban knowledge spillovers, resulted in expansion and local growth.
Likewise, Mayer and Provo (2007) uncovered the economic potential of domestic outsourcing, or “farmshoring.” Farmshoring is the horizontal expansion of economic activity that occurs when urban cluster firms’ needs for secure data facilities, lower land costs, and skilled and stable labor are met by availability in rural areas. For example, when Northup Grumman, headquartered in Northern Virginia, won a $2 billion state technology contract, it opted to expand operations in rural Lebanon, Virginia for the reasons cited above (p. 8). To further demonstrate the impact of connectivity on growth, Searls (2011) found that a $1 billion decrease in manufacturing output in rural Minnesota resulted in 1,043 jobs lost and a loss of $208 million revenue among Twin Cities’ area businesses. Connectivity within the manufacturing cluster in this case was built largely on trading networks and supply chains that spanned urban and rural markets. These case studies highlight the mechanisms of connectivity and interdependence and how regional cluster specialization influenced local cluster growth.
Defining Economic Connectivity and Other Key Concepts
This analysis assesses whether economic connectivity, defined as cluster strength at different levels of geography, contributes to growth as a result of industry linkages through inputs, outputs, and skills that support competitiveness (Delgado & Zeuli, 2016). Specifically, we explore the extent to which regional economic connectivity influences county-cluster employment growth, and how the relationship between economic connectivity and growth varies across the urban-rural spectrum. Using an ordinary least squares fixed-effects regression model, this analysis determines whether connectivity, indicated by the level of regional industry cluster specialization, is associated with employment growth in the same cluster in U.S. counties between 2010 and 2016.
To test our hypothesis that greater regional economic connectivity is associated with stronger growth of county-cluster employment, this analysis determines the following for each U.S. county:
all traded sector industry clusters that are present outside of the county but within the county's broader economic region (2010); the level of economic specialization of these regional industry clusters (2010 location quotient, the primary independent variable, and measure of connectivity); the extent to which the county itself participates in these regional clusters (2010 county-cluster location quotient); and the county employment growth rate for each cluster (2010–2016).
The study evaluates connectivity using standard county definitions; regions that are inclusive of both urban and rural communities as defined by the U.S. Department of Commerce, Bureau of Economic Analysis (Economic Areas); traded-sector industry-cluster definitions developed by the U.S. Cluster Mapping Project; and county rurality categories developed by the U.S. Department of Agriculture (USDA).
Economic Areas
The definition of “region” utilized in this analysis is Economic Area (EA). The U.S. Bureau of Economic Analysis (BEA) identifies 178 economically cohesive geographic units that comprise all counties in the United States. EAs define relevant regional markets surrounding metropolitan and micropolitan areas, including rural areas. 1 The core building blocks of EAs are counties. EAs are widely used in studies of industry clusters, throughout the federal government and in the private sector. According to the BEA, examples of federal government use include defining national transportation analysis regions, assessing competition levels in markets for oil pipeline services, and defining mobile communication licensing territories. Regional councils of government and economic development agencies use EAs for research and market analyses, while the private sector uses the areas to determine markets for products.
Rurality
This analysis utilizes a modified rurality scheme defined by the USDA Economic Research Service's Rural-Urban Continuum Codes (RUCCs). To leverage the nuances of RUCCs and to have a reasonable number of categories to conduct comparative analysis, the nine RUCCs categories are collapsed into four community types. Metropolitan and micropolitan counties are as defined by the Office of Management and Budget and aligned with the RUCCs framework. For rural communities, rural adjacent are those that are, according to RUCCs, outside of metropolitan areas but adjacent to them. Rural remote counties are outside of metropolitan areas and are not adjacent to them. These four categories of community types within regions – metropolitan, micropolitan, rural adjacent, and rural remote – create consistency with the technical definition and intraregional dynamics of EAs. In the analysis, data are presented accordingly.
Industry Clusters
This analysis uses industry clusters as developed by Delgado et al. (2016). To create cluster definitions, they grouped together narrowly defined U.S. industry codes that showed significant interindustry linkages based on input-output measures, labor occupations, and the co-location patterns of employment and establishments (Ketels, 2017). The main underlying data source for cluster definitions is the U.S. Census Bureau's County Business Patterns data set on employment, establishments, and wages by six-digit North American Industry Classification System (NAICS) codes. These data are available through the Harvard Business School's Institute for Strategy and Competitiveness’ U.S. Cluster Mapping Project, a national economic initiative that provides over 50 million open data records on industry clusters and regional business environments in the United States. The U.S. Cluster Mapping Project groups jobs by NAICS code into “traded” and “local” clusters. Both traded and local clusters consist of jobs in industries with high levels of interindustry linkages and interactions. This analysis specifically utilizes the 51 traded-sector clusters developed by the project. Traded clusters serve markets beyond their regions; local clusters, like local retail, serve their immediate region. While local clusters account for most of the employment and employment growth in regional economies, traded clusters are highly concentrated in a few regions with specific competitive advantages and drive higher levels of overall regional economic performance (Ketels, 2017).
Growth
The dependent variable in this analysis is employment growth of the traded-sector county clusters from 2010 to 2016. Employment data are from the U.S. Census Bureau's County Business Patterns. The specific timeframe of 2010 to 2016 allows for an examination of the economic recovery period following the 2008 Great Recession and reflects the most recent data available on industry cluster employment. 2 Due to the cyclical force of the Great Recession, different parts of the country experienced the recession and recovery at different times and thus the timing and extent of recovery has been uneven. More robust measures of economic recovery would provide a fuller picture of recovery from the recession; however, employment is a reliable measure of economic growth in general, and county fixed effects (see below) control for differences in the impacts of the recession on local communities.
Connectivity
The level of connectivity between local cluster jobs and regional clusters is the primary independent variable in this analysis. First, the observations or units of analysis are defined. The observations are “county clusters,” or traded-sector industry clusters with at least 10 jobs in the county and comprising at least 1% of county traded-sector employment. Of the possible 160,191 county-cluster pairs across the United States (3,141 counties × 51 traded clusters), 27%, or 43,166 county-cluster observations, meet the 10-job and 1% of traded-sector employment threshold and are retained in the sample. These county level observations represent those clusters that are viable candidates for connectivity to their regional industry clusters. The extent of county-cluster connectivity is then determined by the “rest of region location quotient,” or the level of cluster specialization in the region outside of the county. 3 Regional industry cluster specialization signals the density of assets and economic activity within the region that are related to the cluster. Regions with greater specialization offer more potential opportunity for a constituent locality to participate in the cluster and experience cluster growth than those with less regional specialization.
For example, Danville, Virginia is part of the Greensboro-Winston-Salem-High Point, North Carolina region. There are 410 Furniture cluster jobs in Danville. The region is highly specialized in the Furniture cluster with a location quotient of 6.34, indicating a high level of connectivity between Danville furniture jobs and the Furniture cluster in the region. This study hypothesizes that the regional strength of the Furniture cluster contributes to the success of the cluster locally for Danville. Figure 1 demonstrates specialization of the Furniture cluster in regions throughout the country (connectivity). Indeed, from 2010 to 2016 the Furniture cluster doubled in size in Danville (growing from 410 jobs to 820 jobs). This rate far exceeds the overall growth rate of the Furniture cluster, which is 2.5% from 2010 to 2016. 4 A counterexample is Marion County in nearby West Virginia where the Furniture cluster declined during the same period (down 14.3% from 70 jobs to 60 jobs). Despite the strength of the cluster in the county (2010 location quotient of 1.4), the rest of the region lacked cluster specialization (rest of region location quotient of 0.09).

Regional specialization in the furniture cluster.
Fixed Effects
Of course, many factors in addition to connectivity influence county-cluster growth. This analysis includes county- and industry-cluster fixed effects to account for these factors. Fixed effects are variables that are constant across groups of individual observations. County fixed effects control for features of the county that are common across different clusters within that county and influence cluster growth based specifically on their location within the county. Factors such as the amount and types of human capital (Sublett & Tovar, 2021), innovation activity (Goetz & Han, 2020), and market access (Rasker et al., 2009) have been found to be fundamental drivers of growth. The inclusion of county fixed effects accounts for these important, but otherwise omitted variables and sources of variation in growth that are rooted in location factors.
Additionally, the model includes industry-cluster fixed effects. Industry-cluster fixed effects control for similarities among the same clusters, such as broader national growth trends, that influence growth regardless of county location. For example, the Coal Mining industry cluster is in decline due to a powerful confluence of historical and global trends that impact the growth of a Coal Mining county cluster regardless of its location. This variable underscores the importance to economic development practitioners of considering growth potential in addition to cluster specialization regionally.
Evaluating Connectivity
The model analyzes county-cluster employment growth between 2010 and 2016 as a function of connectivity to regional industry clusters (rest of region location quotient). It controls for the initial absolute size and level of specialization of the cluster within its county, as well as the overall county and national cluster characteristics with the inclusion of county and cluster fixed effects. An ordinary least squares regression is calculated to predict the 2010 to 2016 employment growth rate (

To control for national-level trends in the industry cluster and to control for county-level growth factors, fixed effects (
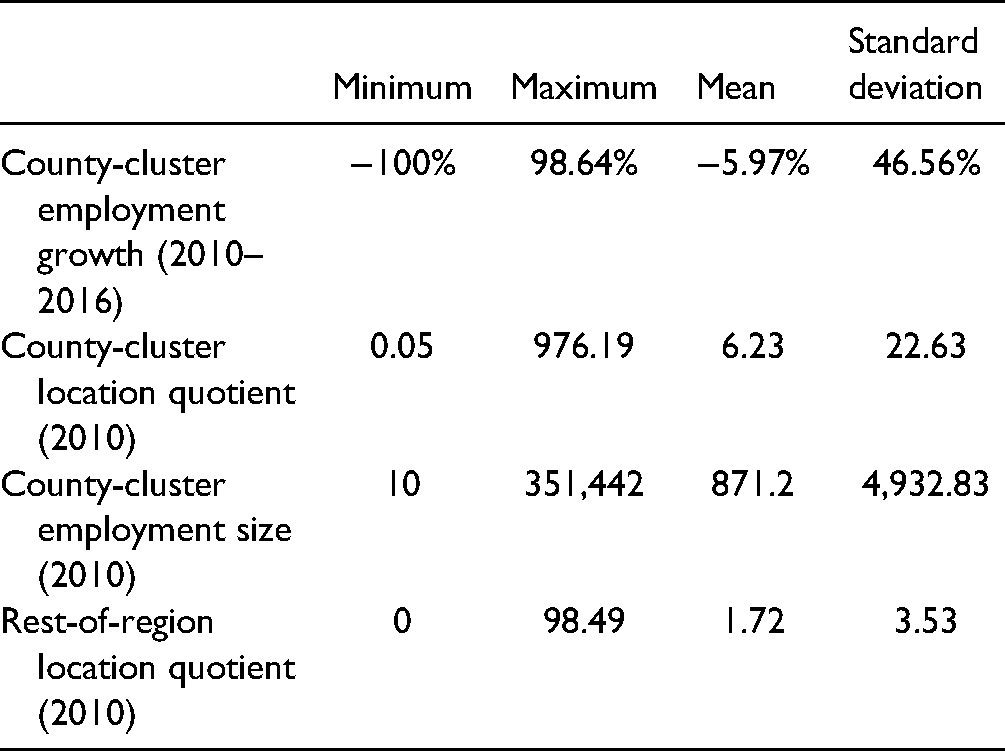
Table 1 summarizes the dependent and independent variables for all observations in our analysis, which are those county cluster pairs in the United States with at least 10 jobs and that account for at least 1% of total county traded-sector employment. Of note, on average, county clusters experienced employment decline from 2010 to 2016, while in absolute terms, total county-cluster jobs increased 1.7%. Despite the care we took to manage outliers, we found that these divergent growth trends were due to the high number of smaller county clusters that experienced declines. 6 The employment growth rate for county clusters in the United States is predicted using the regression model. To assess the varying impacts of connectivity based on the rurality of the county, the regression analysis is then applied to four subsets of county-cluster observations: metropolitan, micropolitan, rural adjacent, and remote rural counties (Table 2). All models were tested for heteroscedasticity using a Breusch-Pagan test. In all models, the test revealed a significance level of less than 0.05, indicating that there is no heteroscedasticity present. Key findings from the analysis are presented in the next section.
Descriptive statistics summary table (n = 43,189).
County-cluster employment growth (2010–2016) by county type.

The Importance of Connectivity
The analysis indicates a statistically significant, positive relationship between county-cluster employment growth and connectivity. When county jobs are in clusters that are specialized in the broader region, those local jobs are associated with faster growth than county jobs with no or less regional specialization. Cluster connectivity, together with the initial size and strength of the cluster in the county, explains 12.04% of the variation in county-cluster growth across the United States (R2 = 0.12035., F(43,014) = 4.733, p < .001; see Table 3). Since the independent variable is log transformed, it is interpreted as accounting for a unit increase in the dependent variable equal to the coefficient divided by 100, for every 1% increase in the independent variable. Holding constant the initial size and strength of the county cluster, as well as overall county growth factors and national cluster growth (via fixed effects), we find that for every 1% increase in a region's cluster specialization, or connectivity, the employment of that cluster in the county is expected to grow 0.07 percentage points. 7 In other words, the average county cluster with 10% greater regional cluster specialization (i.e., location quotient of 1.65 vs. 1.5) is expected to grow 0.7 percentage points more (i.e., 3.7% vs. 3% growth).
Connectivity effect on county-cluster employment growth (2010–2016).

Significance codes: ***.01, **.05, *.1.
The relationship between connectivity and growth is bolstered by employment growth patterns in communities across the urban-rural hierarchy – from very urban to the most rural – within economic regions (see Table 4). When the data are disaggregated by county type (metropolitan, micropolitan, rural adjacent, and remote rural), the results suggest that all types of communities benefit from connectivity, but that the magnitude of the relationship between connectivity and growth varies based on rurality. In our analysis of growth and connectivity in U.S. county clusters, the greatest relationships are evident in rural community types, particularly micropolitan.
Connectivity effect on county-cluster employment growth (2010–2016) by county type.
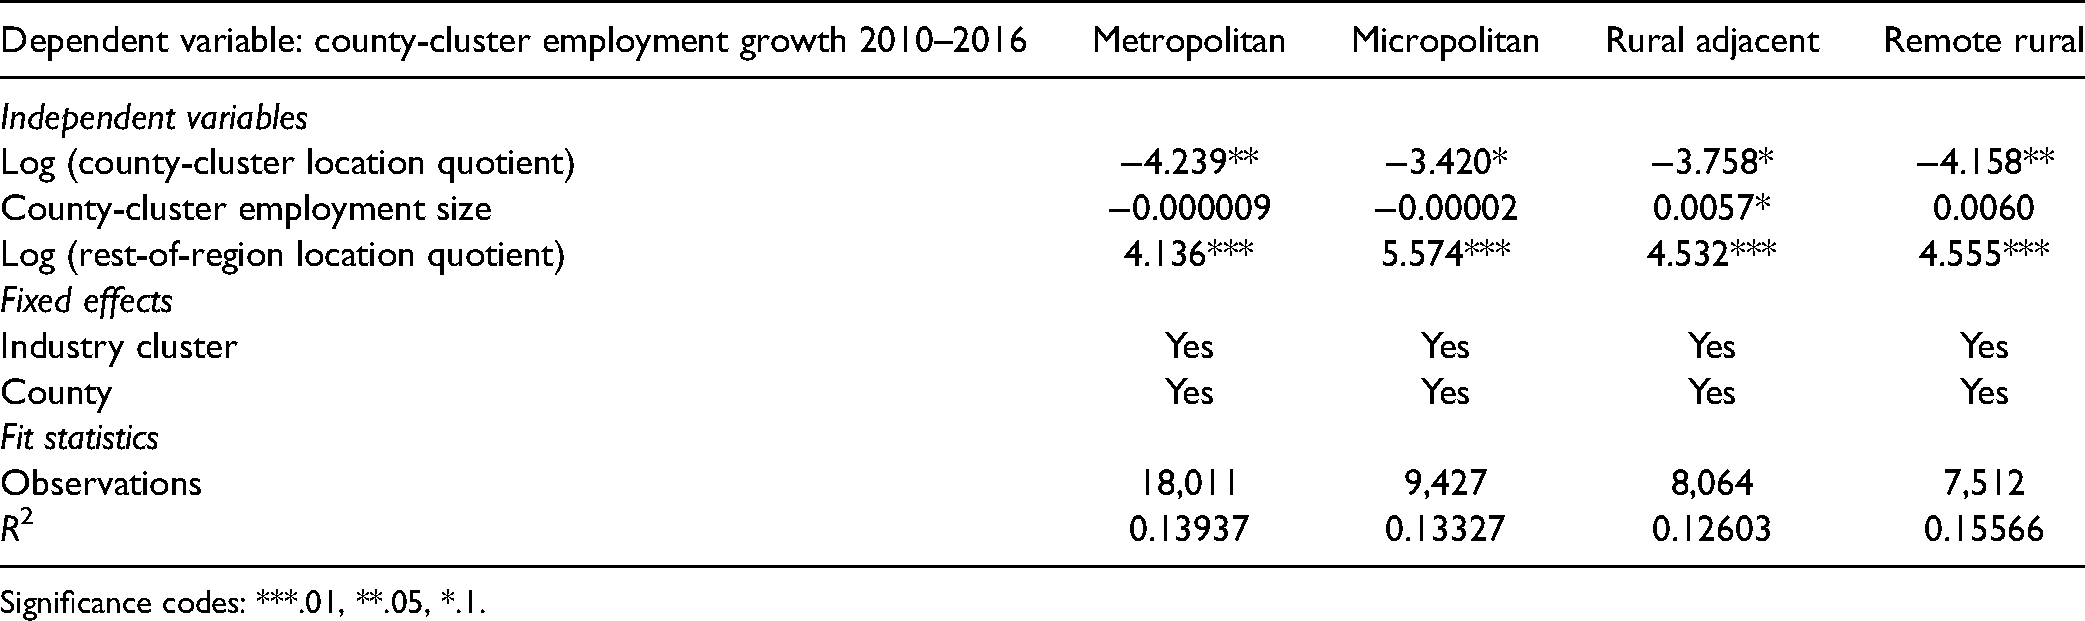
Significance codes: ***.01, **.05, *.1.
We find that a higher level of connectivity is associated with greater county employment growth for that cluster. For every 1% increase in a metropolitan county cluster's connectivity, our model predicts a 0.041 percentage point increase in the employment growth rate. For a 1% increase in a micropolitan county's cluster connectivity, the model predicts a 0.056 percentage point increase in the employment growth rate. For every 1% increase in a rural adjacent county's cluster connectivity, the model predicts a 0.045 percentage point increase in the employment growth rate. For every 1% increase in a remote rural county's cluster connectivity, the model predicts a 0.0463 percentage point increase in the employment growth rate. To predict how a 1% increase in the rest-of-region cluster strength will affect employment growth in the county cluster, we divide the coefficient for the independent variable by 100 since it is in the natural log form. For example, in the metropolitan county-cluster model, the coefficient 4.137 is divided by 100 to show that a 1% increase in the strength of the rest-of-region location quotient is associated with a 0.041 percentage point increase in the 2010 to 2016 employment growth rate for the metropolitan county cluster. In other words, a 10% increase in the regional cluster's specialization is expected to increase metropolitan cluster growth by about 0.4 percentage points.
Our finding regarding the high growth potential of connectivity for rural communities adds nuance to previous studies of regional development, which concluded that backwash effects, like brain drain, characterize the impact of regional economic activity on rural areas (Barkley et al., 1996; Partridge et al., 2008). Although it may be true that rural communities are more challenged to connect regionally, that some regions do not have core strengths from which to build, and that proximity to urban agglomeration is a significant factor, our analysis indicates that when they are connected and industry clusters are aligned, the benefits are material. Partridge et al. found that for rural communities, the most critical factor contributing to regional connectivity is infrastructure, namely high-speed Internet that allows for remote work and business innovation. COVID-19 and the shift to remote work underscore the importance of Internet connectivity and device access, in particular, for regional integration. Although trends toward urbanization continue to pull resources, people, and investment away from rural areas, connectivity to regional industry clusters may help dampen these trends. Our findings are pronounced for rural micropolitan communities and consistent with other studies that noted the importance of regional economic linkages to the growth of micropolitan areas (Cortes et al., 2015; Liu et al., 2021). Delgado (2018) noted that the benefits of agglomeration could be realized –and should be fostered– in micropolitan communities that have employment density and proximity to metropolitan areas because these factors allow them to connect to nearby regional clusters. Additionally, the benefits of connectivity are not isolated to rural communities. Our findings demonstrate that metropolitan areas also reap benefits from regional connectivity – a finding that can incentivize urban leaders to work regionally with their rural counterparts.
Connectivity in Context: The Case of Virginia
Many of the forces driving urban-rural divides across the country are familiar to Virginia. Broader trends in urbanization and the declining coal industry have weakened the economies of many rural parts of the state. This divide has only intensified since the Great Recession. According to the Commonwealth Institute, “In 2016, there were 3.2% more occupied jobs in metro areas than in 2007. But in non-metro areas, there were 6.3% fewer filled jobs than before the recession” (Warren & Goren 2018, para. 2). In addition to employment differentials, rural areas also see lower wages, educational attainment, broadband access, and health-care access and quality than their urban counterparts.
To better understand how a regional economic connectivity framework could operate in practice, we conducted an analysis of localities and regions in Virginia, followed by an application of the framework to broader economic development goals in the state. The Commonwealth of Virginia is home to 1,760 county clusters. The analysis indicates that connectivity is associated with county-cluster employment growth in Virginia. 8 Cluster connectivity together with the initial size and strength of the county cluster explains 18.3% of the variation in job growth for Virginia county clusters (R2 = .18301, F(1,755) = 3.563, p < .05; see Table 5). Holding constant the initial size and strength of the county cluster, as well as county- and national-cluster growth factors (via fixed effects), we find that for every 1% growth in a Virginia county's cluster connectivity, the county-cluster employment growth rate increases by about 0.04 percentage points. 9
Connectivity effect on county-cluster employment growth (2010–2016) in Virginia.

Significance codes: ***.01, **.05, *.1.
Implications for Practice and Policy
These findings for the United States and Virginia indicate that a regional connectivity framework should be considered by economic developers as one tool in the economic development toolbox and a potential pathway for growth and development. To apply the research to practice, policy leaders and practitioners can “map the cluster composition of [their location] and nearby region, identifying strong and emerging clusters in the region that have some strength in the [locality]” (Delgado & Zeuli, 2016, p. 132). In other words, what clusters are strong in the broader region that also have a presence of jobs in the county? Or what assets and industries are present in the locality that can support regional clusters? Through an economic connectivity lens, economic development organizations and other stakeholders can identify those clusters that are strong in the region outside of the county and most likely to have a positive influence on local economic outcomes. Once those clusters are identified, policy leaders and practitioners can work to build economic connections within the region through an adapted cluster upgrading strategy. Importantly, the general association between connectivity and growth can serve as a guide or starting point, but local and regional practitioners should more closely examine whether the locality has the growth potential, necessary growth factors, and specialized assets to support the clusters.
In Virginia, for example, the Virginia Economic Development Partnership has established key industries for growth and development within the state, including Corporate Services, Food and Beverage Processing, Information Technology, Life Sciences, Manufacturing, Supply Chain Management, and Unmanned Systems. These are roughly inclusive of the following traded-sector clusters: Distribution and Electronic Commerce, Water Transportation, Wood Products, Forestry, Financial Services, Business Services, Automotive, Agricultural Inputs and Services, Transportation and Logistics, Food Processing and Manufacturing, Aerospace Vehicles and Defense, Biopharmaceuticals, Medical Devices, and Information Technology and Analytical Instruments. To apply a regional connectivity framework to these target clusters, economic developers in Virginia, whether local, regional, or state, can take the following steps.
Identify those regions with an existing specialization in the cluster (see online Appendix).
10
Assess which counties are best positioned to benefit from connectivity within the cluster. Begin to scope out the types of additional investments needed to bolster the cluster and strengthen linkages between the cluster in the local and broader regions.
Applying this approach to grow the Distribution and Electronic Commerce cluster in Virginia, for example, the U.S. Cluster Mapping Project identified the Johnson City-Kingsport-Bristol (Tri-Cities), TN-VA EA as a region with a high specialization in the cluster (see online Appendix). A contributing factor in the success of the cluster, despite the relatively isolated location of the region, was the development of the first municipal utility in the United States to deploy an all-fiber network offering the triple play of video, voice, and data services in the core city of Bristol, Virginia (Zager, no date). Although more analysis is needed to identify the features of the cluster that are ripe for growth or the value chain gaps that could be filled within the region, an initial review revealed that one component of the cluster, distribution centers and warehousing, has been successful in rural communities and in creating economic stability in recent years (Robertson, 2021). Therefore, one path for growing the Distribution and Electronic Commerce cluster in Virginia is to further examine the potential of rural parts of the Johnson City-Kingsport-Bristol (Tri-Cities), TN-VA EA, such as Lee County, Virginia, as candidates for distribution centers and warehousing. Given the importance of site preparation and logistics infrastructure for this type of activity, ensuring these could be an important step to executing a connectivity strategy in the county.
Other investments can range from collective marketing of a region's clusters and providing firms and entrepreneurs with local services, such as financial advice, marketing, and design, to identifying weaknesses in existing cluster value chains, attracting investors and businesses to fill those gaps, aligning industry needs and workforce programs, and streamlining the regulatory environment (Cortright, 2006; Delgado & Zeuli, 2016). For example, this new framework would ensure that remote rural communities have workforce development programs that are accessible to local residents and are aligned to regional clusters or that manufacturers in adjacent communities can adapt to emerging clusters that help them plug into regionalized supply chains. In and of themselves, these strategies are not new or unique to regional economic connectivity. They are common economic development strategies, specifically cluster-based strategies; however, applying them within an economic connectivity framework encourages practitioners to think more deliberately about where and how assets are developed within a region.
Limitations
Overall, the findings from this analysis suggest that regional economic specialization should be explored as a source of local cluster growth. Within the overall framework, model execution, and policy implications, key limitations should be considered. First, while connectivity to regional industry clusters presents a viable path for growth, other growth factors are critically important to the success of local economies, such as labor force skills and infrastructure investments. These factors are partially accounted for in our model by the inclusion of fixed effects, but by not including a fuller range of factors, bias may be introduced into it. Additionally, it is possible that the study suffers from reverse causality. Although this analysis finds that connectivity and regional economic specialization contribute to local cluster growth, it is also possible that expanding firms in any given industry may be attracted to locations with greater connectivity and regional assets.
In terms of policy implications, as previously stated, identifying regional cluster specializations is an important step in applying a connectivity strategy. Also important is a detailed analysis and understanding of local and regional assets to support cluster expansion, as well as the growth trajectory of the cluster in general. For example, economic developers in a locality or region should be cautious about investing efforts in legacy clusters, like coal and furniture, even if regional cluster specialization exists. Additionally, different types of clusters – those that are more knowledge/innovation intensive versus those that are more heavily focused on manufacturing, for example – have different spatial footprints within regions and require different assets and community types to thrive. This is one reason why high-tech industries are concentrated in very few, highly urban areas. Additional analysis of which industry clusters in which community types, would give practitioners better insights into the clusters that could benefit most from a connectivity approach.
Conclusion
Examples from all parts of the country, from California and Oregon to Minnesota and Virginia, underscore how robust connectivity within regions, often between urban and rural communities, provides the fuel that drives business innovation, competitiveness, and growth. Our analysis reveals that connectivity between local and regional clusters has a relationship with local cluster employment growth. This relationship bears out for all community types, particularly rural micropolitan communities, and can be seen when examining county clusters in the Commonwealth of Virginia. This suggests that coordinated regional economic development approaches across jurisdictions and sectors are promising for rural development.
While economic connectivity is a potential strategy for communities with nearby regional economic strengths, there are communities whose entire regions are economically challenged and for which this approach may not present a viable path. Additionally, connectivity is not a prescription but reflects how competitive regions and industry clusters within them can leverage a broader range of assets in urban and rural communities from talent and critical infrastructure to specialized suppliers and niche customers. The application of a regional connectivity framework can help practitioners and policy makers identify potential industry cluster pathways for rural and lagging communities and prioritize investments to support growth and development that narrow the urban-rural divide.
Footnotes
Author Note
This article is an adaptation of McFarland, C. and Grabowski, E. (2021). “Regional Connectivity to Bridge the Urban-Rural Economic Divide in Virginia,” in Vibrant Virginia. Virginia Tech Press. Blacksburg.
Declaration of Conflicting Interests
The author(s) declared no potential conflicts of interest with respect to the research, authorship, and/or publication of this article.
Funding
The author(s) received no financial support for the research, authorship, and/or publication of this article.