
Abstract
This paper examines whether different structures of co-patenting networks affect regional economic adaptation and adaptability in divergent ways. Adaptation differentiates from adaptability by recovering in a pre-shock growth path, while adaptability entails forging a new growth path. Focusing on computer, electronic, and electrical equipment manufacturing industries in U.S. metropolitan and micropolitan areas from 1990 to 2012, the study reveals that complete networks, characterized by closely connected nodes, promote adaptation but weaken adaptability. In contrast, coalitional networks, featuring loosely connected subgroups, enhance adaptability but hurt adaptation. The study contributes to regional economic resilience literature by empirically demonstrating the trade-off relationship between adaptation and adaptability from network structures’ perspective. Practically, the study helps policy makers to effectively allocate stimuli, such as grants and tax incentives, to develop targeted co-patenting networks to improve adaptation or adaptability.
Regions can be viewed as networks of connected individuals, firms, institutions, and industries (Balland et al., 2015; Tóth et al., 2022). Agents in the network interact with each other and the environment and rebuild the connections to adapt to external change (Bristow & Healy, 2014). Different network structures indicate trade-off relationships in coordinated capabilities and levels of openness (Chapple, 2002). For example, a network where nodes connect with each other increases access to diverse information and promotes learning but lacks efficiency in coordinating resources and diffusing information. In comparison, a network where a hub dominates the whole network enhances efficiency but lacks diversity (Therrien et al., 2019). Meanwhile, evolutionary economic geography literature suggests that regional economic resilience has two dimensions: adaptation and adaptability (Boschma, 2015). Adaptation describes the capability of an economic system to resist external shock and to “bounce back” to the pre-shock development path (Boschma). In contrast, adaptability refers to a region's ability to adapt to long-term structural change and develop new growth paths (Boschma). Notably, other scholars have described these two concepts differently. For example, Martin and Sunley (2015) used “engineering resilience,” instead of adaptation, to describe the economic system's ability to return to its pre-shock equilibrium. Meanwhile, they used “adaptive resilience,” instead of adaptability, to describe structural and functional change. What's tricky is that these two types of resilience hardly coexist (Pike et al., 2010). When a region is efficient in returning to the pre-shock path, it is likely reluctant to develop a novel growth path, and vice versa (Martin, 2012).
Existing quantitative empirical studies examining the relationship between economic network structure and economic resilience primarily focus on adaptation (Kurth et al., 2020; Suire & Vicente, 2014; Ye & Qian, 2021), with a few exceptions examining adaptability (Statsenko, 2017). However, even Statsenko doesn’t consider the trade-off relationship between adaptation and adaptability (Pike et al., 2010). As a result, our understanding of the relationship between adaptation and adaptability is limited. Furthermore, most economic resilience studies focus on European regions (Pontarollo & Serpieri, 2020; Tóth et al., 2022), but the United States is heterogeneous in economic structures and performance.
This paper fills in the gap by being the first to connect the trade-off relationship between bonding and bridging network structures in social capital literature with the discussion of adaptation and adaptability in economic resilience literature. Meanwhile, the study is the first to empirically quantify the magnitudes of network structures’ influence on adaptation and adaptability, using co-patenting networks in the U.S. metropolitan areas as a contextual example.
Patent is a widely used proxy for innovation, and we use co-patenting networks as proxies for innovation-collaboration networks. The structures of innovation-collaboration networks emerge from the micro interactions of inventors. The different structure indicates different patterns of exchanging resources, knowledge, and capital, and thus influences the macroregional resilience capability (Berrou & Combarnous, 2012; Vicente, 2020). For example, adaptation benefits more from efficiency to bounce back within the old growth path, while adaptability needs diversity to bring new ideas and knowledge to develop new growth paths. Different network structures reflect different combinations of diversity and efficiency, thus differently affecting adaptation and adaptability.
We focus on two innovative industries, NAICS 334: Computer and Electronic Product Manufacturing (CEPM) and NAICS 335: Electrical Equipment, Appliance, and Component Manufacturing (EACM). Our study entails the collection of patent inventors’ data from the U.S. Patent and Trademark Office (USPTO) to construct co-patenting networks within these two industries across all U.S. metropolitan and micropolitan areas on a quarterly basis from 1990 to 2012. The network structures are categorized into four types: complete, factional, coalitional, and bridging networks (Crowe, 2007). Additionally, we gather employment data per quarter at the four-digit industry-code level from the U.S. Bureau of Labor Statistics (BLS) to develop measurements for adaptation and adaptability. Employing a seemingly unrelated difference-in-differences model, our analysis reveals that the complete network contributes most significantly to adaptation, while the coalitional network provides the greatest benefits for adaptability.
This paper pertains to both researchers and practitioners. Researchers can better understand how network structure nurtures adaptation and adaptability, respectively. The study contributes to the discussion in economic resilience literature of trade-off relationships between adaptation and adaptability (Hu & Hassink, 2017) from the network structure's perspective. Economic development practitioners can better understand the advantages and drawbacks of different innovation-collaboration network structures to purposely promote adaptation or adaptability in different regions and development stages. For example, the California Office of the Small Business Advocate initiated the CA Inclusive Hub Program (CA Hub) to foster collaboration across different agents, including private firms, academia, nonprofits, and governments (California Office of the Small Business Advocate, n.d.). The program focused on technology and science-based firms and offered technical assistance and mentorship, connecting research institutes, venture capital groups, and incubators with inventors and start-ups. San Francisco uses the CA Hub program to serve local inventors and boost the economy. The Humanmade CA Accelerate California Hub in San Francisco provides inventors with creative space, professional equipment, software, and skilled staff to offer advice. Also, frequent training and workshops are available for creative individuals to enhance skills and develop networking (Humanmade, n.d.). Other local administrators can learn from San Francisco's experience, utilizing state or federal programs and grants to create shared incubator space, organize networking events and workshops, and offer technical training programs to encourage inventors living in marginalized cities to start collaboration. By strategically cultivating a complete innovation-collaboration network, policy makers can increase regional adaptation. These efforts help regions purposely reshape network structure and enhance adaptation or adaptability to combat a variety of external shocks.
Literature Review
Prior studies have confirmed the role of network structure in facilitating regional economic resilience with mixed results (Crespo et al., 2014) but failed to recognize the dual dimension of economic resilience. In this paper, we use Crowe's (2007) network framework, which classifies four network typologies based on a scale from bridging to bonding. We hypothesize that each network structure corresponds to a particular combination of adaptation and adaptability. The next section gives a detailed discussion of network structures’ conceptualization.
The Typology of Four Network Structures
Bonding and bridging are two types of network structures widely discussed in the social capital literature (Agger & Jensen, 2015; Cofré-Bravo et al., 2019; Hoyman et al., 2016). Bridging networks involve sparse connections and weak ties and are open to including people across diverse social groups, but they are less reliable and less cohesive (Andrew & Carr, 2013; Callois & Aubert, 2007; Patulny & Svendsen, 2007; Poortinga, 2012; Putnam, 2000). In contrast, bonding networks embody dense, strong ties among homogeneous groups and are exclusive, but can increase intercommunity segmentation (Granovetter, 1973; Kim, 2018; Patulny & Svendsen; Putnam).
Crowe (2007) divided bonding and bridging network structures into four types (Figure 1). The bonding network structures include complete and factional typologies. The complete network refers to a bonding structure in which each agent in the network is connected to all the other agents, which is a “global” bonding. Such a network is extremely cohesive. The factional network includes two or more bonding subgroups that are not connected to each other, which is a “local” bonding. Such structure intensifies intercommunity segregation. Meanwhile, the bridging network structures include coalitional and bridging configurations. The coalitional network includes loose connections linking densely bonded subgroups. Such a structure could facilitate resource exchange across different subgroups and maintain the power to organize collective activities. The bridging network involves loosely connected ties among agents. Such a structure has access to diverse resources but lacks efficiency due to the longer distance of exchanging resources and information.
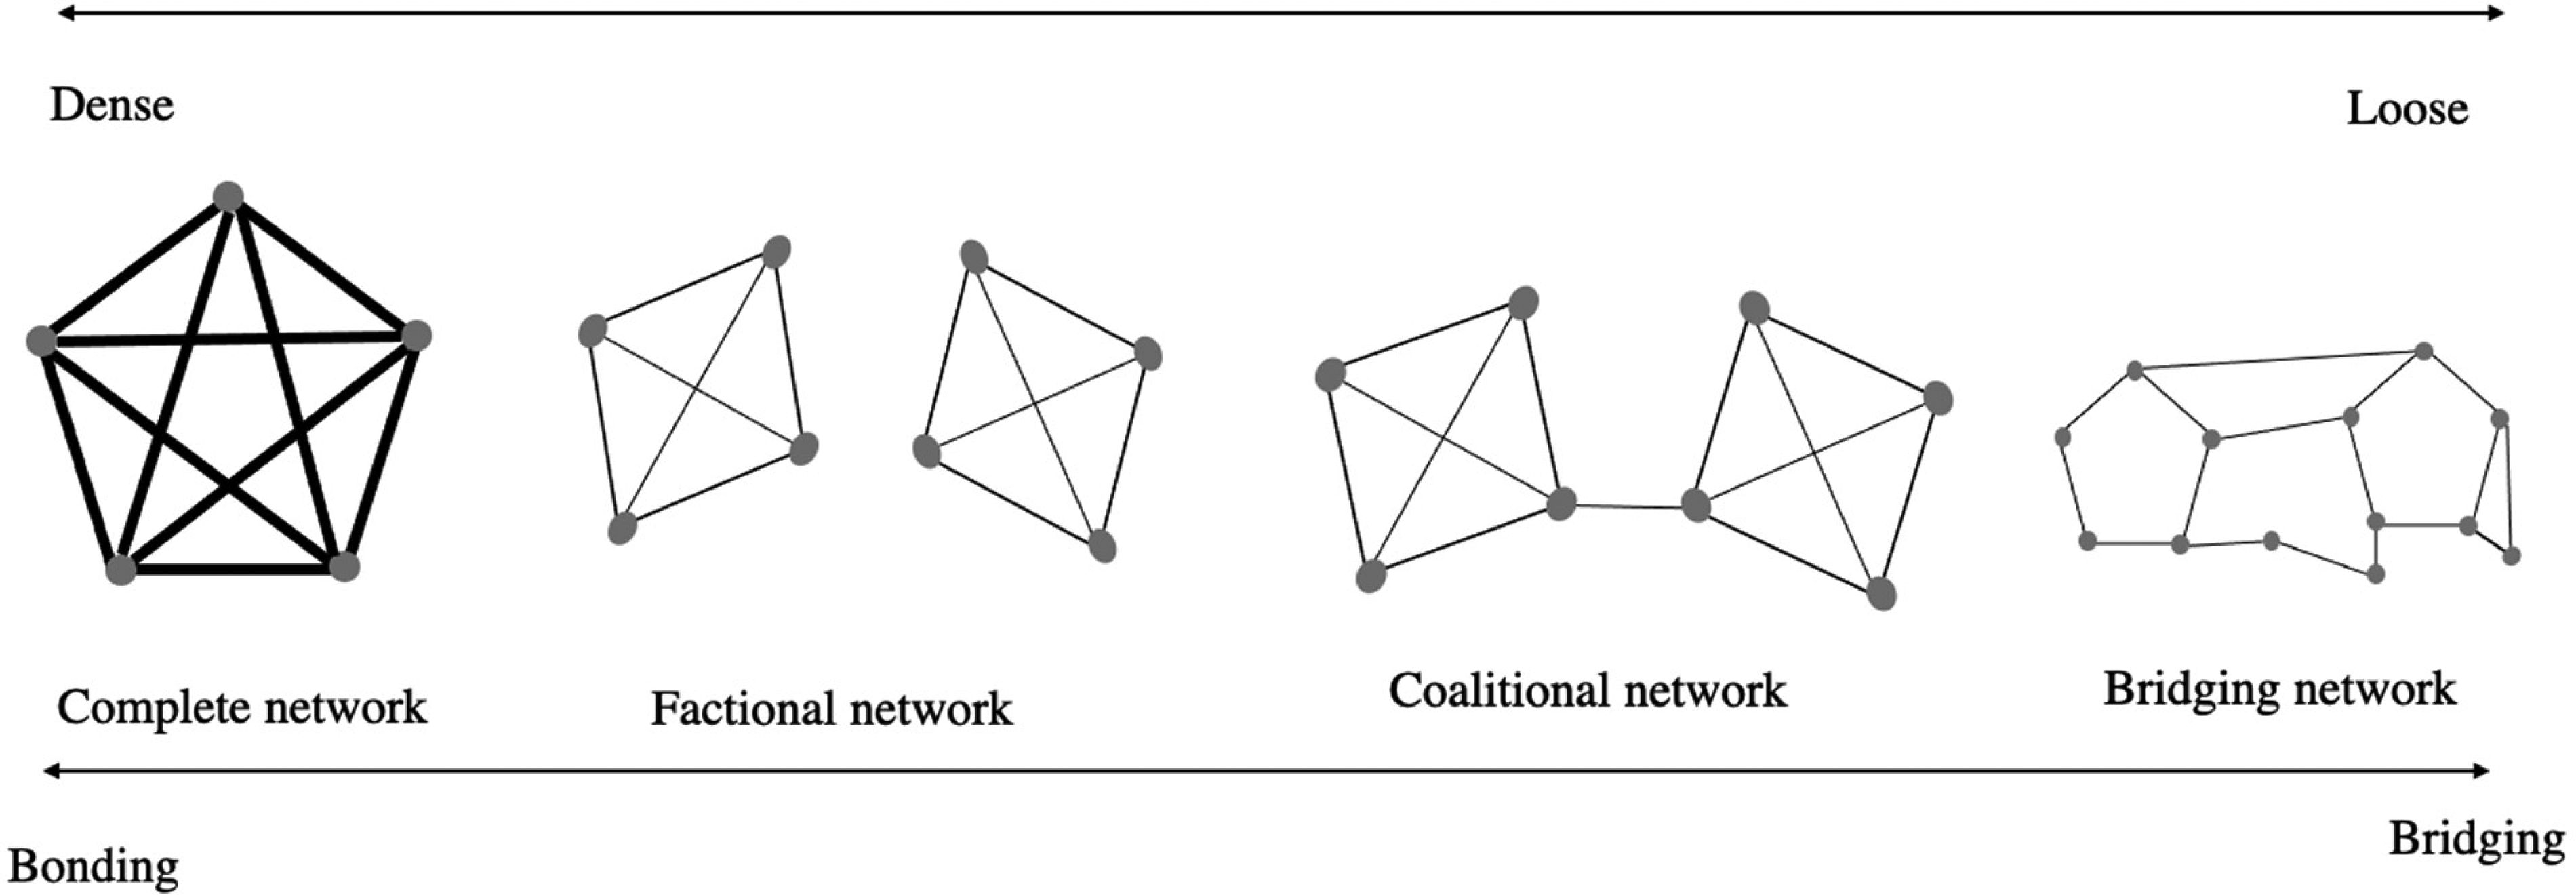
Four-network structure typology. Source: Crowe (2007).
Different networks contribute to resilience through distinctive channels: a bridging network cultivates resilience by increasing access to diverse resources, while a bonding network promotes resilience by building trust and facilitating collective actions within the community (Newman & Dale, 2005). However, Newman and Dale only theoretically discussed the advantage of different network structures and qualitatively assessed it, but the framework has not been empirically tested. Our paper moves one step further by empirically examining whether different network structures contribute to different dimensions of regional economic resilience.
The Dual Nature of Adaptation and Adaptability
Evolutionary economic geography literature classifies regional economic resilience into two dimensions: adaptation and adaptability (Boschma, 2015; Bristow & Healy, 2018; Pike et al., 2010). Adaptation describes a system's ability to accommodate shocks in the short term and within an established development path (Pike et al.). Adaptability focuses on a system's long-term capability to reconstruct the industrial structure and develop a new growth path (Boschma, 2015; Martin, 2012).
Adaptation and adaptability are trade-offs with each another (Martin & Sunley, 2006). When a region is open and has access to diverse resources, it has high adaptability to transform its economic structure and create novel development trajectories detached from the past (Boschma, 2015; Martin, 2012). Whereas a specialized and homogeneous regional economic system is more likely to bounce back in the established development path along with its history (Hassink, 2010; Martin & Sunley, 2006; Pike et al., 2010). However, recent studies have indicated that adaptability and adaptation can move beyond a trade-off relationship and arrive at a reciprocal condition, both theoretically and empirically (Hu & Hassink, 2017, 2020). Hu and Hassink (2020) argued that high adaptability is a long-term outcome of high adaptation when agents purposely adapt to environments. One example is the Zaozhuang City in Hu and Hassink's (2017) case study. Zaozhuang is a coal city that struggled with overreliance on the coal economy. The mayor strategically collaborated with local stakeholders to cultivate a cultural tourism industry unrelated to the coal industry. They mobilized local resources, legacies, and networks to diversify the local economy and transform Zaozhuang into an attractive tourist city. Meanwhile, tourism improved the image of the region, from which the coal industry benefitted from increasing investment in the region. These new investments facilitated the local coal firms to develop coal-related businesses, such as boosting coal-related chemical products. Hence, Zaozhuang City embraces high adaptation and adaptability. The case study indicates a win-win solution between adaptation and adaptability. Our study tests whether a region can achieve high adaptation and adaptability from a network structure's perspective.
Hypotheses on the Relationships Between Adaptation, Adaptability, and Network Structures
Regional economic resilience depends on technological and economic network structures (Vicente, 2020). However, no studies have examined how different network structures affect adaptation and adaptability simultaneously. Focusing merely on adaptation risks ignoring the cost of weakening adaptability in the pursuit of adaptation, due to their inherent, often trade-off relationship. Balancing this trade-off relationship between adaptation and adaptability is important for achieving overall economic resilience. Hence, examining adaptation and adaptability concurrently is needed.
Theoretically, bonding and bridging network structures improve resilience in distinctive ways (Newman & Dale, 2005). Adaptation and adaptability have a competitive relationship and need different resources. Empirically, network structure's influence on adaptation and adaptability is found to be mixed. For example, Tóth et al. (2022) found that a bonding network structure that was less likely to collapse into segments could increase adaptation. Relatedly, Kahl and Hundt (2015) examined whether firms’ interorganizational network influenced regional adaptation. They focused on the German biotechnology industry and used the employment growth rate as a proxy for adaptation. They found that when firms’ network involved more diversified organization categories (e.g., research organization, government institutes, biomedical companies), the region exhibited stronger adaptation. Ye and Qian (2021) showed that enhancing the connections between core and peripheral cities (i.e., a bridging structure) improved regional resilience by increasing real gross domestic product (GDP), but they failed to separate adaptation and adaptability. Statsenko (2017) examined the mining equipment and technology services (METS) firms in South Australia and used the innovativeness and diversification of local suppliers as a proxy for adaptability. He found that a high-degree centrality improved adaptability. However, the study used cross-sectional supply network data and couldn’t capture the network's temporal changes and their influence on resilience. Moreover, the study failed to consider the trade-off relationship between adaptation and adaptability. In sum, our knowledge of how different network structures simultaneously affect adaptation and adaptability is still quite limited.
This paper fills in the gaps. Figure 2 summarizes the theoretical hypotheses of how different network structures influence adaptation and adaptability, respectively. We use Crowe's (2007) framework of network structure and develop four hypotheses of relationships between network structures and adaptation and adaptability.
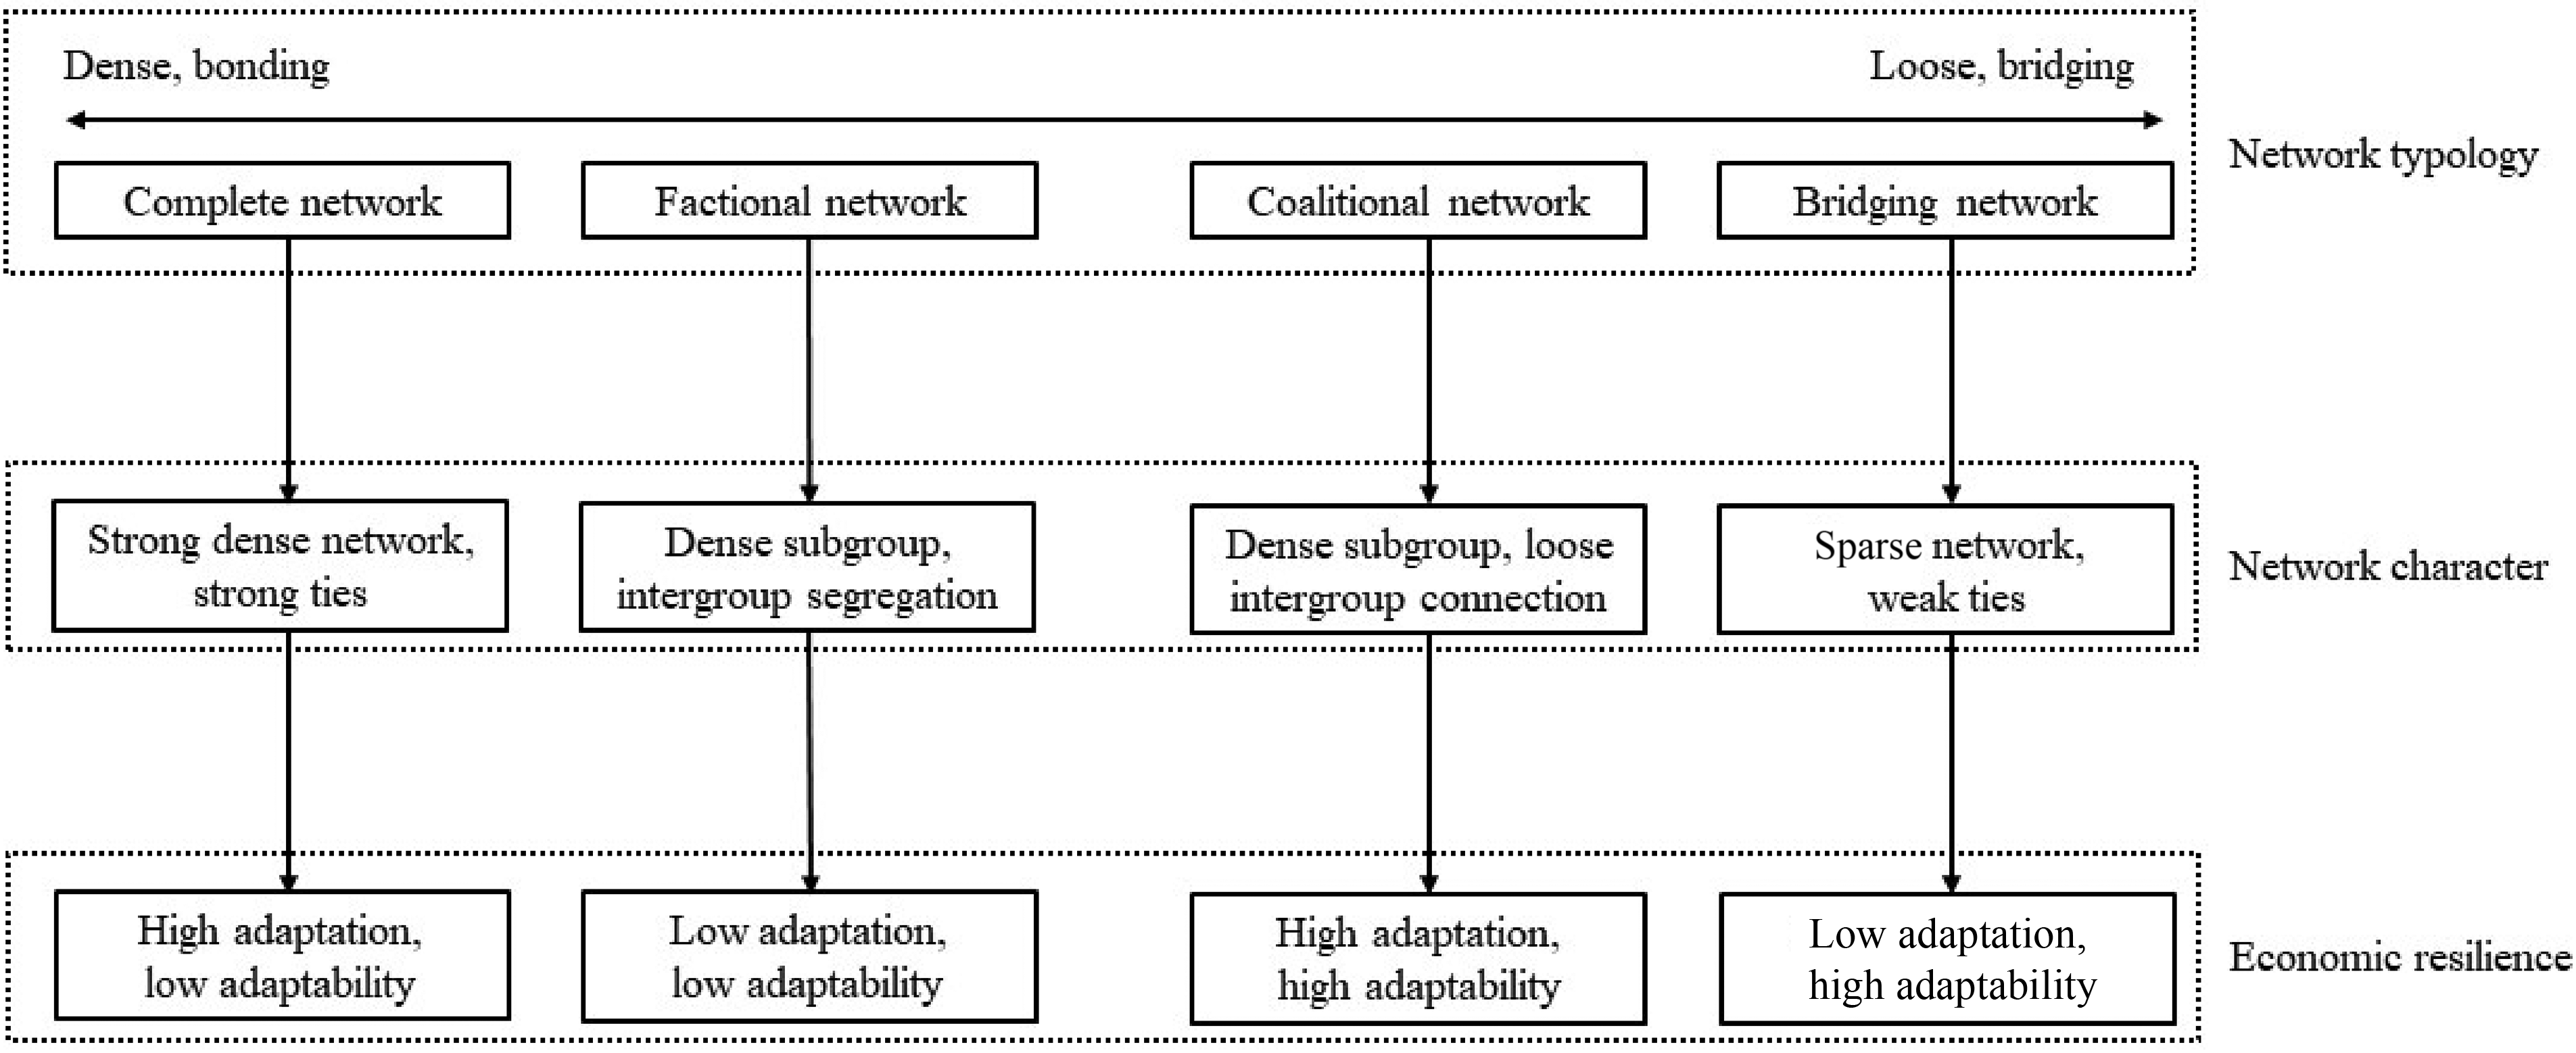
Theoretical relationships between network structures and adaptation and adaptability.
Data
Our spatial analysis unit is core based statistical areas (CBSAs) downloaded from the U.S. Department of Transportation (U.S. Department of Transportation, 2022). CBSAs encompass metropolitan and micropolitan statistical areas. Metropolitan statistical areas consist of urbanized areas with populations of at least 50,000, while micropolitan statistical areas include urban clusters with populations between 10,000 and 50,000 (U.S. Census Bureau, 2021). The Office of Management and Budget defined the CBSA boundaries based on the 2010 Census. The data set was updated on August 09, 2019, from the U.S. Census Bureau and is part of the U.S. Department of Transportation /Bureau of Transportation Statistics National Transportation Atlas Database (U.S. Department of Transportation, 2022).
Our data are collected from three main resources. Innovation-collaboration network structures are constructed using patent inventor data. We collect patent inventors’ data from USPTO, which includes the inventor's name, location, and patent ID that is created by the inventors.
We focus on two innovative industries: NAICS 334 (Computer and Electronic Product Manufacturing, CEPM) and NAICS 335 (Electrical Equipment, Appliance, and Component Manufacturing, EACM). CEPM includes “establishments that manufacture computers, computer peripherals, communications equipment, and similar electronic products, and establishments that manufacture components for such products” (U.S. Bureau of Labor Statistics, 2022a, website). EACM is establishment “producing lighting fixtures, electric light bulbs, and parts (except glass parts and light emitting diodes, and other lighting equipment” (U.S. Bureau of Labor Statistics, 2022b, website). CEPM and EACM are selected because they are two of the most innovative industries based on patent intensity shown in the USPTO Intellectual Property and the U.S. Economy (third edition; United States Patent and Trademark Office, 2016). We prioritize industries where innovations are active, and the number of granted patents is large, so a co-patenting network can be influential in economic resilience.
The study only includes patents that have been eventually granted. Granting patents is a long process. According to the USPTO, the average time from filling a patent application to getting a first USPTO action takes about 20 months (U.S. Patent and Trademark Office, n.d.). To avoid the unnecessary delay caused by patent processing, we use the patent application time for study. Our hypothesis is that by the time that inventors apply for the patent, the innovation is already completed, and the techniques can be diffused through collaborators’ networks.
To match patents with specific industries, we use the crosswalk between the U.S. Patent Classification (USPC) and NAICS to assign patents to specific industries (Patent Technology Monitoring Team, 2023). USPC is the official patent classification system used and maintained by USPTO before 2013 (Technology & Patent Research International, 2015). As a result, our study time is limited to 1990 until the end of year 2012. We include 7.03 million CEPM and 3.38 million EACM patent inventors’ data within the study period. We use the city-level location information to construct the inventors’ co-patenting networks in all CBSAs quarterly in the United States. In our network, nodes are cities where patent inventors are located, and ties between cities exist when inventors living in two cities are co-patented. The strength of ties is measured by the frequency of co-patenting, and it isn’t affected by the physical distances between cities.
However, the patent data have limitations. Not all innovations would be transformed into patents because maintaining a patent is costly. When an innovation doesn’t generate profits, a firm is unlikely to choose to apply for a patent. Hence, patent data are not comprehensive in measuring innovation. Nevertheless, the patent is still the most widely accepted indicator of innovation (Bottazzi & Peri, 2003; Bowen et al., 2013; Fang, 2015).
Meanwhile, we collect employment data quarterly from 1990 to 2017 at the four-digit NAICS code level in CEPM and EACM from the BLS to calculate a CBSA's adaptation and adaptability. The study spans from 1990 to 2012, with employment data from 2013 to 2017 being used to establish lagged measurements. For example, in terms of measuring 5-year adaptation, we utilize the patent data in 2012 to construct networks and use employment data in 2017 to calculate the measurement for 5-year adaptation.
Regarding external shocks, we use all the influential natural hazards to examine a region's adaptation and adaptability. The data are from the Spatial Hazard Events and Losses Database for the United States. This data set covers records of 18 kinds of natural hazards from 1960 to 2021. It includes information on the date of the hazard, the affected county, and the direct losses (e.g., property and crop losses). We focus on hazards that cause more than $100 million in losses measured by the sum of property and crop damages per incident to focus on shocks that have a significant influence. All the losses are measured using U.S. dollars in the year 2020. After matching with patent data, our analysis includes 186 (158) hazard records covering 87 (75) metropolitan areas between 1990 and 2012 in CEPM (EACM). Meanwhile, we include 257 (261) metropolitan areas and 2 (2) micropolitan areas that haven’t suffered from natural hazards during the study period in CEPM (EACM) as control regions for comparison. The spatial distributions of CBSAs are shown in Figure 3.

Spatial distribution of CBSAs affected by identified natural hazards versus nonaffected CBSAs.
Method
Measurement for Network Structures
We adopt social networks analysis (SNA) to quantify the co-patenting network structures of CEPM and EACM for CBSAs in the United States from 1990 to 2012, on a quarterly basis. SNA provides a conceptual framework and a set of analytical tools to visualize relational data and analyze social network structures (Dempwolf & Lyles, 2012; Reid et al., 2008). It has been applied to study knowledge flows within and across regions (Boschma, 2015). In our case, we constructed the co-patenting networks and used centrality measurements to quantify the network structure. Such co-patenting networks reflect the collaborative relationship among cities within CBSAs.
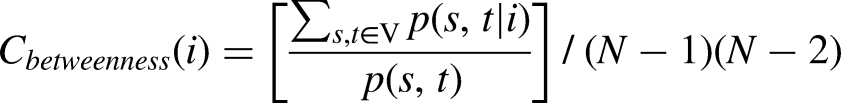
The centrality measurements in Table 1 operationalize Crowe's (2007) theoretical framework. “Betweenness centrality” measures how often a node lies on the shortest path between other nodes in the network (Freeman, 1977; Knoke & Yang, 2008). In our context, it measures how frequently a city acts as a shortest-distance bridge to connect other cities to form a patent collaboration. When a city acts as a bridge to connect the other cities, it creates paths and promotes diverse resource exchange. At the same time, it indicates the network is more fragile due to the reliance on the bridging cities. We used the standard deviation of betweenness centrality to measure the magnitude of uneven distribution of betweenness centrality across nodes. Bridging and coalitional network structures are networks with a high standard deviation of betweenness centrality, which is characterized with less cohesion and more diversity. Our study defines CBSAs with standard deviation of betweenness centralities that fall into the top 50% of the distribution as high and the remaining 50% as low. The formula is as follows:
Network Typology and Measurement.

“Closeness centrality” measures how close each node connects with other nodes by calculating the distance from the node to all other nodes in the network (Andrew & Carr, 2013). In our study, when inventors from one city frequently collaborate with inventors from another city, we regard the collaborative distance between the two cities as shorter. Technically, the direct distance between two cities is defined as the inverse of co-patenting frequency. More frequently collaborated cities have a shorter distance. If two cities are not directly connected but use other cities as bridges to connect, the distance between them is the sum of the accumulated distance along the shortest path from the origin city to the destination city. Shortest path refers to the most efficient route from one city to another.
If the network includes more than one disconnected subgroup, the closeness centrality of a single city in the whole network equals the proportion of cities within the CBSAs that can be reached, relative to the average distance from the reachable cities (Wasserman & Faust, 1994). The formula of closeness centrality is as follows: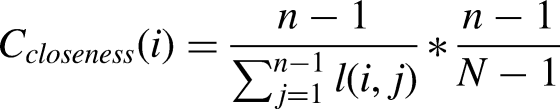
A complete or coalitional network structure is a network with high average closeness centrality, which is characterized by good connections. Whereas the factional network structure is segregated on average and the bridging network structure is loosely connected, the average distance from one node to other nodes is large and the average closeness centrality is low. Like the measurement of betweenness centrality, we define CBSAs with mean of closeness centrality that fall into the top 50% of the distribution as high and the remaining 50% as low.
Measurement for Adaptation and Adaptability
Regional economic resilience studies develop different measurements for adaptation and adaptability. For example, Tóth et al. (2020) and Muštra et al. (2020) used the employment rate ratio before and after the 2008 economic crisis as the measurement for adaptation. Xiao and Drucker (2013) used the annual growth rate of income per capita and employment to reflect regional adaptation after a flood.
Regarding the measurement of adaptability, Carlsson et al. (2014) used the new business growth rate after the restructuring programs compared with the national average to reflect regional adaptability. Mardaneh et al. (2020) used changes in the income-generating industry classification before and after a shock to measure adaptability. Overall, the measurement for adaptation and adaptability involves employment, income per capita, business growth rate, and changes of industry. Nevertheless, employment data are the most widely used data source (Di Caro, 2020; Pontarollo & Serpieri, 2020). Our crosswalk between USPC and NAICS is at the three-digit NAICS-code level, so we can know which patent belongs to which three-digit NAICS code. To examine how the patent network affects adaptation and adaptability within the three-digit NAICS industries, we used the four-digit NAICS code to construct measurements and distinguish the growth path that is along with the original growth path or is detached from the original one.
“Adaptation” reflects an economic system's ability to resist external shock and recover to the preshock condition. First, we identified local pillar industries using location quotients more than 1.2 (Garnick, 1969) at one quarter before the natural hazard shock. Second, we traced the development trajectory of the prenatural-hazard pillar industry (PI) by collecting their location quotients after the natural hazard from BLS. Third, we calculated the average location quotient of the pillar industries one quarter before the natural hazard and q quarter after, and used the average change rate to reflect adaptation at time t + q. A large value indicates that the prenatural-hazard pillar industries bounce back effectively, thus indicating a high adaptation. The formula is as follows:
“Adaptability” reflects an economic system's ability to depart from the existing industrial structure and develop a new growth path. We used the percentage of new pillar industries after the natural hazards to reflect adaptability. We calculated what is the percentage of new pillar industries after the natural hazards compared with that in the prenatural hazard to define adaptability. A higher value indicates greater adaptability, signifying the emergence of more new pillar industries following natural hazards. The formula is as follows:
Measurement for Damages in Natural Hazards
Studies indicate that large natural hazards disrupt economic activities and generate long-term negative economic influence. For example, Hsiang and Jina (2014) adopted tropical cyclones from 1950 to 2008 to identify the influence of environmental hazards on a country's long-term economy. They found that national income declined 20 years after the hazards. Berlemann and Wenzel (2015) examined the relationships between natural hazards and economic growth using drought data from 1960 to 2022 and found that droughts created long-term negative effects on a country's growth. Huang et al. (2024) found that earthquakes significantly decreased GDP per capita in the long run in China.
Given these pieces of empirical evidence, we used accumulated damage to measure the hazards’ influence on regions. Specifically, to reduce skewness, the study includes the natural logarithm of how many million 2020 dollars loss a CBSA i had from 1990 to time t in the regression model.
Seemingly Unrelated Difference-in-Differences Regression
We examined adaptation and adaptability simultaneously. We used seemingly unrelated regression combined with difference-in-differences regression to approach causal inference. The system of regression is as follows:

The model has limitations. The network structure may evolve toward a more resilient direction as a response to the hazards. The current results can identify which network structure is more helpful to adaptation or adaptability but cannot tease out the possibility that high resilience is due to the evolution of network structure in response to natural hazards. Second, the model focuses on the co-patenting network across cities within CBSAs but overlooks the firm's internal networks. Larger firms own their internal network, such as the connections between headquarters and the branches, which might affect the regional economic resilience. Third, we used the accumulated damage as a proxy for the long-term influence of hazards, which can be inequivalent to the real long-term influence. However, studies indicate that the precise long-term influence of hazards is nonlinear and very complicated to quantify (Botzen et al., 2019). In this case, we used the accumulated damage as a feasible proxy for the long-term influence of hazards and added sensitivity analysis, making the influence of each natural hazard depreciate in 10 years. Fourth, industry age varies across regions. Our model doesn’t control industry age due to data limitations. Fifth, labor-saving innovation can reduce the location quotient of an industry and, therefore, the value of adaptation and adaptability. This paper cannot fully separate labor-saving from nonlabor-saving innovation due to the limitation of the patent data.
Results
Descriptive Analysis
The prerequisite of using difference-in-differences regression is to identify the prenatural-hazards parallel trend. Figure 4 contrasts quarter-to-quarter average prenatural-hazards adaptation and adaptability in identified natural-hazards affected areas and unaffected areas during the study period. It focuses on one-quarter adaptation and adaptability, and the figures of 1-, 3-, and 5-year adaptation and adaptability are shown in the supplementary online appendix.

The average trend of one-quarter adaptation and adaptability in the affected areas versus unaffected areas.
Before natural hazards occur, unaffected areas exhibit higher adaptation in CEPM but a lower adaptation in EACM. They display a consistent parallel trend over time. During the 1990s, both affected and unaffected areas saw a slight increase in their trend. Around 2000, both groups experienced a sharp decline. After 2002, the two groups’ adaptation stabilized at approximately half of their 1990s values. Regarding adaptability, affected and unaffected areas closely follow each other over time. In summary, the two groups share a general parallel trend in their average adaptation and adaptability during the period before natural hazards occur.
The Network Impact on Adaptation
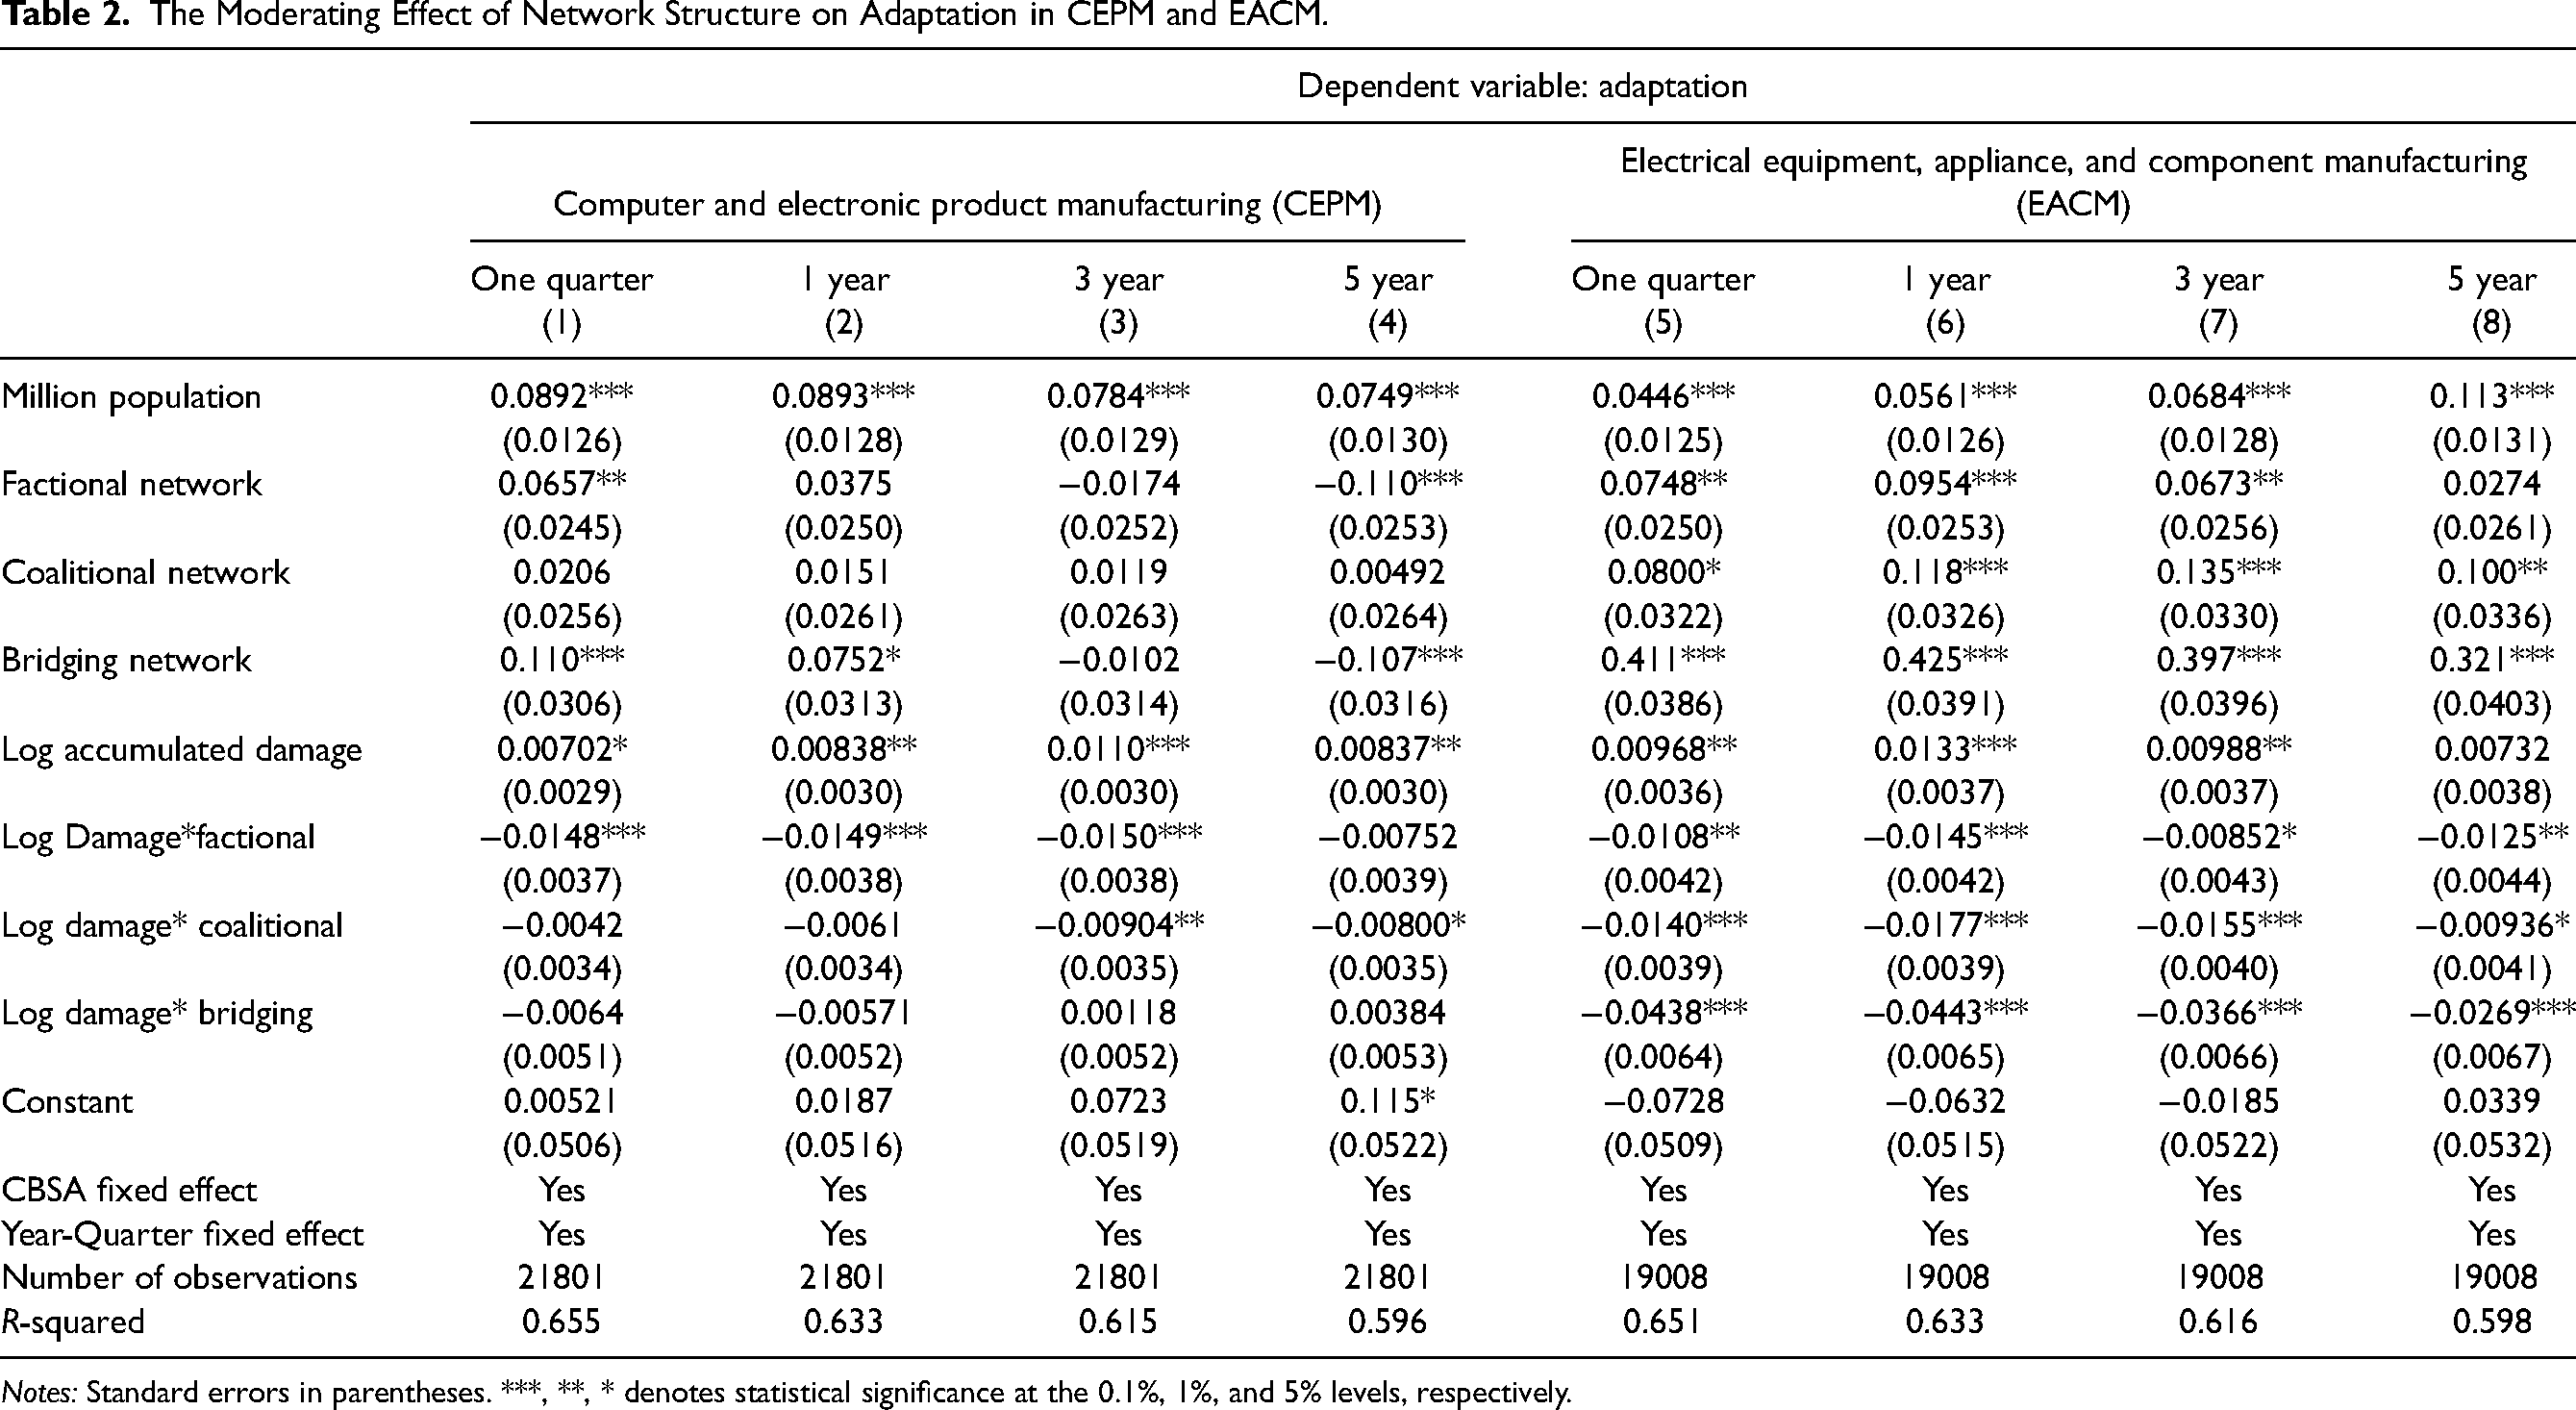
Table 2 shows the estimation results for Equation (1). Columns 1 to 4 describe the moderating effect of network structure between natural hazards and adaptation in CEPM, and columns 5 to 8 focus on EACM. All the results use the complete network as a baseline. Compared with the complete network, the factional network shows a 1.5% decrease in the average location quotients of prenatural-hazards pillar industries one quarter after the occurrence of natural hazards in CEPM, corresponding to a 1% increase in accumulated damage. The result shows that the original pillar industries are less concentrated after natural hazards compared with the prehazard period when the network structure transforms from a complete network to a factional network. For example, the affected CBSAs have 4,850 jobs on average in CEPM pillar industries in one quarter during the study period. A 0.015-point decline in one-quarter adaptation signifies that, keeping the overall regional employment as a constant, the pillar industries shrank by 73 jobs one quarter after the natural hazard if the network structure changes from complete network to factional network.
The Moderating Effect of Network Structure on Adaptation in CEPM and EACM.
Notes: Standard errors in parentheses. ***, **, * denotes statistical significance at the 0.1%, 1%, and 5% levels, respectively.
The differentiating influence of factional and complete networks in EACM is similar, with a 0.011 decline in a factional network. The largest gap between a complete network and a factional network's moderating effect occurs 3 years after natural hazards in CEPM, while in EACM, this effect reaches its peak at 1 year. Overall, the factional network has a smaller adaptation after natural hazards across all study periods, compared to the complete network in both CEPM and EACM. The results verify our hypothesis that a factional network has a low adaptation among the four network typologies.
The coalitional network presents a smaller adaptation than the complete network. Consistent with the factional network, the largest gap between the complete network and the coalitional network occurs at 3 years after hazards in CEPM, while, in in EACM, 1 year after natural hazards witnesses the most significant difference between the coalitional and the complete network. The results reject our hypothesis that coalitional network has a high adaptation among the four networks.
A bridging network has a statistically insignificant smaller adaptation than a complete network after natural hazards in CEPM, whereas the difference is strong and significant in EACM. Consistent with factional and coalitional networks, EACM has the largest difference between networks’ moderating effect at 1 year after the natural hazards. The results verify our hypothesis that a bridging network has low adaptation among the four network structures.
Despite the heterogeneous influence of network structure across industries and time, we can see that a complete network has the strongest adaptation. Our hypotheses about the impact of complete, factional, and bridging network structures on adaptation are verified, whereas the hypothesis that a coalitional network has a high adaptation is rejected.
The Network Impact on Adaptability
Table 3 shows the estimated results for Equation (2). The complete network witnesses a low adaptability after natural hazards, compared with the other three network structures. CEPM and EACM with complete networks experience the lowest adaptability 3 years after natural hazards, whereas EACM has the lowest adaptability 5 years after natural hazards. When accumulated damage increases by 1%, the 3-year adaptability of complete network decreases by 0.007 in CEPM. It suggests that the likelihood of developing new pillar industries compared with pre-natural-hazard time is reduced by 0.7%.
The Moderating Effect of Network Structure on Adaptability in CEPM and EACM.

Notes: Standard errors in parentheses. ***, **, * denotes statistical significance at the 0.1%, 1%, and 5% levels, respectively.
Compared with the complete network, factional network structure is positively associated with adaptability after natural hazards in EACM, with 5-year adaptability experiencing the largest positive impact. Specifically, 5-year adaptability after natural hazards has fully recovered in areas with factional networks. In comparison, the factional network has negligible influence on adaptability in CEPM. The results reject our hypothesis that the factional network exhibits low adaptability.
A coalitional network significantly promotes adaptability in both industries and across different periods in comparison to the complete network. The most significant influence occurs 5 years after natural hazards in both industries. Specifically, every 1% increase in million-dollar damage is associated with an additional 2% increase in 5-year adaptability in both CEPM and EACM, compared with a complete network. It indicates that network structure has a long-term influence on reshaping regional industries. It is sensible that developing a new growth path takes time, and network structures’ moderating effects between natural hazards and adaptability peak 5 years after the natural hazards. The results verify our hypothesis that the coalitional network sees high adaptability within the four network structures.
A bridging network witnesses larger adaptability than a complete network. In CEPM, the difference between bridging and complete networks is statistically significant 3 and 5 years after natural hazards, whereas, in EACM, the differentiating influence between bridging and complete networks is positive but statistically insignificant. Five years after natural hazards witnesses a 2% increase in adaptability in CEPM, compared with the complete network. The positive moderating influence of a bridging network is as strong as that of a coalitional network, which verifies our hypothesis that a bridging network presents high adaptability. Overall, our hypotheses that coalitional and bridging networks see high adaptability and factional and complete networks exhibit low adaptability are verified.
Sensitivity Analyses
To examine whether the results are robust, we conducted the following sensitivity analyses. First, we focused on CBSAs that only experienced one natural hazard and those that hadn’t experienced any natural hazards. Our study period is from 1994 to 2008. We restrain to the samples that no natural hazards existed from 1990 to 1993 and from 2009 to 2012. This analysis minimizes the influence of historical natural hazards and focuses on the resilience after a single hazard. The results of CEPM are partially consistent with our primary findings, indicating that complete networks demonstrate superior adaptation and adaptability than factional and coalitional networks (Table A1 in the supplementary online appendix). It might be because complete networks are more advantageous in safe places and places suffering from one-time rare shocks, whereas coalitional networks are superior in CBSAs under multiple shocks. Meanwhile, we find that the coefficient of interaction between hazards and bridging network drops out due to the small number of unique values among the observations.
Second, to account for the large CBSA bias (Wassmer, 2021), we adopted the natural logarithm of damage per capita to account for the population effect. The results are consistent with our main results (see Tables A2 and A3 in the supplementary online appendix). That is, a complete network presents a better adaptation than other types of networks, whereas a coalitional network performs the best in adaptability.
Third, we adopted spatial error model (SEM) regression to account for the spatial spillover effect. When a CBSA suffers from natural hazards, the neighboring CBSAs might be affected due to geographically proximate supply chains. SEM assumes that the error term is spatially correlated. We used the inverse of the distance between each pair of CBSAs to construct the spatial variance-covariance matrix to account for the spatial correlation of CBSAs. The regression involves a spatial matrix of 22,000*22,000, which requires a large amount of computing resources. To make the calculation practically feasible, we split the data into 10 subsamples using an interval of a decade, which include: 1) 1990, 2000, 2010; 2) 1991, 2001, 2011; 3) 1992, 2002, 2012; 4) 1993, 2003; 5) 1994, 2004; 6) 1995, 2005; 7) 1996, 2006; 8) 1997, 2007; 9) 1998, 2008; 10) 1999, 2009. We ran 20 SEM regressions for the 10 subsamples of CEPM and EACM industries, respectively. The results are mostly consistent with our main results (see Tables A4 and A5 in the supplementary online appendix). Specifically, the 10 results are all consistent with the main results within the 10 subsamples of EACM. Coalitional and bridging networks perform worse than a complete network in adaptation, whereas a complete network is weaker in adaptability than a coalitional network. Regarding CEPM, 6 out of 10 are consistent with the main results. That is, a complete network presents the strongest adaptation, whereas a coalitional network embraces stronger adaptability. Three out of 10 results are statistically insignificant, and the remaining one (i.e., 1995 and 2005 group) shows a different result.
Fourth, we added a recession dummy variable to reflect whether the state GDP per capita grows or declines. The outcomes are consistent with the main results (Tables A6 and A7 in the supplementary online appendix). A complete network exhibits greater adaptation than the other three types of networks in CEPM and EACM, whereas a coalitional network outperforms a complete network in adaptability.
Fifth, we changed the threshold for identifying high adaptation and high adaptability. Originally, we used the median value to separate adaptation and adaptability into the high and low categories. To check for sensitivity to this specific threshold, we changed the threshold for high adaptation and adaptability to the 75th percentile and that for low adaptation and adaptability to the 25th percentile. The results are shown in supplementary online appendix Table A8. A fractional network exhibits lower adaptation than a complete network, while the coefficients for coalitional and bridging networks cannot be reliably estimated due to the small number of observations. Next, we tried the threshold of above 60% as high and less than 40% as low (Table A9 in the supplementary online appendix). We find that the coefficient of interactions between natural hazards’ damage and bridging network drops out due to a small number of observations, whereas the coefficients of interactions between coalitional and factional networks are not statistically significant.
Sixth, hazards occurring immediately prior to 1990—the start of the study period—may bias the results. We excluded areas that suffered from identified natural hazards in 1989; the results are shown in Tables A10 and A11 in the supplementary online appendix. The results are consistent with our main results. A complete network exhibits greater adaptation in CEPM and EACM, and a coalitional network performs better in adaptability.
Seventh, larger firms may enhance regional economic resilience through their own internal network. Though we don’t have data on large firms’ internal networks, we collected employment and establishment numbers from the BLS to control for firm size in CBSAs. We calculated the average employment number per establishment each quarter for each CBSA in CEPM and EACM, respectively. We added average firm size as a control variable in the regression (the results are shown in Tables A12 and A13 in the supplementary online appendix). The results are consistent with our main results. A complete network has better adaptation than the other three types of networks in CEPM and EACM, whereas a coalitional network outperforms a complete network in adaptability.
Eighth, we changed the measurement of adaptation to test sensitivity. We used the average change of location quotients of all industries in CEPM and EACM before and after hazards to measure adaptation. The results are shown in Tables A14 and A15 in the supplementary online appendix. A complete network witnesses better adaptation than factional and coalitional networks, whereas coalitional and bridging networks present better performance than a complete network in adaptability.
Ninth, we filtered CBSAs that own industries with a location quotient of more than 1.2 in at least one quarter during the study period to run regressions. The CEPM results are shown in supplementary online appendix Table A16 and are consistent with our main results.
Additionally, to account for the recovery of previous natural hazards, we changed the measurement of natural hazards by making the influence of previous natural hazards depreciate 10% per year (Table A17 in the supplementary online appendix). The results are consistent with our main results. A complete network exhibits better adaptation than the other three types of networks, whereas the coalitional network shows better adaptability than the complete network.
Conclusion
The innovation-collaboration network structure is an important indicator of the innovation industry's economic resilience. Prior studies fail to consider the two dimensions of economic resilience simultaneously, and primarily focus on European contexts. Our paper addresses the gaps by adopting social network analysis to capture the role of network structure and examine the influence on two dimensions of economic resilience in U.S. CBSAs. Using natural hazards causing more than $100 million in direct property damage per incident as examples, we found that a complete network most promotes adaptation, whereas a coalitional network contributes to adaptability. The results are consistent across four time periods and two innovative industries. The results take the lens of network structure and add to the findings of a trade-off relationship between adaptation and adaptability in Martin and Sunley (2006). We find that a complete network structure embraces high adaptation but lower adaptability, whereas a coalitional network owns low adaptation but high adaptability. Furthermore, our findings complete recent efforts to examine network robustness and economic resilience in the European context (Tóth et al., 2022). We go beyond network robustness and operationalize four types of network typologies. Also, we examined economic resilience in a more detailed dimension, dividing it into adaptation and adaptability.
Policy makers could prioritize different network typologies based on the place-based industrial contexts. Policy can promote adaptability and bridging networks when the traditional industry is no longer competitive due to its resource depletion, competitive disadvantage in the global market, or technological obsolescence (Fornahl et al., 2012; Hu & Hassink, 2017). In contrast, adaptation and bonding networks can be supported when the existing industries possess capabilities that are still competitive in the broader economic context. Innovation policies can be designed to strategically foster a certain type of collaboration to promote adaptation or adaptability. For example, the U.S. Economic Development Administration has initiated the Planning and Local Technical Assistance Program to promote regional economic prosperity and resiliency (U.S. Economic Development Administration, 2023). Local governments could utilize these funds to facilitate the construction of a bridging network by establishing regional coalitions and organizing workshops and networking events, which could connect high-tech companies, research institutes, knowledge workers, entrepreneurs, and other related entities to form new collaborations. Such events can be inclusive and encourage interested organizations or individuals. Meanwhile, local governments could work together to create online forums for exchanging information and matching collaborative interests, thus facilitating new regional collaborations. Besides, creating public open spaces and amenities for entrepreneurs and creative classes to interact and network can promote the formation of new collaborations. To strengthen the bonding network, local governments could dedicate funds to encourage long-term and in-depth collaboration by organizing frequent in-person events to create a dense sense of community. Such events could be invitation-only and target key stakeholders.
Industries are heterogeneous. This study focuses on CEPM and EACM, both of which are innovative industries. The results may apply to similar high-tech industries where innovation plays a more significant role in influencing economic resilience. In terms of the service industry and traditional manufacturing industries where innovation plays a negligible role, the influence of co-patenting network structure may be small or insignificant. Nonetheless, the same methodology can be applied to analyze other network structures and potentially aid industrial policies.
Supplemental Material
sj-docx-1-edq-10.1177_08912424241287776 - Supplemental material for How Does Innovation-Collaboration Network Structure Influence Regional Economic Resilience?
Supplemental material, sj-docx-1-edq-10.1177_08912424241287776 for How Does Innovation-Collaboration Network Structure Influence Regional Economic Resilience? by Yijia Wen and Li Fang in Economic Development Quarterly
Footnotes
Acknowledgements
We thank the reviewers and editor for their insightful comments on the manuscript. We appreciate helpful comments from the faculty and students at Florida State University, particularly Karina Amalbert.
Declaration of Conflicting Interests
The authors declared no potential conflicts of interest with respect to the research, authorship, and/or publication of this article.
Funding
The authors received no financial support for the research, authorship, and/or publication of this article.
Supplemental Material
Supplemental material for this article is available online.
Author Biographies
References
Supplementary Material
Please find the following supplemental material available below.
For Open Access articles published under a Creative Commons License, all supplemental material carries the same license as the article it is associated with.
For non-Open Access articles published, all supplemental material carries a non-exclusive license, and permission requests for re-use of supplemental material or any part of supplemental material shall be sent directly to the copyright owner as specified in the copyright notice associated with the article.