
Abstract
Purpose:
Despite appropriate preoperative evaluation, some patients are diagnosed with clinically significant prostate cancer after Holmium laser enucleation of the prostate. Postoperative screening is challenging due to unreliable thresholds and nomograms. We developed a preoperative nomogram to predict clinically significant prostate cancer and a postoperative decision matrix for risk stratification. The secondary aim was to validate existing risk calculators.
Materials and Methods:
A retrospective cohort of 857 patients was analyzed, of whom 773 were eligible. The primary outcome was the detection of clinically significant prostate cancer (csPCa) at 1 year postoperatively. A multivariate Cox regression analysis was performed. Performance was assessed with time-dependent receiver operating characteristic analysis, calibration plots, and decision curve analysis (DCA). Prostate Cancer Prevention Trial 2.0 and Memorial Sloan Kettering Cancer Center calculators were validated in 100 randomly selected patients. Postoperative surveillance used nadir prostate-specific antigen (PSA) and prostate-specific antigen reduction ratio (PRR).
Results:
csPCa was identified in 30 patients (3.9%). Independent predictors were age (hazard ratio [HR] 1.08, p = 0.001), PSA density (HR 1.54, p = 0.003), and family history (HR 5.62, p = 0.007). The area under the curve was 0.71 at 1 year for the preoperative model. DCA showed clinical utility above 5%. Standard calculators overpredicted risk (8.8% and 38.2% vs observed 2%). For postoperative surveillance, nadir PSA 1 ng/mL and PRR 50% cutoffs had negative predictive value of 97.9% and 98.4%, respectively.
Conclusions:
We developed a preoperative nomogram for predicting csPCa within 1 year postoperatively. The postoperative surveillance decision matrix enables risk-adapted follow up.
Introduction
Holmium laser enucleation of the prostate (HoLEP) is a size-independent surgical treatment for benign prostatic hyperplasia (BPH) that is primarily performed to relieve bladder outlet obstruction.1,2 The reported incidence of incidental prostate cancer (iPCa) following HoLEP varies widely, ranging from 5.6% to 23.3% in the literature.1,3 Several studies have identified older age, higher prostate specific antigen (PSA) density, smaller prostate volume, and prior prostate biopsy status as predictors of iPCa following HoLEP. 4 Notably, nearly three-quarters of iPCa detected after HoLEP are Grade Group 1, low-risk tumors. 4
Detection of clinically significant prostate cancer (csPCa) in the post-HoLEP setting presents unique challenges. Removal of adenomatous tissue leads to a substantial reduction in PSA levels, rendering traditional PSA thresholds less reliable for postoperative surveillance. 5 Moreover, currently available prostate cancer risk calculators, including the Prostate Cancer Prevention Trial (PCPT) risk calculator (2006) and the Memorial Sloan Kettering Cancer Center risk calculator, were developed to predict biopsy-detectable prostate cancer in surgically untreated populations. These models do not account for transition zone tissue removal, nor do they predict incidental cancers identified on histopathologic examination following BPH surgery.
No validated risk stratification tool exists for assessing the risk of csPCa in men after HoLEP. Given that most men undergoing HoLEP have already undergone PSA evaluation and, when indicated, additional diagnostic testing through a shared decision-making-driven process, we hypothesize that the risk of csPCa following HoLEP is substantially lower than that estimated by existing nomograms. Accordingly, there is a critical need for a dedicated pre- and post-HoLEP prediction model to guide surveillance intensity and identify patients who may benefit from closer follow-up, multiparametric Magnetic Resonance Imaging (MRI), or early biopsy.
With this background, the primary objective of this study was to develop and internally validate a preoperative prognostic nomogram to predict the risk of developing csPCa (Grade Group ≥ 2) for 1 year following HoLEP. Also, we aimed to use postoperative nadir PSA and PSA reduction ratio (PRR) to propose a Desai Sethi Urology Institute (DSUI) surveillance decision matrix. The secondary objective was to evaluate the performance of two common existing prostate cancer risk calculators, PCPT and Memorial Sloan Kettering Cancer Center (MSKCC), in the post-HoLEP population. We hypothesize that a nomogram calibrated specifically to the post-HoLEP setting will provide better risk stratification and support surveillance strategies in this unique patient population.
Materials and Methods
Study population
We conducted a retrospective analysis of 857 patients who underwent HoLEP from January 2019 to January 2025 (Fig. 1). The study was approved by our Institutional Review Board (20180511). All patients who underwent HoLEP had preoperative PSA estimation done. Inclusion criterion:
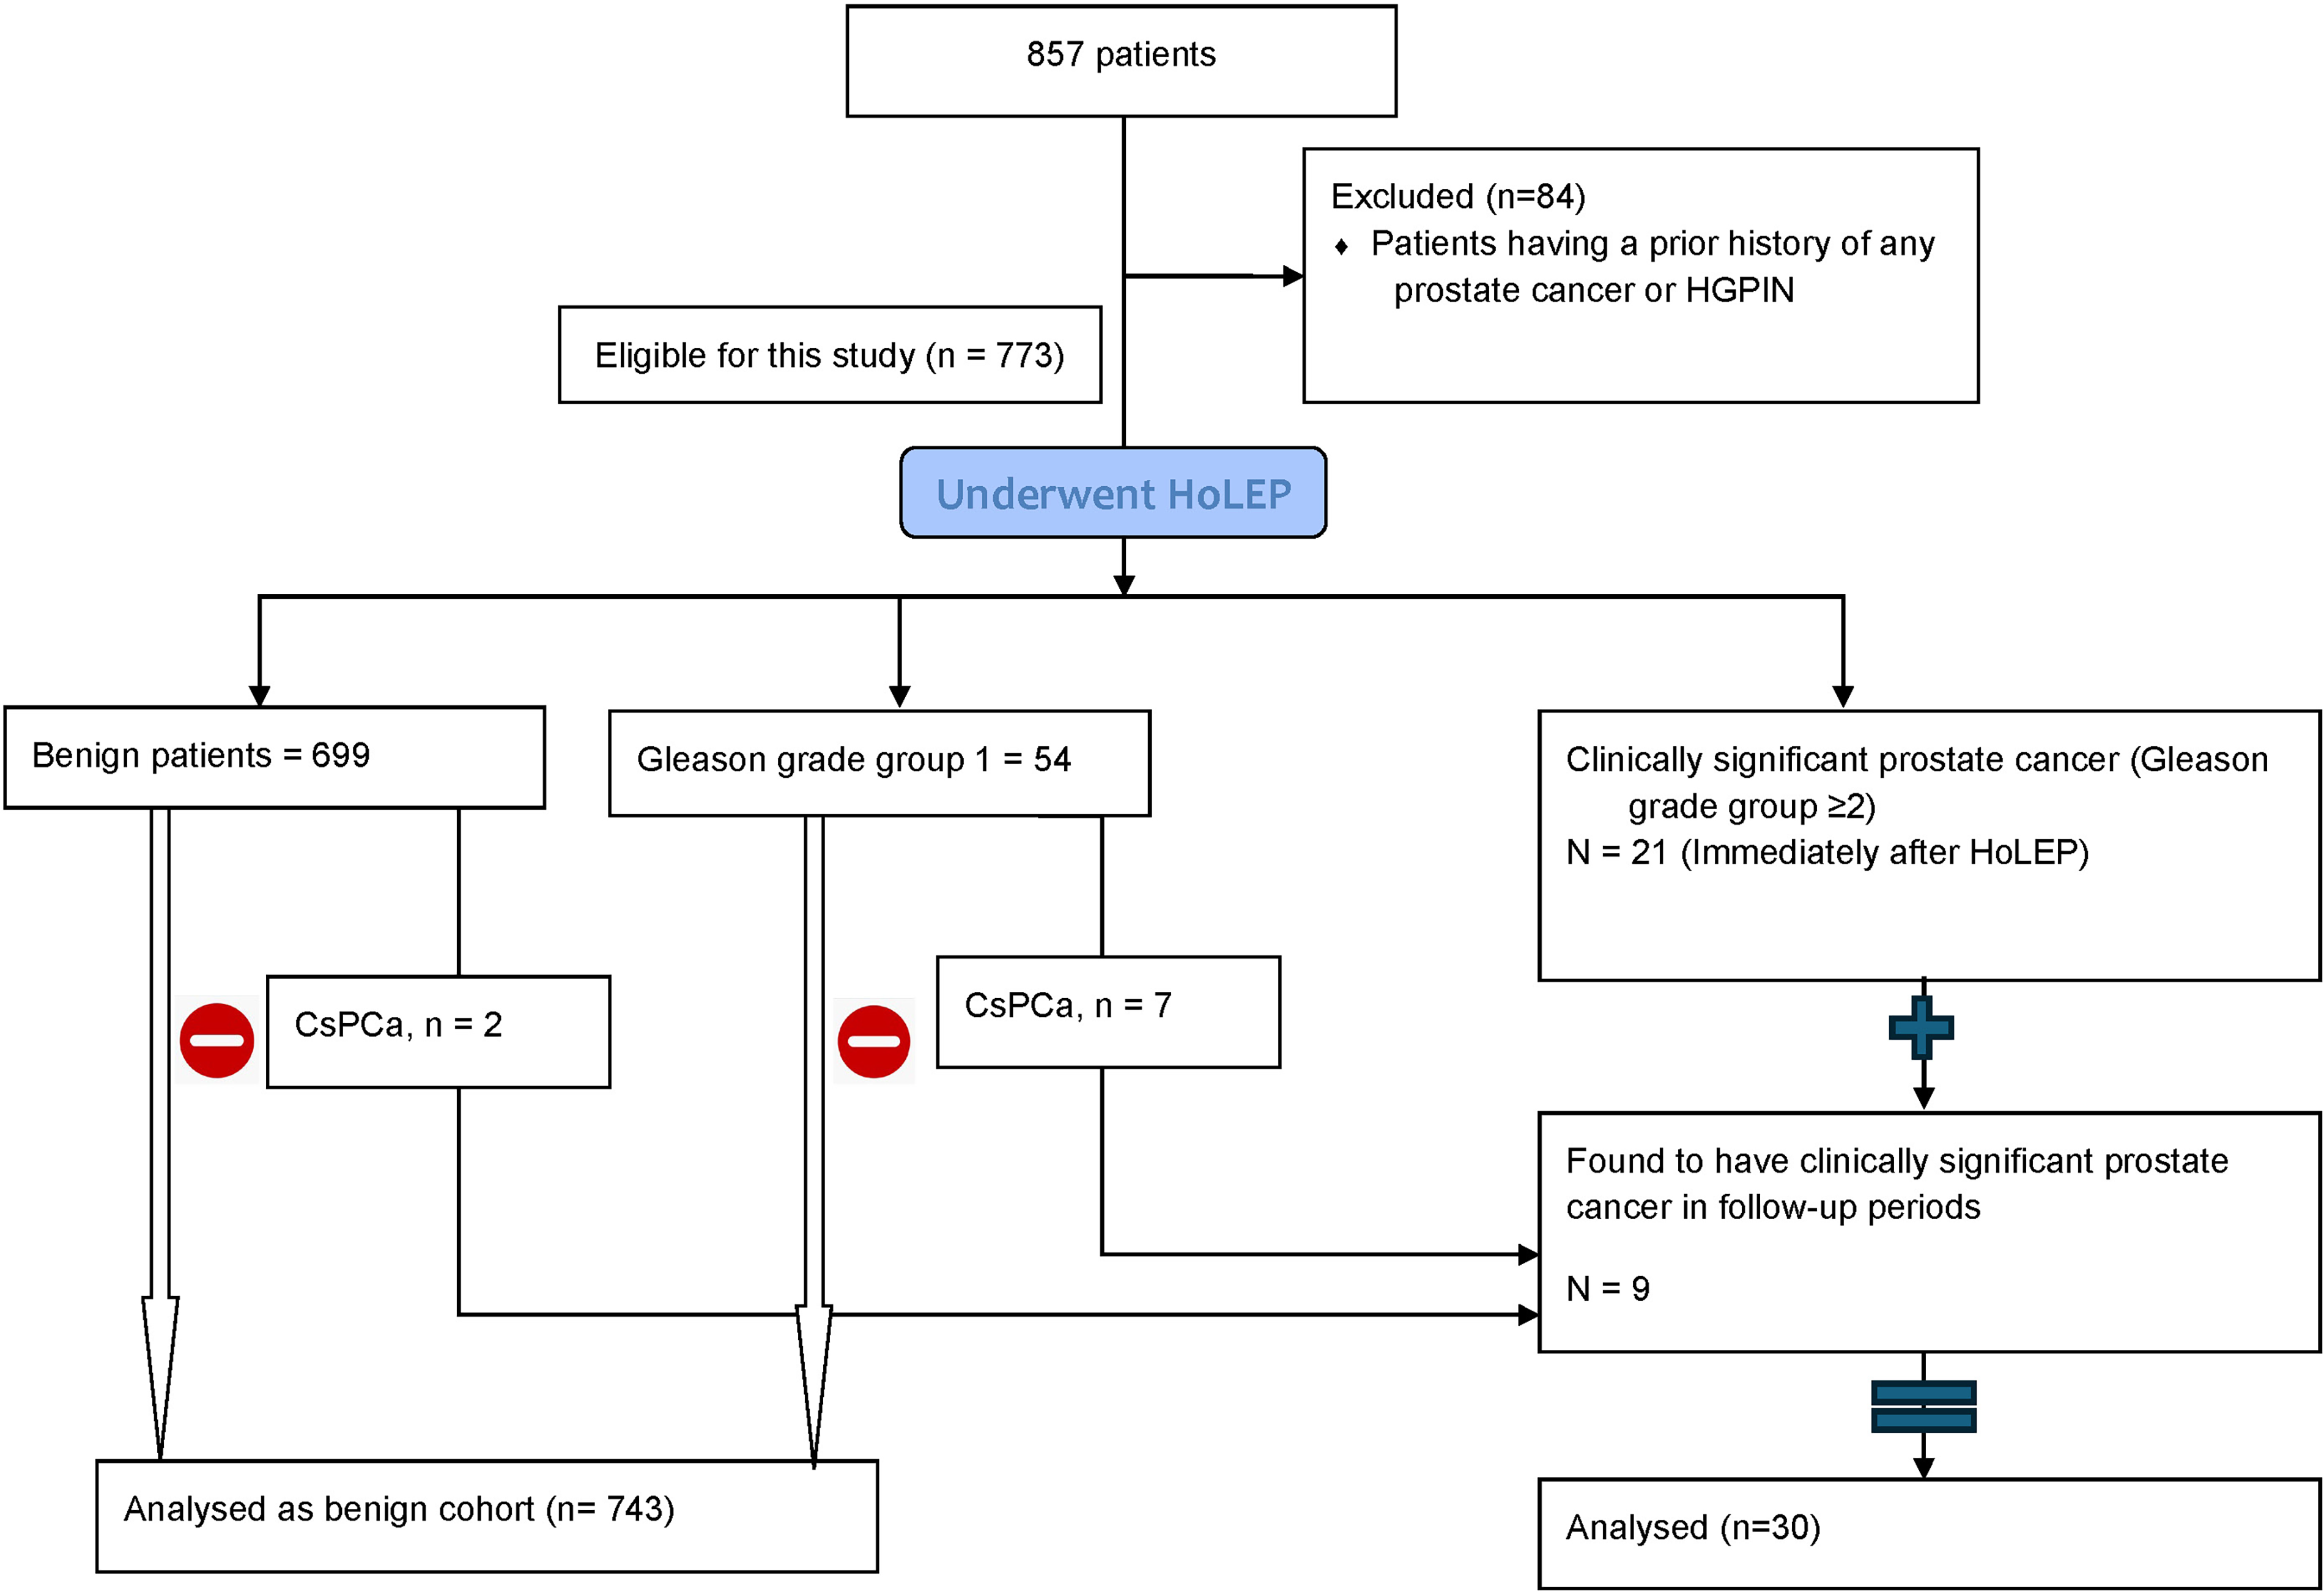
Study cohort diagram.
Patients undergoing HoLEP for presumed BPH
A preoperative clinical or histopathological diagnosis of benign disease.
Exclusion criterion:
Any preoperative diagnosis of prostate cancer (any grade) Presence of high-grade prostatic intraepithelial neoplasia on a prior biopsy.
Those with elevated PSA preoperatively underwent further evaluation with multiparametric MRI and/or prostate biopsy after engaging in an Shared Decision Making (SDM) process. Postoperatively the patients were followed up to monitor any development of prostate cancer after their surgery. All patients who were diagnosed with csPCa on histopathological evaluation of enucleated prostate tissue after HoLEP were counseled about various treatment options and managed accordingly. They were included in the final analysis. Those who had a diagnosis of BPH or low-risk prostate cancer (Grade group 1) on histopathological examination of the HoLEP specimen were included in the analysis and had a PSA estimation done at 3 months to look for the nadir level and then annually after that, after actively engaging in the SDM process. In this group, patients with PSA > 1 ng/mL during the follow-up period after HoLEP were offered further evaluation with multiparametric MRI and/or prostate biopsy after engaging in an SDM process with a goal of early detection of csPCa.
Outcomes
The primary objective was the detection of csPCa. csPCa was defined as a Gleason grade group ≥ 2 (Gleason score ≥3 + 4). Gleason grade group 1 was classified in the benign cohort during follow-up, as it typically represents indolent disease that does not require immediate intervention in the post-HoLEP follow-up. 6
Variables used
Preoperative variables included age, family history of prostate cancer, race, preoperative prostate size (measured on ultrasound or computerized scan or MRI when available), PSA, PSA density (PSAD), comorbidities (hypertension, diabetes mellitus, dyslipidemia), modified frailty index (mF-5), body mass index, prior prostate biopsy status, pre-HoLEP MRI, history of more than two BPH treatments, history of prior catheterization, and history of recurrent acute urinary retention. Postoperative variables used were PSA levels, MRI results, detection of any prostate cancer, and PSA nadir achieved in all cases at 3 months and further PSA trend, follow-up months, and follow-up in patients with grade group 1 prostate cancer.
Formation of the model, the nomogram, and statistical analysis
Baseline characteristics were compared using the Mann–Whitney U test for non-normal distribution for continuous variables and the chi-square/Fisher’s exact test for categorical variables.
A multivariate Cox regression model was used for time-to-event analysis and prediction of csPCa. Variables were selected for final nomogram formation based on statistical significance in the Cox regression model and clinical significance. Discrimination ability was checked with receiver operating characteristics (ROC) area under the curve (AUC). Calibration plots were generated to visualize the agreement between observed and expected risk. Decision curve analysis (DCA) was performed to evaluate the net clinical benefit of the 1-year model.
Comparison with standard screening tools
The PCPT 2.0 risk calculator and the MSKCC risk of high-grade cancer on prostate biopsy calculator were applied to 100 randomly selected patients (12.9%) to compare predicted vs observed probability of high-risk prostate cancer.
Post HoLEP longitudinal PSA kinetics, the novel PSA reduction ratio, and the decision matrix
We introduced PSA reduction ratio (PRR) calculated as PRR = (preoperative PSA—postoperative nadir)/preoperative PSA × 100. This normalizes the drop relative to baseline PSA. We compared these between the csPCa and the benign patient cohort and created a surveillance decision matrix. To calculate the cut-offs for nadir PSA and PRR, we used the Youden index. 7 Diagnostic performance was evaluated based on sensitivity (Sn) and specificity (Sp).
Statistical analysis was performed using SPSS (Version 31, IBM Corp., Armonk, NY) and R (RStudio version 3) with the rms, survival, timeROC, and dcurves packages. A p-value of < 0.05 was considered significant.
Results
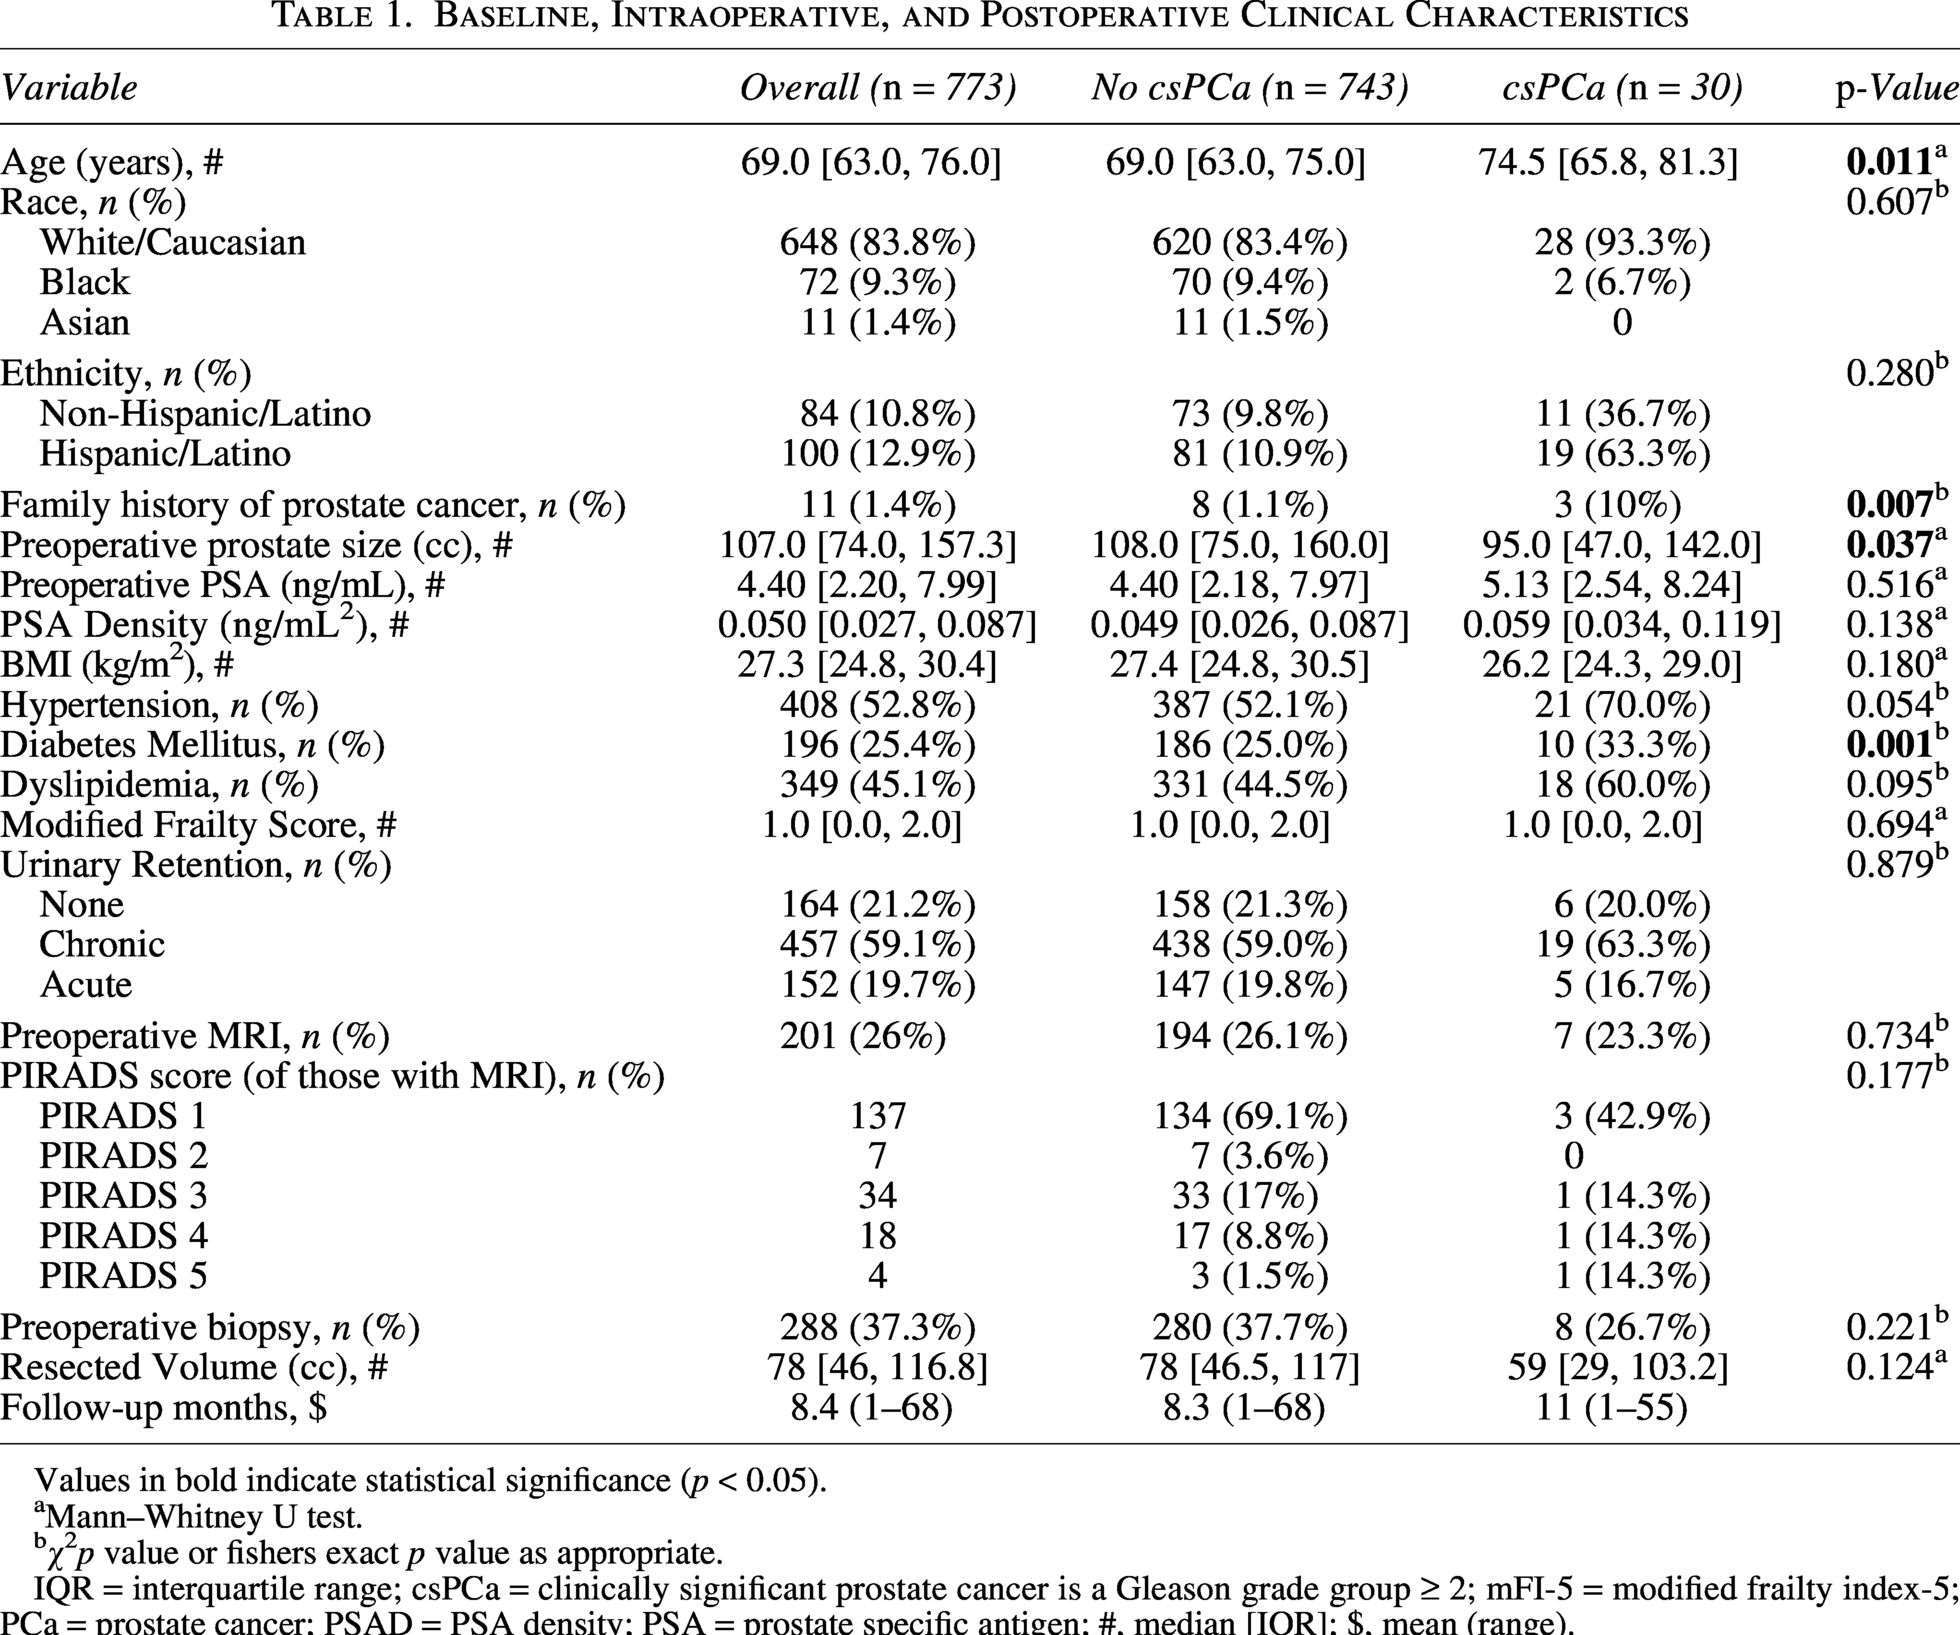
The final cohort included 773 patients who underwent HoLEP. During the follow-up period, 30 (3.9%) patients developed csPCa (Grade group ≥ 2). Of these, 21 patients (2.7%) were found to have csPCa immediately postoperatively, and 9 patients (1.2%) were diagnosed during follow-up. There was a total of 53 patients (6.8%) with grade group 1 prostate cancer in the benign cohort. The baseline, intraoperative, and follow-up characteristics, as well as the univariate analysis, are summarized in Table 1.
Baseline, Intraoperative, and Postoperative Clinical Characteristics
Values in bold indicate statistical significance (p < 0.05).
Mann–Whitney U test.
χ2p value or fishers exact p value as appropriate.
IQR = interquartile range; csPCa = clinically significant prostate cancer is a Gleason grade group ≥ 2; mFI-5 = modified frailty index-5; PCa = prostate cancer; PSAD = PSA density; PSA = prostate specific antigen; #, median [IQR]; $, mean (range).
Patients with csPca were significantly older (median age 74.5 years vs 69.0 years, p = 0.011). A family history of prostate cancer was present in 10% of the csPCa group as compared to 1.1% in the benign group (p = 0.007). Regarding comorbidities, diabetes mellitus had a higher prevalence in the csPCa group (p = 0.001), but this association was not found in multivariate analysis. Preoperative prostate size was significantly smaller in the csPCa group (median 95 cc vs 108 cc, p = 0.037). Furthermore, patients with csPCa had higher baseline PSA (median 5.13 ng/mL vs 4.40 ng/mL) and higher baseline PSAD (median 0.059 ng/mL 2 vs 0.049 ng/mL2), although neither was statistically significant. Preoperative utilization of multiparametric MRI (23.3% vs 26.1%; p = 0.734) and preoperative prostate biopsy (26.7% vs 37.7%; p = 0.221) were similar between the two cohorts. The mean follow-up duration was 11 months (range 1–55) in patients with csPCa and 8.3 months (range 1–68) in the benign cohort. The shorter follow-up is attributable to the clinical protocol, in which patients diagnosed with csPCa underwent further definitive treatment and were not followed in this cohort, leading to earlier censoring.
Model development
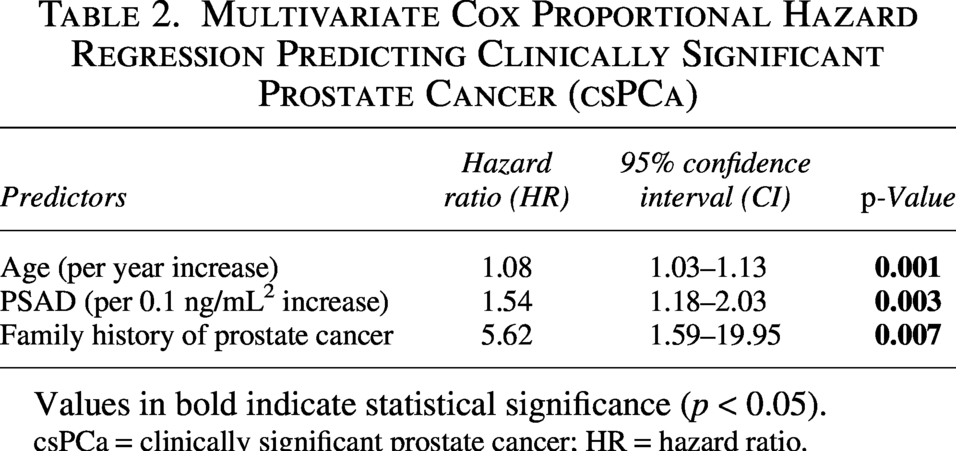
Multivariate Cox (Table 2) retained age (hazard ratio [HR] 1.08, 95% confidence interval [CI] 1.03–1.13, p = 0.001), family history of prostate cancer (HR 5.62, 95% CI 1.59–19.95, p = 0.007), and PSAD (HR 1.54 per 0.1 ng/mL2, 95% CI 1.18–2.03, p = 0.003) after addressing multicollinearity (PSA/Prostate volume/PSAD, Pearson r > 0.8). PSAD was the strongest predictor of malignancy using this model.
Multivariate Cox Proportional Hazard Regression Predicting Clinically Significant Prostate Cancer (csPCa)
Values in bold indicate statistical significance (p < 0.05).
csPCa = clinically significant prostate cancer; HR = hazard ratio.
The model demonstrated good discrimination (1-year AUC 0.71, Fig. 2). Based on the model, a nomogram was constructed using three predictors: age, PSA density, and family history of prostate cancer (Fig. 3). All variables showed a positive correlation.
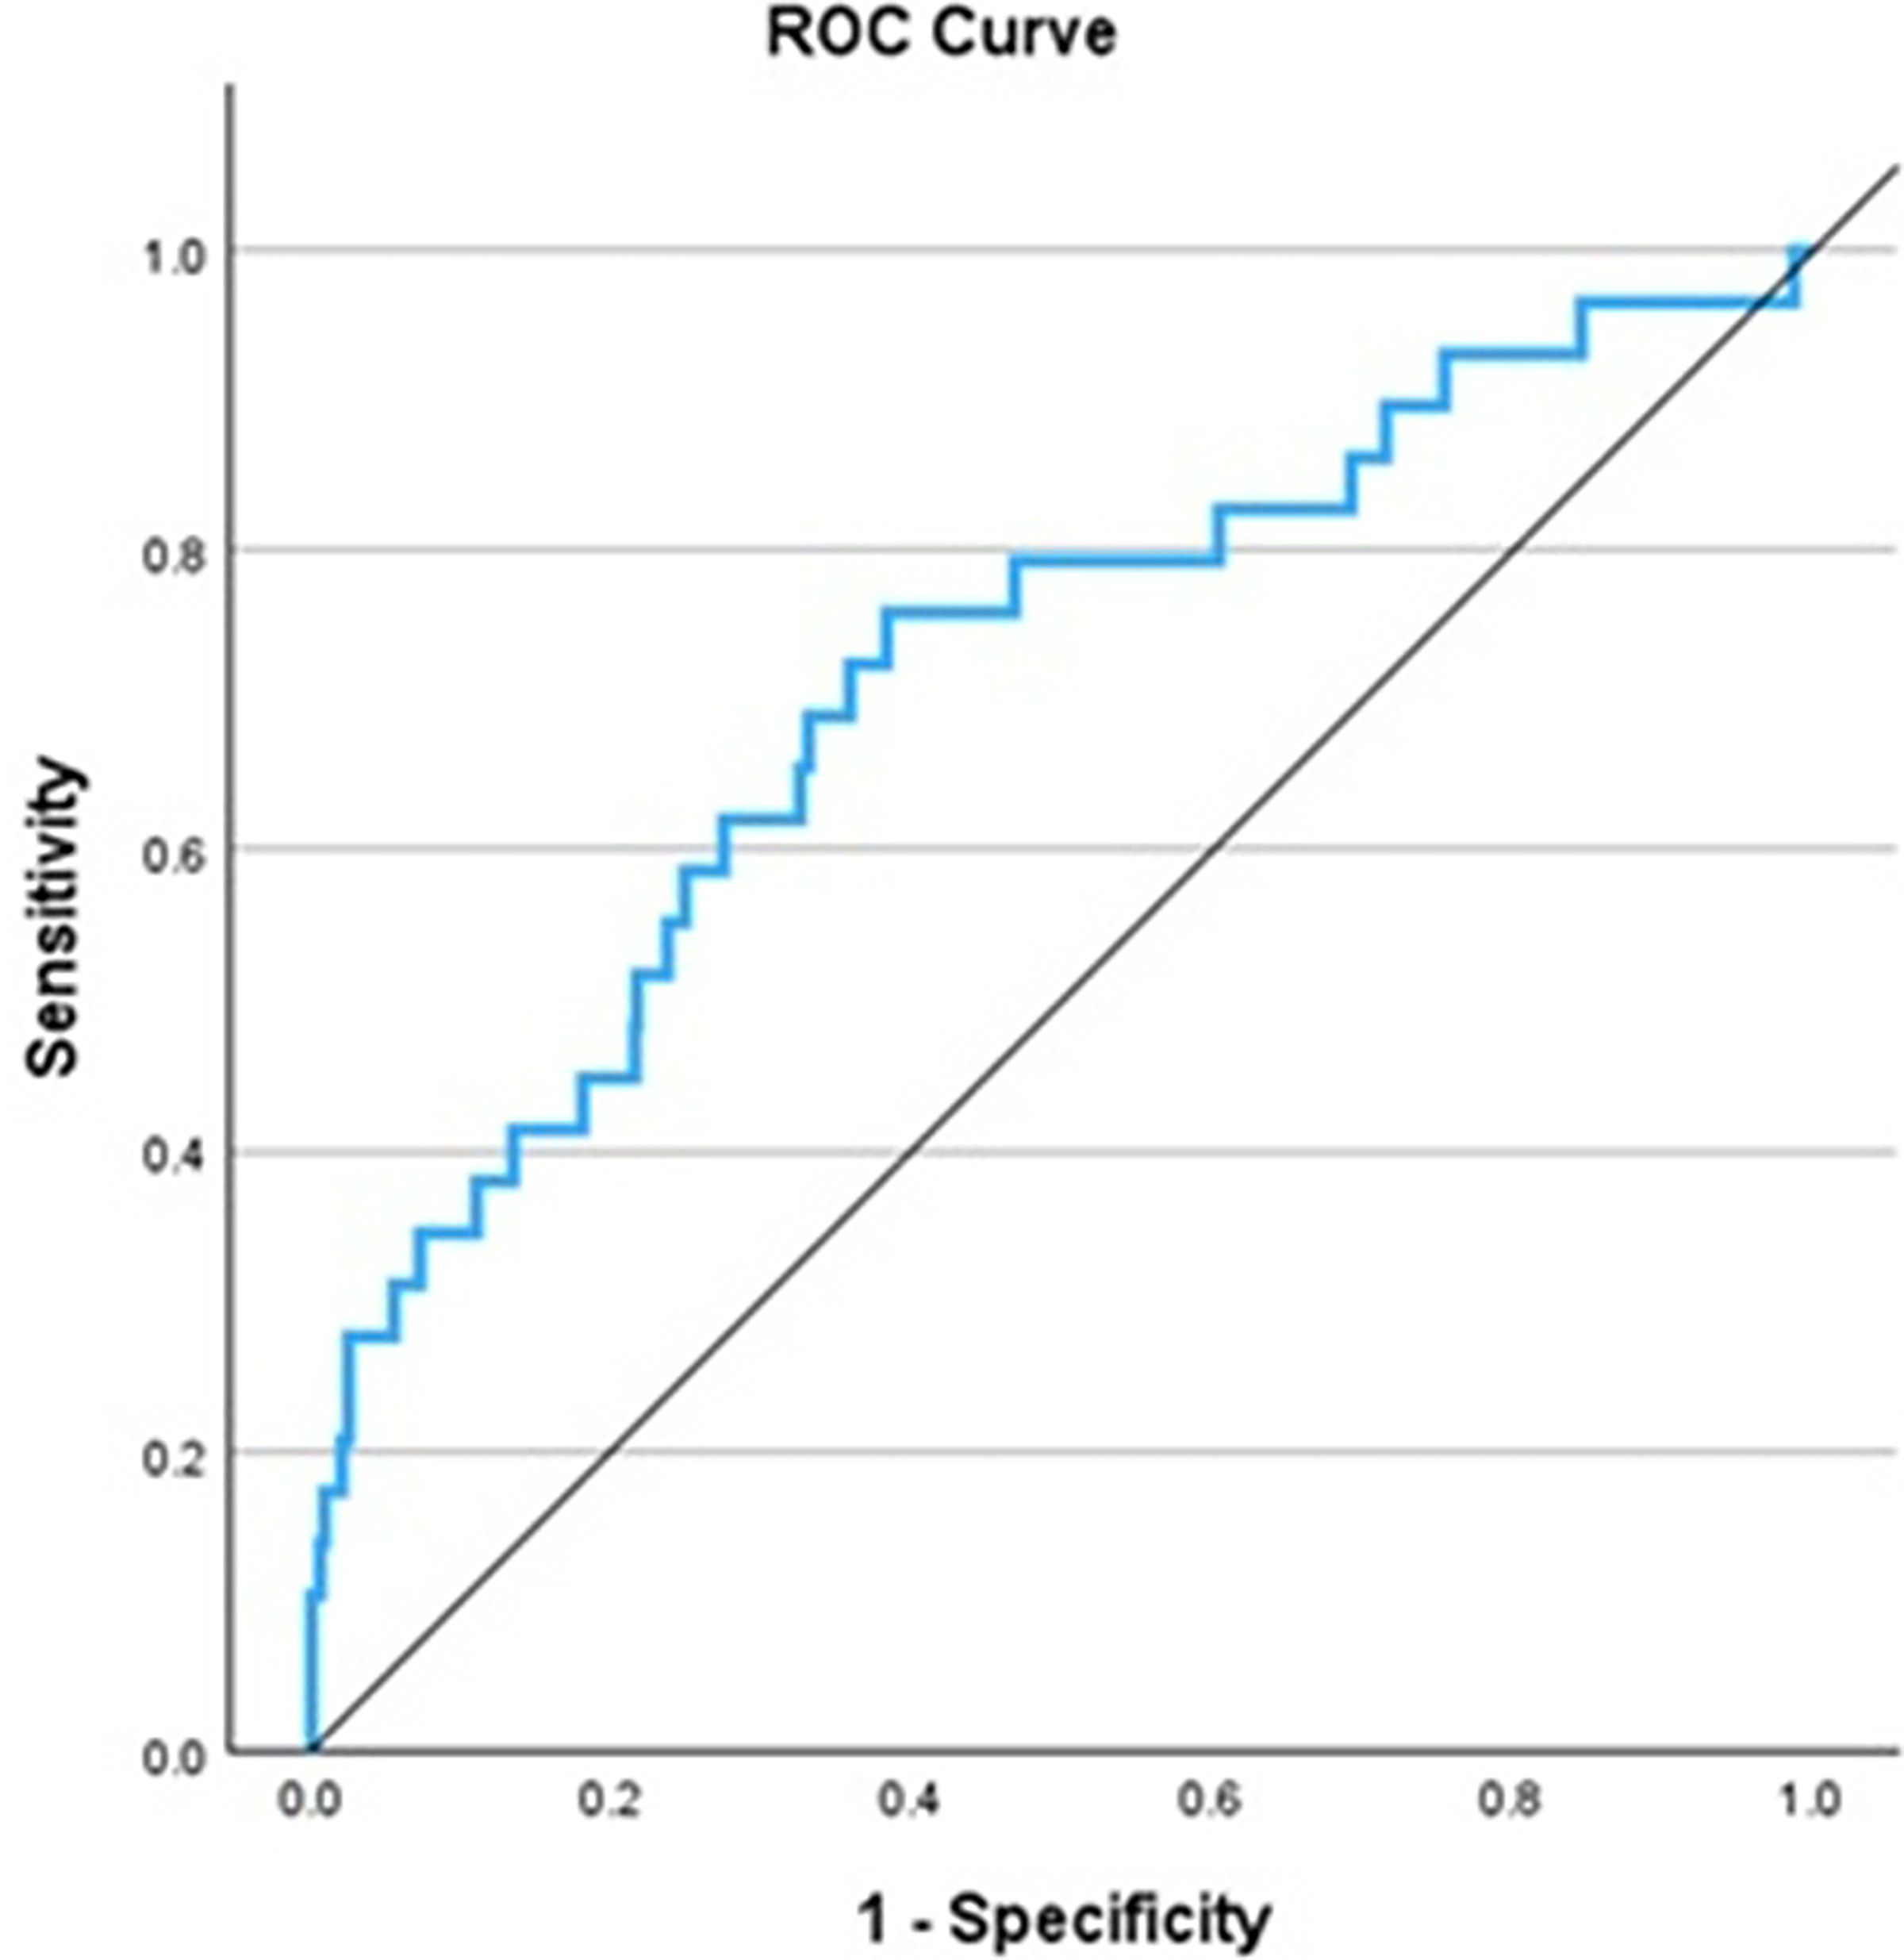
Time-dependent receiver operating characteristics analysis for the model to predict clinically significant prostate cancer.
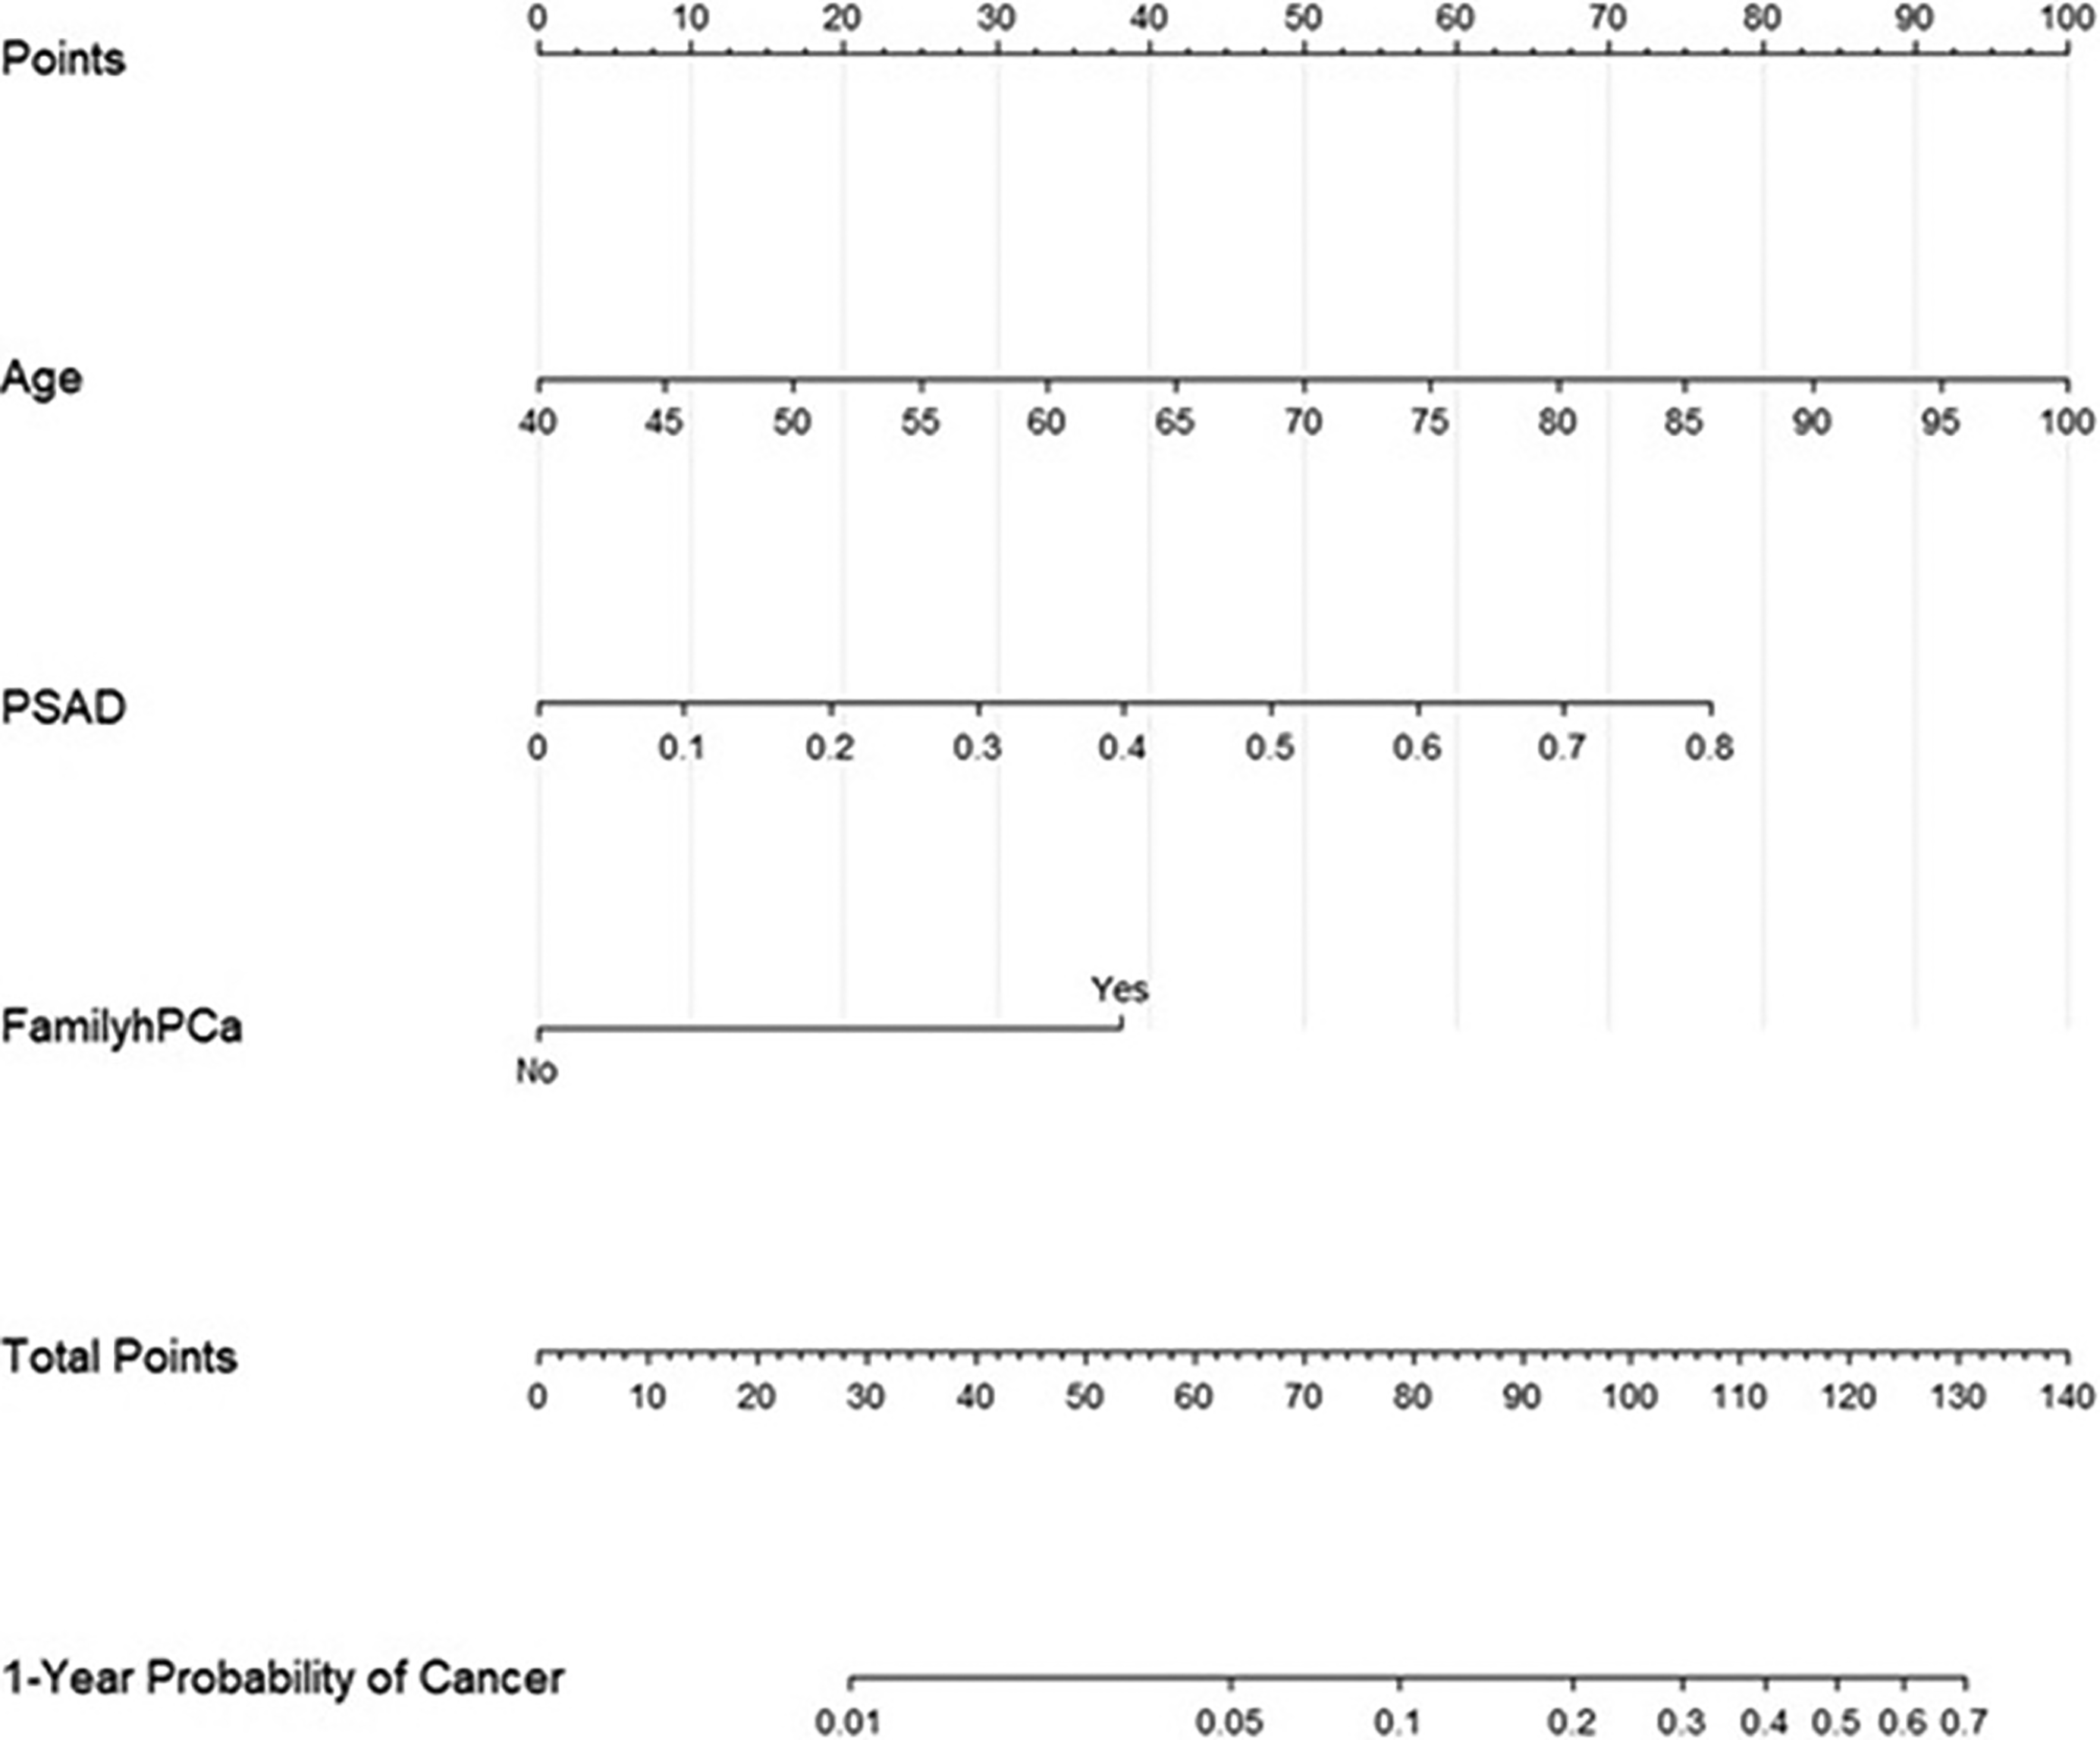
Nomogram to predict clinically significant prostate cancer post-HoLEP at 1 year. HoLEP = Holmium laser enucleation of the prostate.
Decision curve analysis and calibration
The DCA demonstrated high clinical utility for a decision threshold of 5% or higher. (Fig. 4) Calibration plots for 1 year demonstrated reliable risk estimates between predicted and observed outcomes. (Supplementary Figure S1).
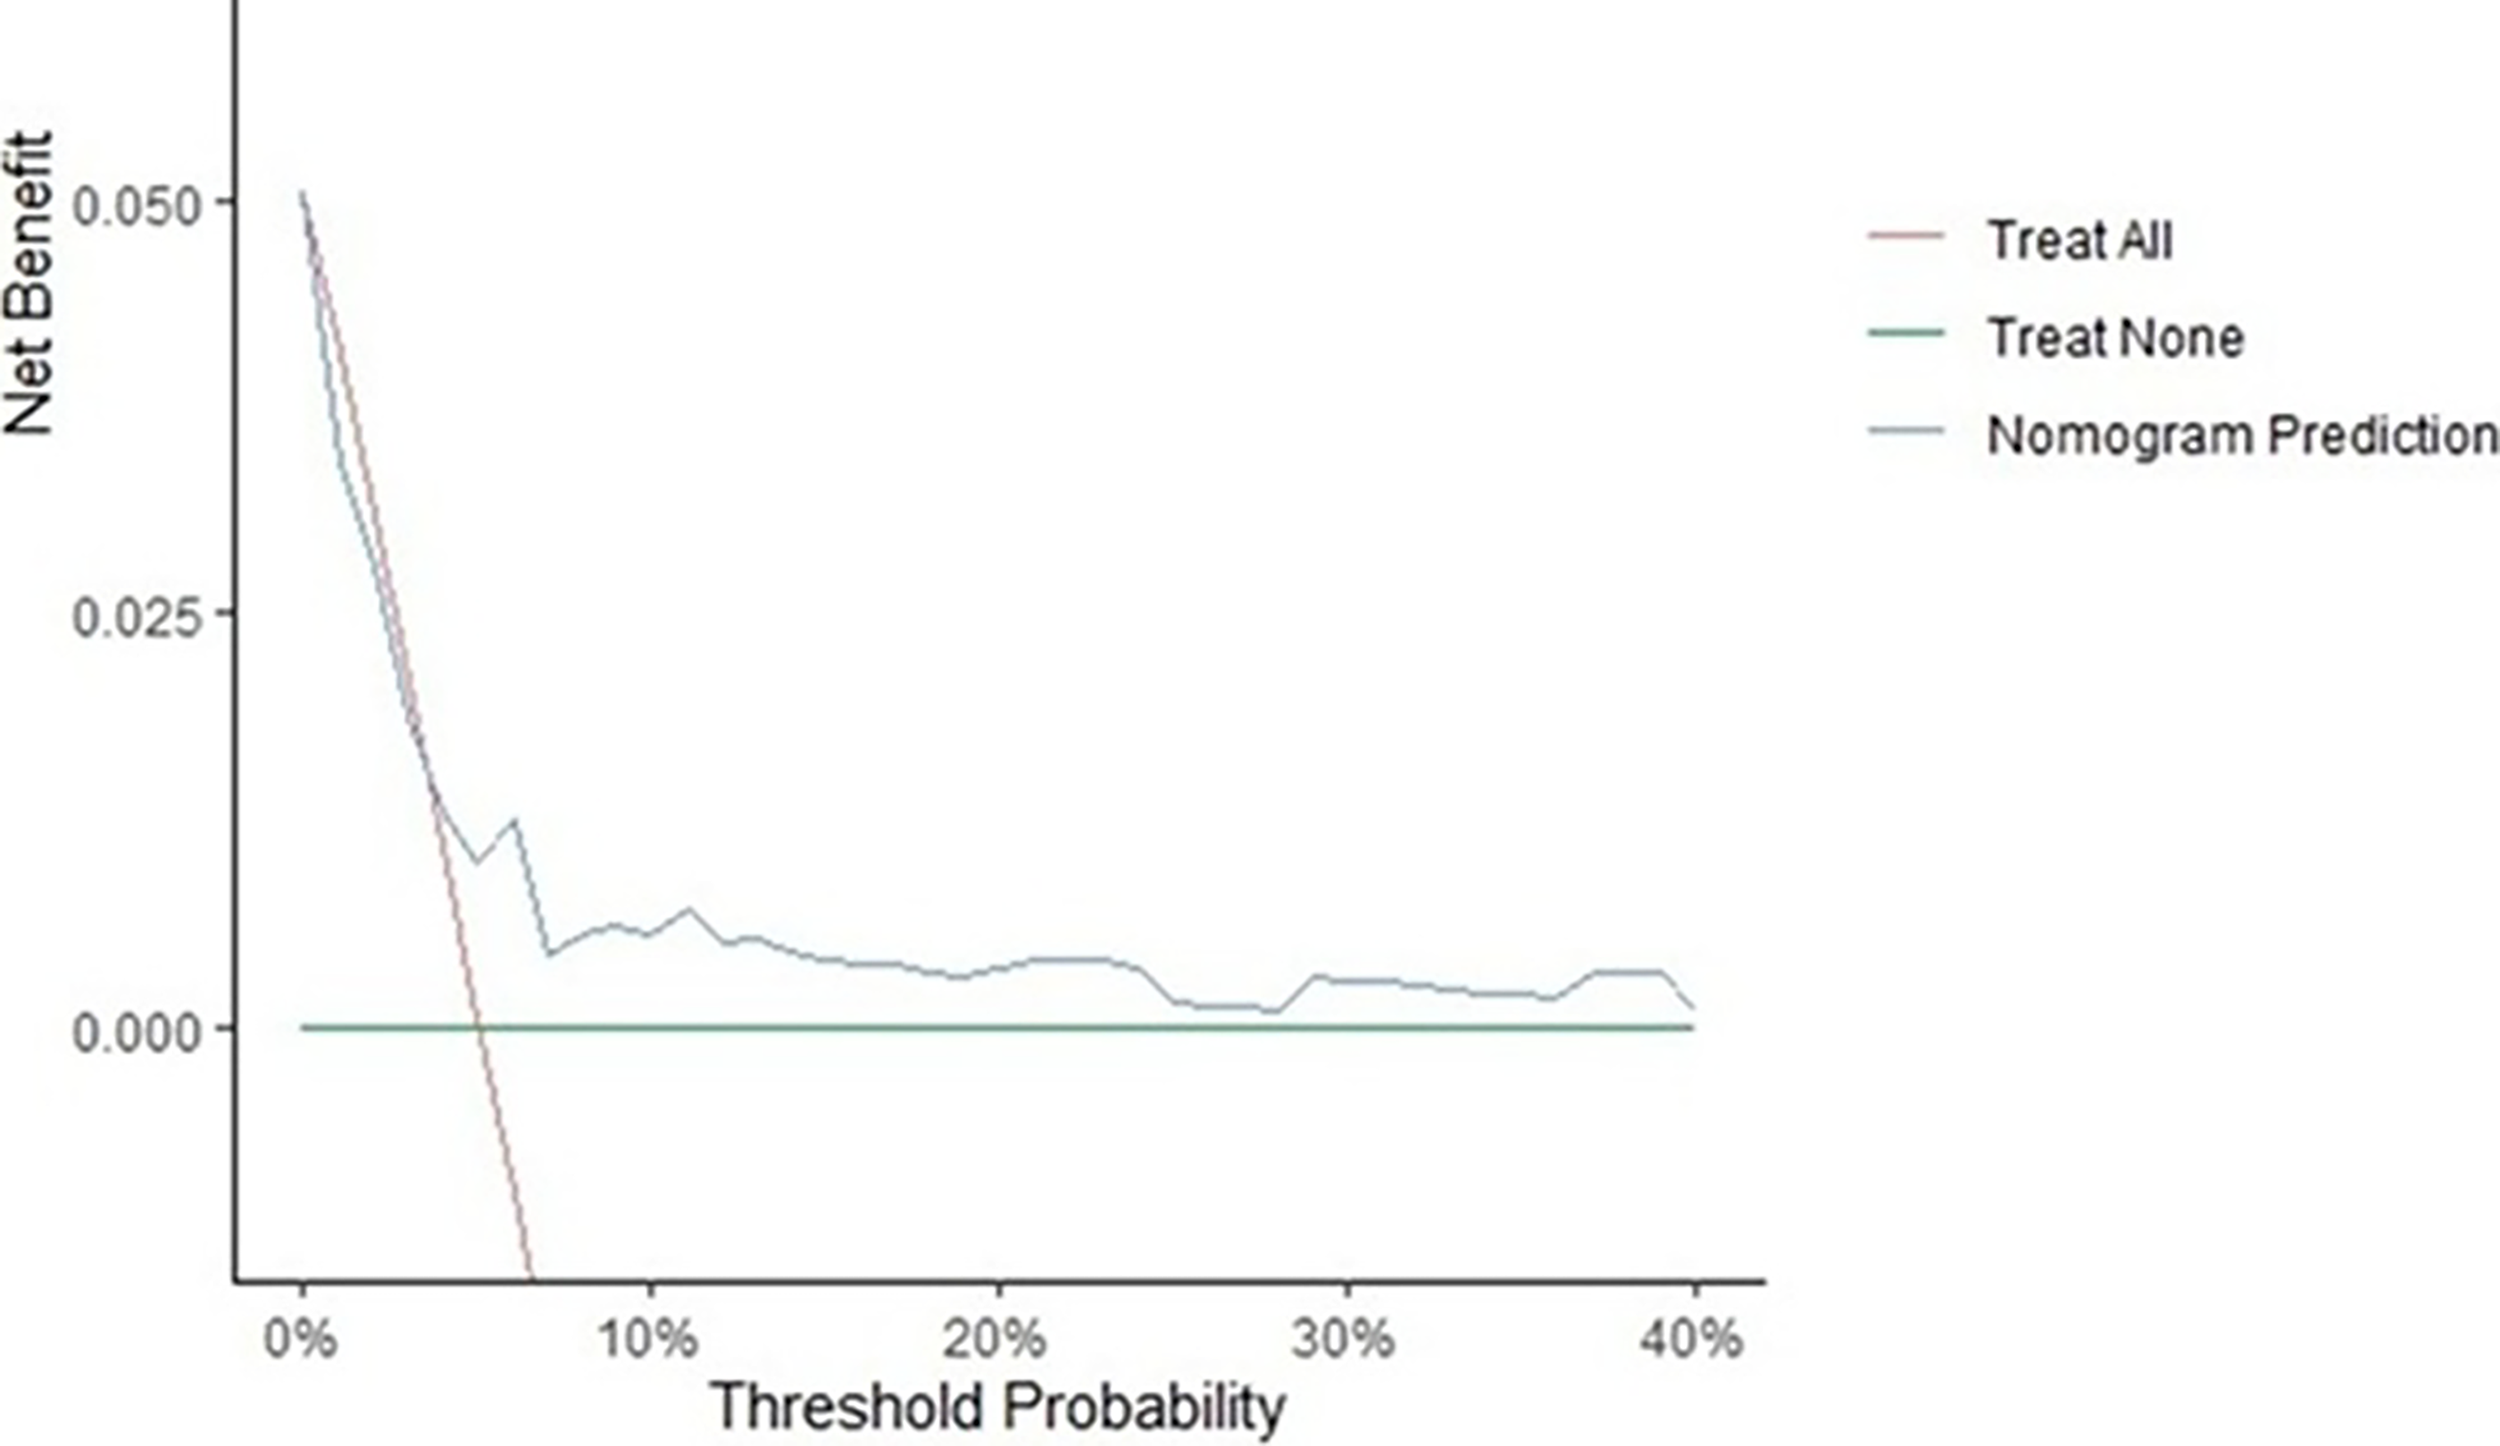
Decision curve analysis comparing the clinical utility of the 1-year.
Comparison with standard prostate cancer screening tools
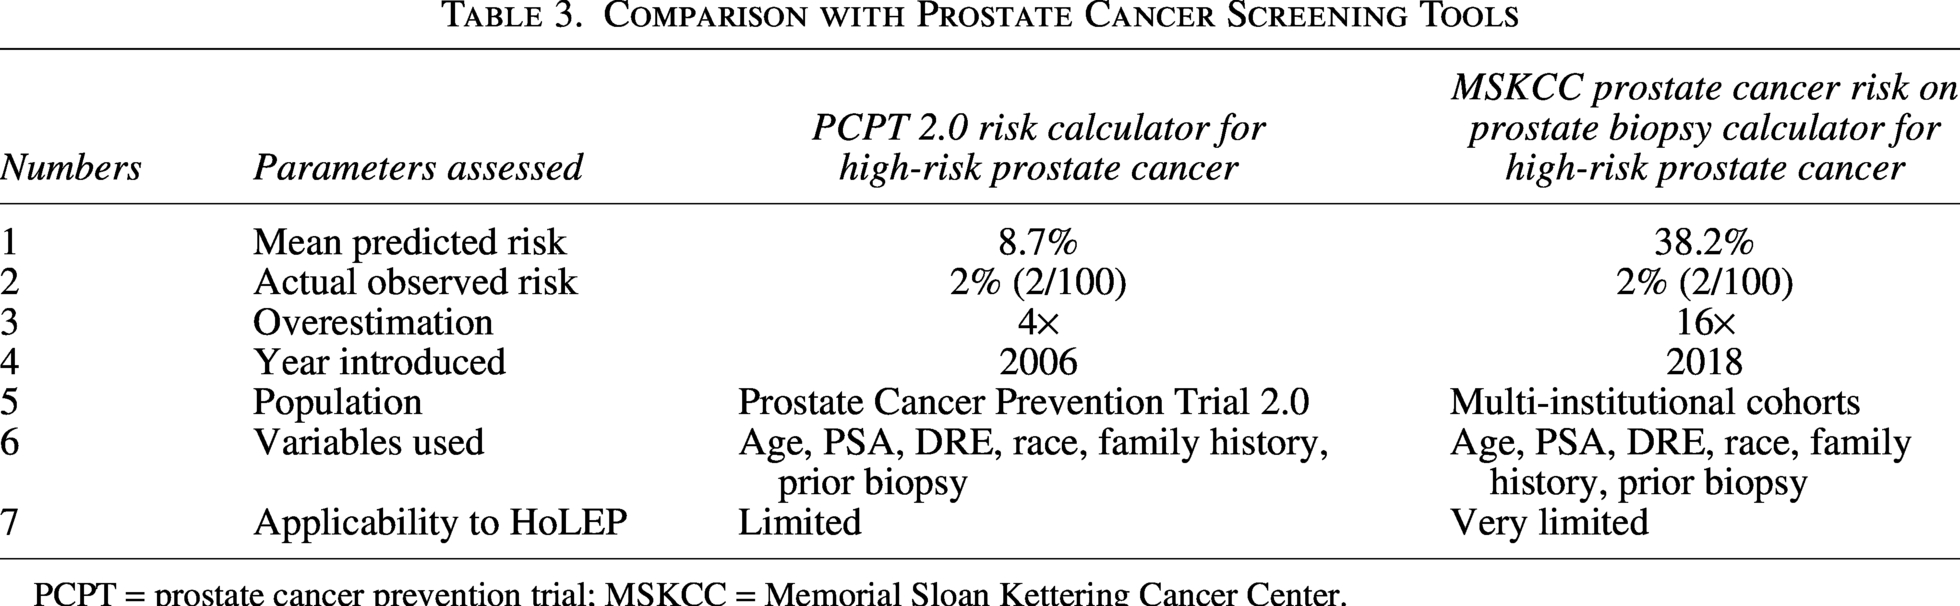
The comparison with standard tools revealed a significant difference between their predictions and those of the post-HoLEP cohort. In the validation set (n = 100), the actual observed incidence of csPCa was 2%. Both the standard models significantly overestimated the risk. Using the PCPT risk calculator, the mean predicted risk of high-grade prostate cancer was 8.78% (interquartile range [IQR] 3%–13.25%). The overestimation was even more with the MSKCC calculator. It estimated a mean risk of 38.17% (IQR 19%–56%). This is summarized in Table 3.
Comparison with Prostate Cancer Screening Tools
PCPT = prostate cancer prevention trial; MSKCC = Memorial Sloan Kettering Cancer Center.
Postoperative PSA kinetics and a novel variable of PSA reduction ratio (PRR)
The benign cohort showed a greater reduction in PSA levels postoperatively (median decrease: 91.5% vs 77.7%; p = 0.002) and a lower PSA nadir (median: 0.39 vs 1.0 ng/mL; p = 0.003). At 1 year of follow-up, the difference persisted (median 1.19 in csPCa vs 0.49 in the benign cohort; p = 0.028). Table 4 gives the post-HoLEP PSA trends. Cohen’s d effect size for PRR was approximately 1.0.
Post-HoLEP PSA Trend
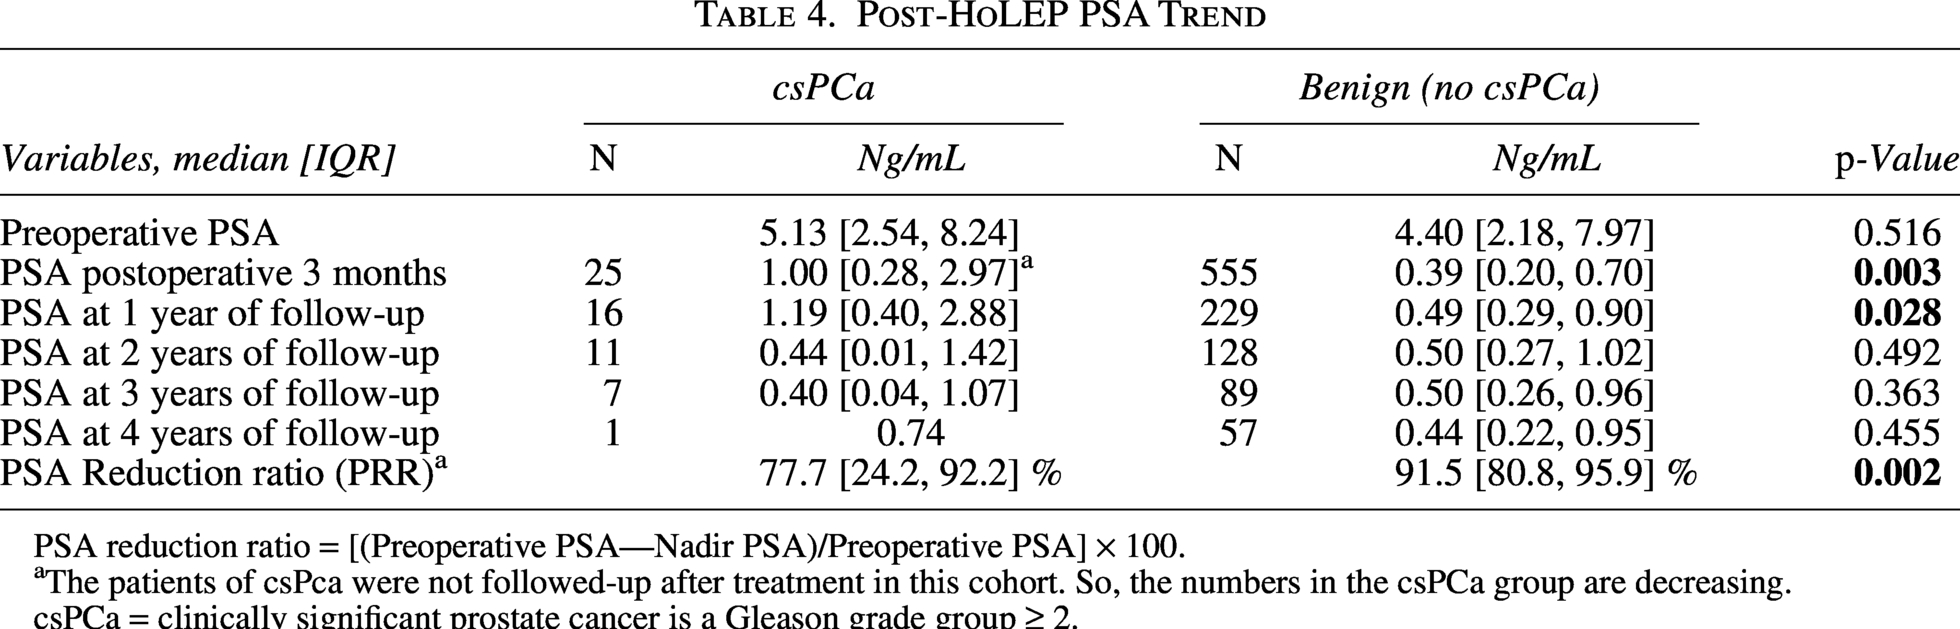
PSA reduction ratio = [(Preoperative PSA—Nadir PSA)/Preoperative PSA] × 100.
The patients of csPca were not followed-up after treatment in this cohort. So, the numbers in the csPCa group are decreasing.
csPCa = clinically significant prostate cancer is a Gleason grade group ≥ 2.
The maximum Youden Index (0.376) was observed at a threshold of 0.99 ng/mL for nadir PSA. This cutoff provided a Sn of 52% and a Sp of 85.6%. Increasing the threshold to 1.5 ng/mL significantly compromised Sn with a marginal gain in specificity. Therefore, a clinical cutoff of 1 ng/mL was selected. For PSA reduction ratio, the optimal threshold was at 53.3% (Youden index 0.540). This showed an Sp of 92.15% and a Sn of 60%. Therefore, a 50% cutoff was chosen for clinical decisions. (Supplementary Table S1) (Fig. 5).
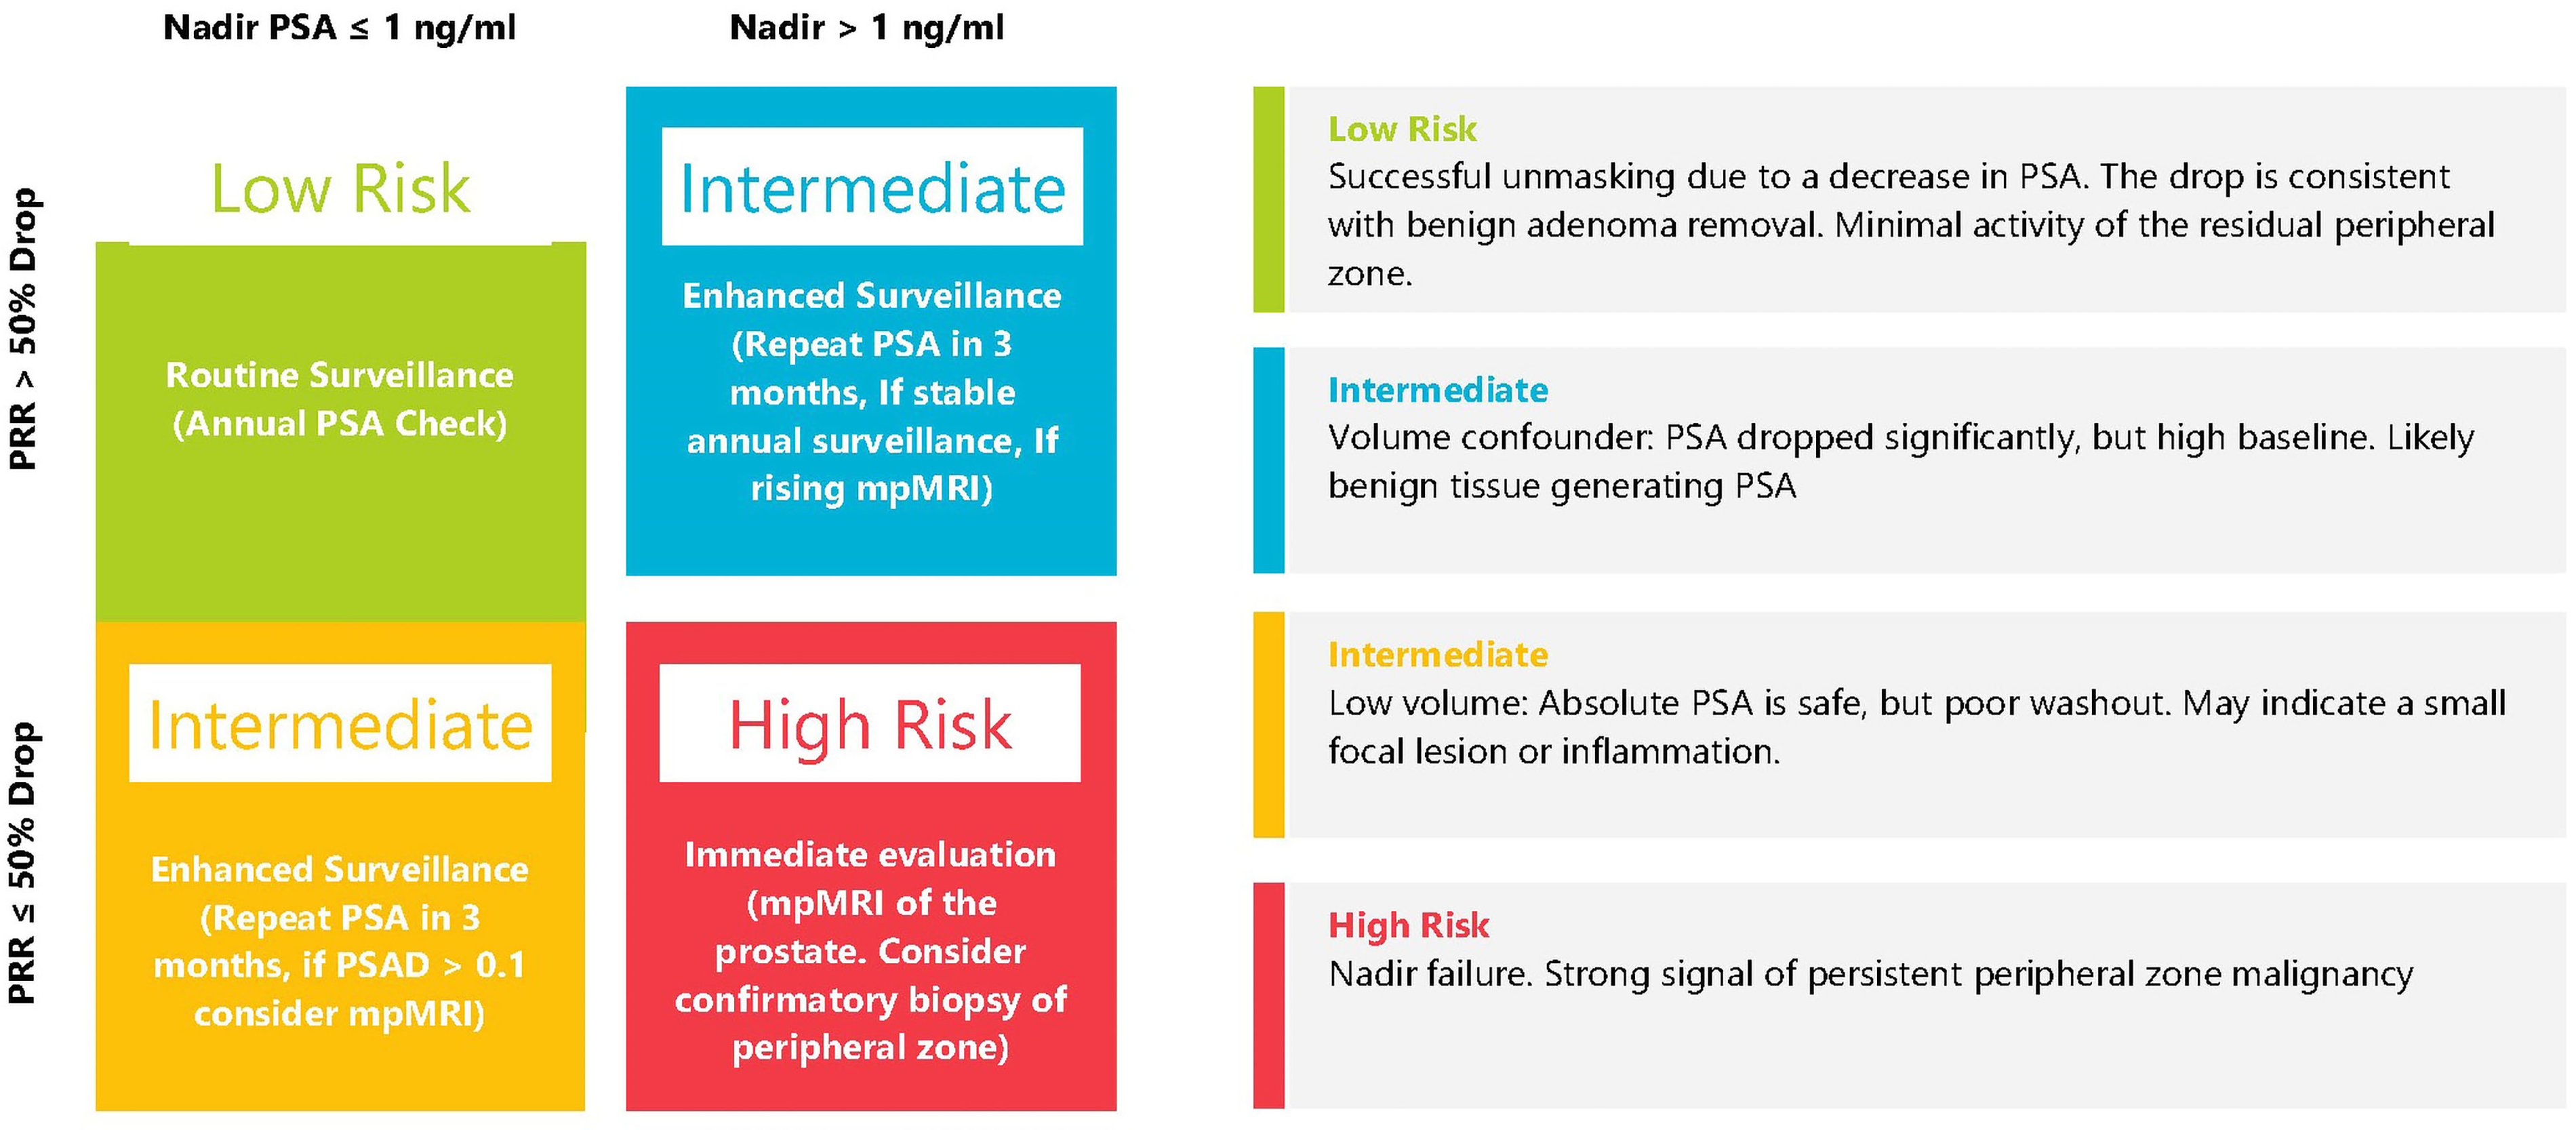
The Desai Sethi Urology Institute post-HoLEP surveillance algorithm. HoLEP = Holmium laser enucleation of the prostate.
The Desai Sethi Urology Institute Post-HoLEP Surveillance Algorithm
The PRR was significantly lower and showed greater variance in patients with csPCa than in those in the benign cohort. The decision matrix (Fig. 5) integrates PSA nadir and PRR. The green zone represents our benign cohort. The red zone represents the nadir failure, and the algorithm triggers evaluation if the patient fails the check.
Discussion
We developed a multivariate Cox proportional hazard regression model and a nomogram to determine the likelihood of detecting csPCa preoperatively. We also developed a postoperative DSUI surveillance protocol decision matrix to guide patient follow-up after HoLEP. Our analysis identified age, family history of prostate cancer, and PSAD as independent predictors of csPCa preoperatively. It also identified postoperative nadir PSA and PRR as significant parameters for effective follow-up after HoLEP.
The incidence of csPca after HoLEP in our study aligns with the literature. Pursnani et al. in their retrospective cohort showed that 2.3% had csPCa. In their cohort of 560 patients, they found 39 patients (7%) to be diagnosed with prostate cancer post HoLEP, out of which 13 (2.3%) had csPCa. Family history of prostate cancer was significantly associated with the detection of csPCa (HR 5.62, CI 1.59–19.95, p = 0.007). Jeon et al., in a meta-analysis, showed that in patients undergoing active surveillance, a combined hazard ratio of disease progression was 1.31 (95% CI 1.16–1.48, p < 0.001) in patients with a family history of prostate cancer. The higher HR in our study suggests that in men undergoing HoLEP, family history is a much stronger predictor than in the general population undergoing active surveillance. 8
The selection of PSAD instead of PSA is clinically significant, as patients with larger prostates have higher PSA, leading to a dilution effect that conceals malignancy. Whereas a high PSAD takes volume into account and removes the bias of large glands. Abedali et al. identified postoperative PSA and PSAD as having a high positive predictive value for prostate cancer detection on biopsy post-HoLEP. They concluded that those having PSA > 1 ng/mL or PSAD ≥ 0.1 ng/mL 2 post HoLEP should undergo biopsy. 9 We identified the same cutoff postoperatively for PSA, which was used to create the decision matrix. Elmansy et al, in their study, evaluated 355 men over 8 years and identified 9 cases of prostate cancer. 10 These patients had higher baseline PSA levels (9.46 ± 7.94) and lower PSA reduction post-HoLEP (75.39% in the benign cohort vs 47.49% in the prostate cancer cohort, p < 0.001). They did not comment on PSAD. They identified that the mean PSA velocity at 1 and 3 years in the prostate cancer group was higher than that of the benign group. (1.28 vs 0.13 and 2.4 vs 0.09). Helfand et al performed a study of PSA and PSA velocity in 343 Transurethral Resection of the Prostate DRE: Digital Rectal Examination (TURP) patients, 54 HoLEP patients, and 68 open prostatectomy patients. Helfand et al. identified high PSA (2.4 in prostate cancer cohort vs 1.7 ng/mL in benign cohort in TURP patients and 4.1 in prostate cancer cohort vs 1.1 ng/mL in benign in open prostatectomy patients), PSA velocity (0.38 in prostate cancer cohort vs 0.06 in benign cohort in TURP patients and 0.47 in prostate cancer cohort vs −0.13 in benign cohort in open prostatectomy patients) in the postoperative period during follow-up as predictors of prostate cancer. 11 Our study also showed higher baseline postoperative PSA at 3 months and 1 year (Table 4). This was used to create the postoperative decision matrix.
No prior nomograms predict the detection of csPCa post-HoLEP. Our model can help guide patients’ clinical decision-making in the preoperative setting. Bruno et al. showed that PSAD is a better predictor of prostate cancer than PSA, specifically in patients who have raised PSA due to benign conditions. 12 However, csPCa leads to a fallout from the active surveillance cohort due to rising PSA. Also, a small gland was associated with active surveillance discontinuation, as it is considered a predictor of prostate cancer in many studies.13,14
To observe the probability of prostate cancer using standard screening tools, we used the PCPT 2.0 risk calculator and the MSKCC calculator. PCPT 2.0 overestimated the risk in the post-HoLEP cohort (8.78% vs 2% actual).15,16 The MSKCC calculator overestimated the mean risk to around 38%. If we use a 5% threshold for both calculators, 50 (50%) patients would need a prostate biopsy, and 75 (75%) patients in the MSKCC cohort would need a biopsy; whereas an actual biopsy should have been needed only in 2% of patients. 17 The PCPT cohort had 22% patients with prior biopsy, and the MSKCC cohort had 4.6% patients with prior biopsy in the high-risk patient cohort. Whereas our cohort has 37.3% patients with prior biopsy. This shows the limitations of standard risk screening tools to men undergoing HoLEP. Relying on such tools will lead to overinvestigation in such patients and may lead to unnecessary biopsies. Our HoLEP-specific nomogram corrects for volume-dependent confounding, giving a realistic estimate of prostate cancer in such patients.
Klein et al. gave a postoperative PSA cutoff of 2 ng/mL as a risk of prostate cancer progression. 18 Abedali et al. showed that a post-HoLEP PSA of > 1 ng/mL was associated with an 80% risk of csPCa, and a post-HoLEP PSAD > 0.1 ng/mL 2 associated with 88% risk of csPCa. 9 However, most patients are only followed up with PSA post-surgery, and post-operative imaging is an added test and is not needed if the DSUI surveillance algorithm is used. We also used PRR along with PSA to inform postoperative surveillance decisions. (Fig. 5).
The nomogram can help with preoperative counseling, and we can limit overtreatment using the DCA’s threshold of 5%. An AUC of 0.71 indicates fair discrimination. However, this must be interpreted with caution in the post-HoLEP setting, as the extensive removal of the transition zone alters the baseline utility of traditional predictive variables. Although nomograms provide a necessary baseline today, we recognize that they are often underutilized in routine daily practice. The decision matrix can be used for postoperative follow-up.
Our research has many limitations. This is a single-center, retrospective database study. The low number of events in this cohort is due to the low incidence of csPCa detection after HoLEP. These patients are often extensively worked up before HoLEP to reduce the chances of missing prostate cancer. Future models with multi-center robust databases using artificial intelligence (AI) based predictive models may perform better in predicting the probability of csPCa. However, given the low prevalence (3.9%) of prostate cancer post-HoLEP, machine learning and AI models may suffer from bias due to overfitting or bias towards the majority class. These models require very large training datasets. 19 Another limitation is the need for external validation of this nomogram. Despite this limitation, our study provided a framework for future multicentric studies to help create a personalized guide for prostate cancer screening after HoLEP. This nomogram and decision model can also be applied to other methods, such as enucleation, TURP, endoscopic methods, and open or robotic simple prostatectomy. Applicability after TURP depends on the amount of adenoma removed.
Conclusions
We present a validated nomogram to predict csPCa preoperatively. The integration of age, family history of prostate cancer, and PSAD provides an accurate estimation. Standard assessment tools such as PCPT and MSKCC significantly overestimate the risk for this patient group. We also propose a DSUI surveillance protocol based on nadir PSA and a novel PRR. The DSUI surveillance protocol has a high Sp and high negative predictive value.
Authors Contributions
Conception and design: G.S. and H.S. Data analysis and interpretation: G.S. and H.S. Critical revision of the article for scientific and factual content: G.S., J.E.K., R.M., A.K., S.P., M.L.G., D.J.P., and H.N.S. Drafting the article: G.S., H.B., A.A., S.R., J.V.O. Supervision: A.K. and H.N.S. Statistical analysis: G.S. and H.B.
Ethics Statement
The study is approved by the institutional IRB (# 20180511).
Footnotes
Authors’ Disclosure Statement
The Authors have no conflicts of interest to disclose.
Funding Information
No funding was received for this article.
Supplemental Material
Supplemental Material
Abbreviations Used
References
Supplementary Material
Please find the following supplemental material available below.
For Open Access articles published under a Creative Commons License, all supplemental material carries the same license as the article it is associated with.
For non-Open Access articles published, all supplemental material carries a non-exclusive license, and permission requests for re-use of supplemental material or any part of supplemental material shall be sent directly to the copyright owner as specified in the copyright notice associated with the article.