
Abstract
Web surveys present methodological challenges including lower response rates as compared to other survey methods. The literature on invitations to participate in web surveys builds on previous research suggesting that advance letters are cost-effective means for increasing response rates in mail surveys and interviewer-administered surveys. The efficacy and appropriateness of design elements of invitations to participate in a web survey is not yet well understood. This research reports results of a full-factorial experiment (n = 15,652) of five design elements of web survey invitations—invitation mode, subject line, location of URL link, length of the invitation text, and survey time/effort estimate. There were significant effects of different design elements on response rates. The results suggest that some design elements of invitations may have similar effects across subsets of populations, while others may have different effects on different subsets of potential respondents.
Keywords
Introduction
The literature on invitations to participate in web surveys builds on previous research suggesting that the design of mailed invitations or advance letters can affect response rates in both mail surveys and interviewer-administered surveys (e.g., De Leeuw, Callegaro, Hox, Korendijk, & Lensvelt-Mulders, 2007; Dillman, 2007; Dillman, Clark, & Sinclair, 1995; Hembroff, Rusz, Rafferty, McGee, & Ehrlich, 2005). However, e-mail is a different medium than postal letters as a method of invitation, and the efficacy and appropriateness of design elements of invitations to participate in a web survey are also not yet well understood. While several studies have explored the mode of prenotification to web surveys (Bosnjak, Neubarth, Couper, Bandilla, & Kaczmirek, 2008; Crawford et al., 2004; Harmon, Westin, & Levin, 2005; Kaplowitz, Hadlock, & Levine, 2004), we are not aware of research on the invitation mode to such surveys. This research attempts to identify “theoretically consistent … strategies for meaningfully improving response rates to web-based surveys” (Trouteaud, 2004, p. 385) by focusing on invitations to participate in a web survey. We report results of a full-factorial experiment of five design elements of web survey invitations—invitation mode, subject line, location of URL link, length of the invitation text, and survey time/effort estimate.
Previous Research and Hypotheses
Invitation Mode
There is little research on the mode of invitation to a web survey—in part because e-mail is such an attractive option from a cost perspective if e-mail addresses are available and postal mail is typically used otherwise. We tested the efficacy of mailed postcard invitations versus e-mail invitations. Postcard invitations may not carry the same legitimacy as a letter and do not permit the inclusion of incentives or other materials. They are also less confidential and login information is readily visible. However, because postcards are cheaper and require less processing than mailed letters, they deserve exploration as an alternative to e-mailed invitations. We hypothesized that for potential respondents with e-mail addresses, e-mail invitations to participate in a web survey would result in significantly higher response rates than postcard invitations.
Invitation Length
It is argued (e.g., Nielsen, 2000) that Internet users—and, by extension, e-mail users—do not want to read a lot of text and that text should be short and designed for scannability. Dillman, Smyth, and Christian (2009, p. 282) similarly advise “keep e-mail contacts short and to the point.” Klofstad, Boulianne, and Basson (2008) tested the length of e-mail invitations (long vs. short) and did not find significant differences in web survey response rates. To further explore invitation text length, we created a “longer” version (182 words; see Figure 2 ) and a “shorter” version (80 words; see Figure 1 ) of our web survey invitations. These text lengths are comparable to those (210 and 87 words) used by Klofstad et al. (2008). Our longer version’s additional text was carefully chosen and tested to make additional wording as neutral as possible, neither persuasive nor off-putting. We expected, all else equal, that the lower reading burden of shorter invitations would yield a higher response rate than the longer invitations.
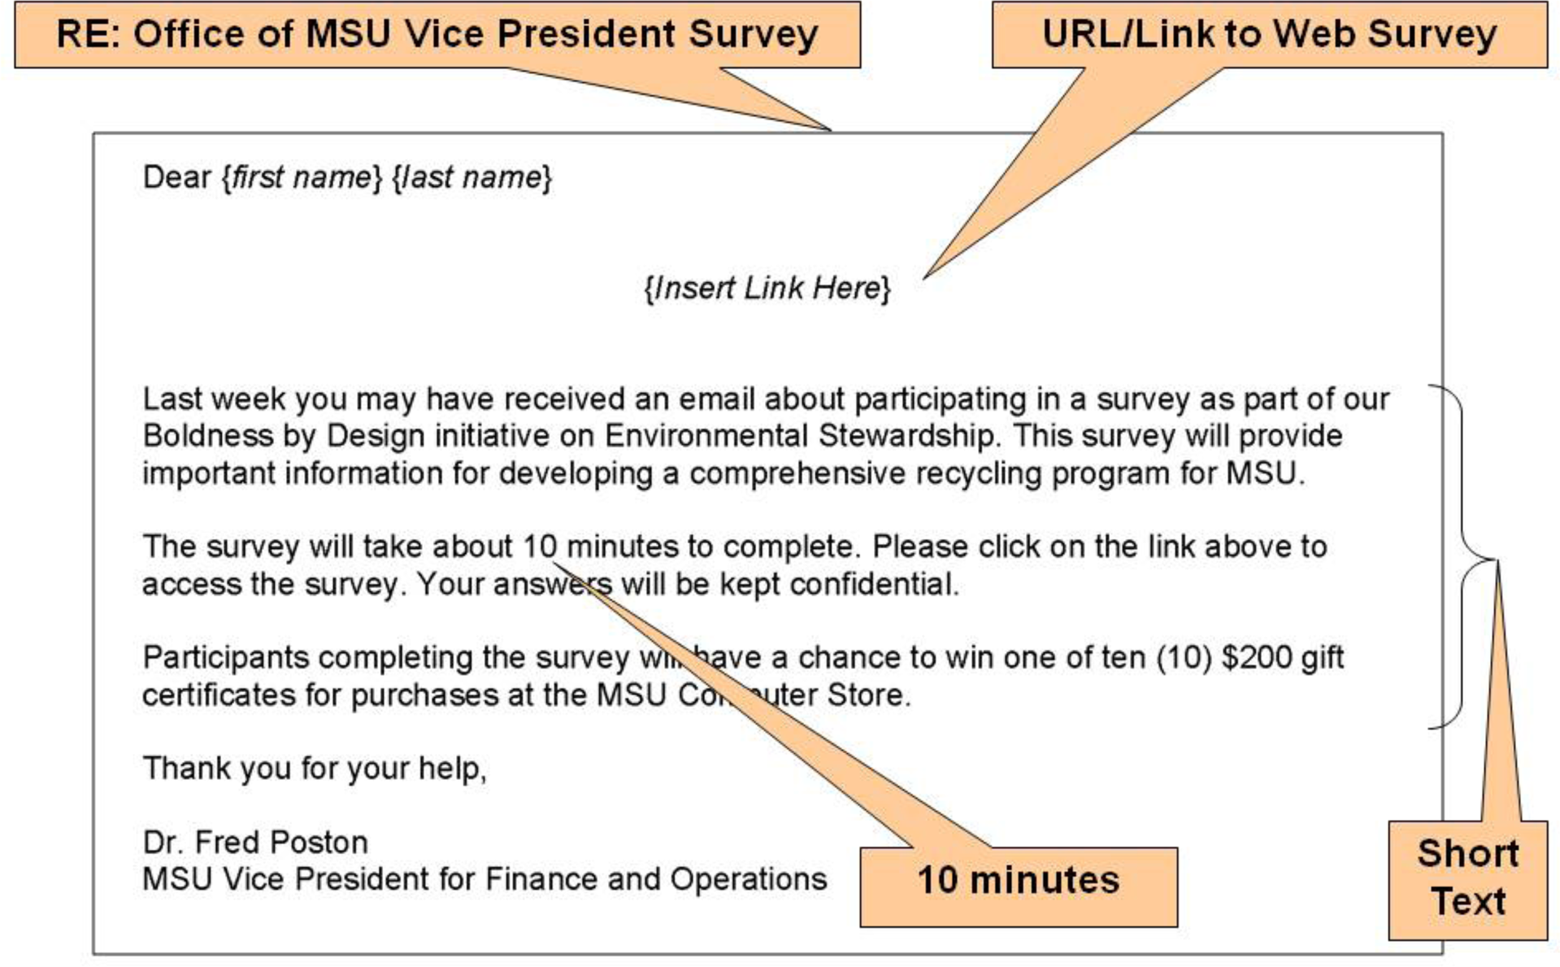
Short text invite with 10-min effort, top URL, and VP subject line design.
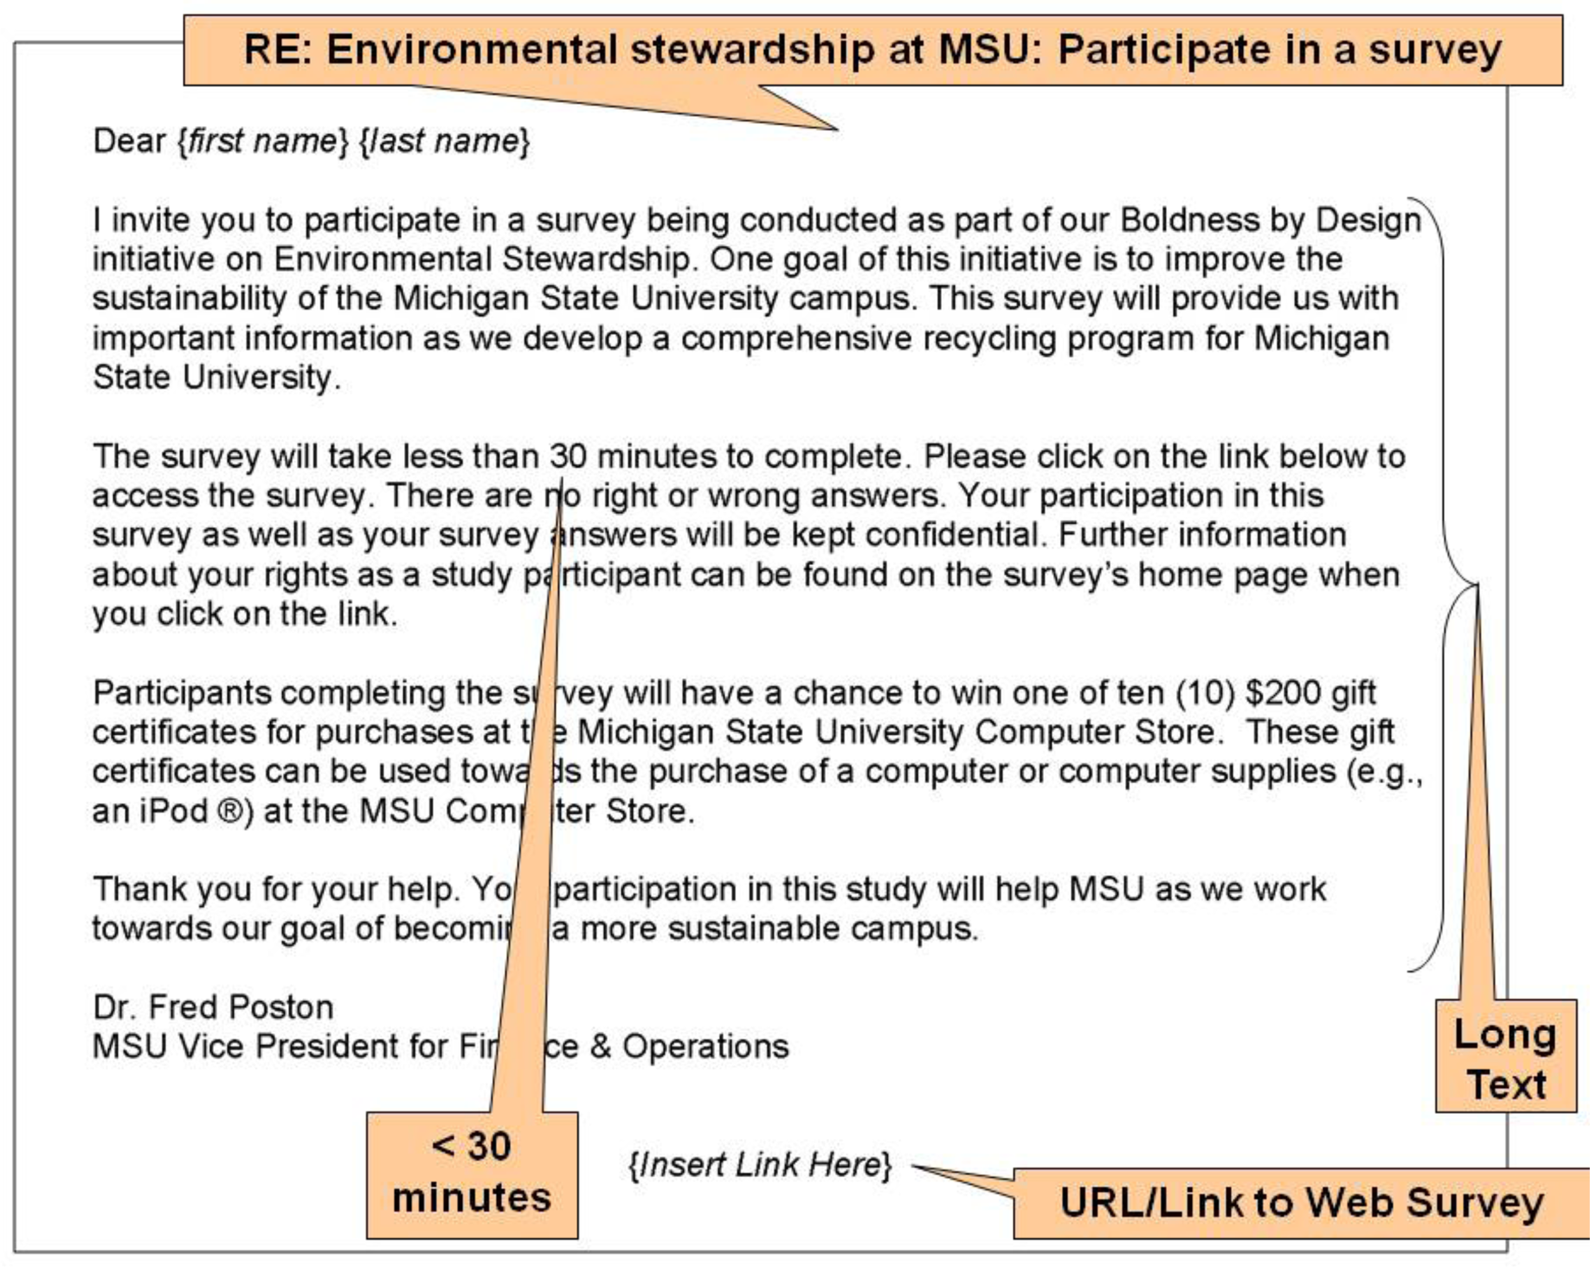
Long text invite with less than 30-min effort, bottom URL, and environmental subject design.
URL Placement
Studies have compared invitations with URL links that contain embedded identifiers to invitations requiring manual entry of an identification/password (see Crawford, Couper, & Lamias, 2001; Heerwegh & Loosveldt, 2002, 2003; Joinson, Woodley, & Reips, 2007). However, no previous research has been reported on the location of URL links in web survey invitations. Couper (2008) suggests placing the URL near the top of the e-mail invitation to avoid respondents having to scroll to access the survey. We designed our invitations so that half the sample received invitations with the URL (link to the web survey) at the top of the invitation’s body of text and half the sample received an invitation with the URL at the bottom of the invitation text. For the postcard mode, the URL included the needed login information. We hypothesized that URLs at the top of the invitations would yield higher response rates, especially in the e-mail condition, since respondents may ignore the invitation text and simply click on or use the more visible URL link at the top.
Survey Effort
Trouteaud (2004) reported that e-mail invitations using “short” estimates of survey completion time (3–5 min) as opposed to “long” estimates (10–15 min) resulted in higher response rates to web surveys. Marcus, Bosnjak, Lindner, Pilischenko, and Schutz (2007) observed higher response rates when potential respondents were told that a web survey would take 10–20 min as compared to being told the web survey would take 30–60 min. Crawford, Couper, and Lamias (2001) found that potential respondents who were told the survey would take less time (8–10 min) were more likely to start the survey (67.5%) than those told it would take more time (20 min; 63.4%), but also more likely to break off, resulting in comparable completion rates.
Pretesting found that most respondents took 9–12 min to complete our web survey. In our experiment, half of the sample was told that the web survey would take “about 10 min” and the other half was told that the web survey would take “less than 30 min.” We hypothesized that web survey invitations with the shorter time estimate would be perceived as less of a burden and would receive a higher response rate.
Subject Line
Porter and Whitcomb (2005) tested web survey invitations with subject lines that varied—reasons for the e-mail, sponsorship of the e-mail, a plea for help, and a blank. The only significant difference on response rates was the blank subject line for “low involvement” respondents (students who did not apply to the university sending the survey invitation). Trouteaud (2004) tested “plea” (“Please help”) versus “offer” (“Share your advice”) subject lines in invitations and reported a significant response rate increase for the plea subject line.
Use of a high authority figure in survey invitations has been suggested as a means to increase mail and other survey response rates (Guéguen & Jacob, 2002a; Joinson & Reips, 2007). Other studies suggest that potential survey respondents are more likely to participate when they feel some affinity with the sender of the e-mail (Guéguen & Jacob, 2002b; Guéguen, Jacob, & Morineau, 2010). At the same time, high subject matter salience with potential respondents has been associated with higher response rates (Cook, Heath, & Thompson, 2000; Edwards et al., 2002; Marcus, Bosnjak, Lindner, Pilischenko, & Schutz, 2007). We tested two web survey invitation subject lines not yet empirically examined. Half of our sample received invitations with a subject line with a request from an authority figure, “MSU Vice President asks you to take a survey.” The other half received invitations also from the authority figure with a salient subject request, “Take an MSU survey on campus environmental stewardship.”
Method
This note is based on data collected from a campus-wide web survey about recycling and energy conservation that invited response from roughly one third of university students, faculty, and staff (n = 15,652). The web survey instrument and invitations were developed in multiple phases, in an iterative process (Kaplowitz, Lupi, & Hoehn, 2004). The survey contained a brief informed consent page and several short sections of substantive questions with results reported elsewhere (Kaplowitz, Yeboah, Thorp, & Wilson, 2009).
Survey Sample and Implementation
A random sample for the study was drawn from the university’s official lists of faculty, staff, and students. All students, faculty, and staff at Michigan State University (MSU) have a university e-mail account, free access to the Internet, and a local mailing address of record on file with the university. Furthermore, MSU students, faculty, and staff are expected to use their university e-mail and postal mail for university business and communication.
The survey invitations were designed to accommodate the five experimental manipulations—mode, length, URL, effort estimates, and subject lines (see Table 1 and Figures 1 and 2) in a fully crossed design. Potential participants were randomly assigned to 1 of 32 versions of the invitation from a full-factorial experimental design. Because of differential costs, a random one third of the sample was assigned the postcard mode and two thirds was assigned the e-mail mode. Funding limits and an administrative decision to maximize input to the substantive survey necessitated the use of e-mail invitations as the final (third) reminder to all nonrespondents. All other experimental conditions were assigned randomly to half of each sample
Invitation Experimental Treatments
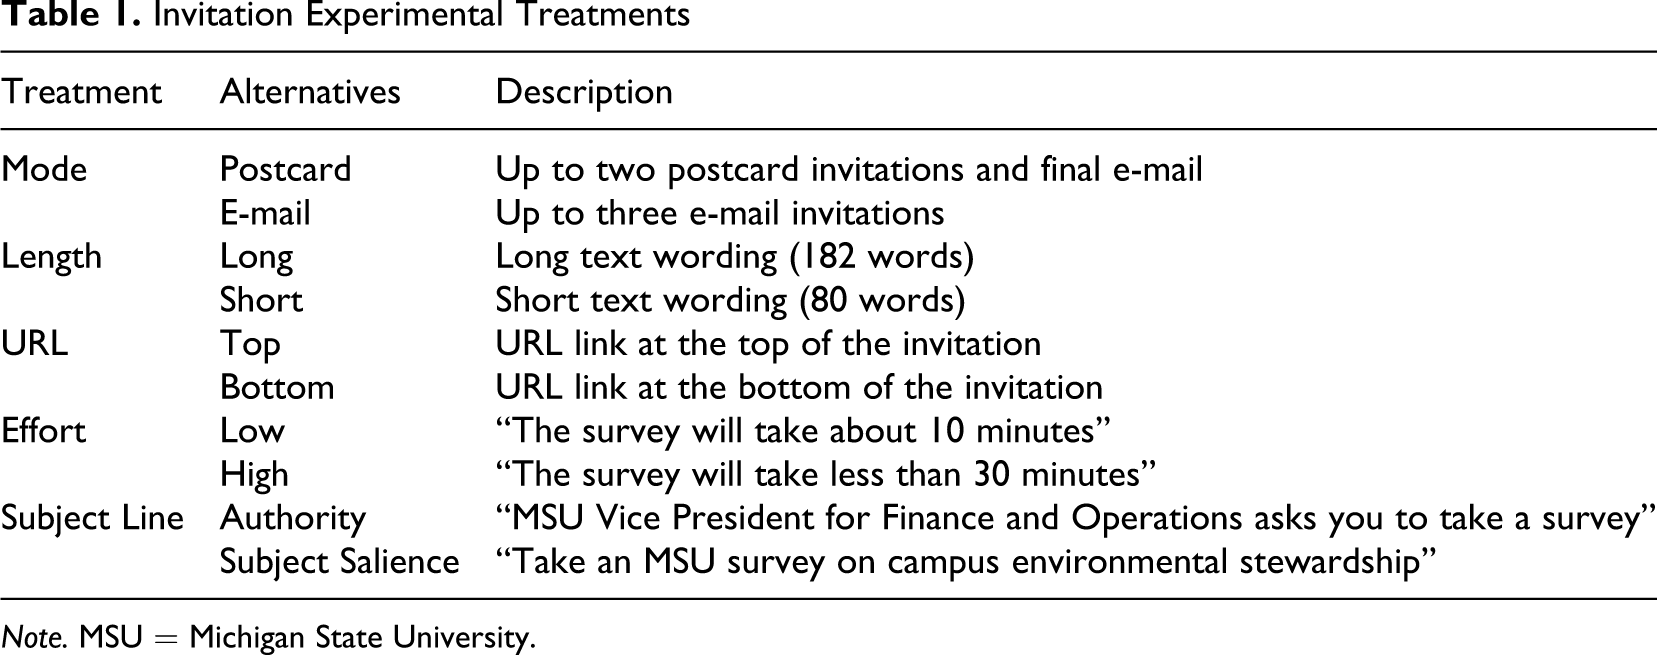
Note. MSU = Michigan State University.
An initial invitation was sent to all members of the sample during winter 2007–2008 informing them of the study, asking them to participate, and providing them with a link to the web survey. Up to two additional follow-up invitations were sent to those who had not yet responded within 10 days of the prior invitation. In the postcard group, this meant two postcard mailings followed by an e-mail invitation. In those instances where invitations were returned as undeliverable, efforts were made to correct the address and resend the invitation.
Results
Aggregate Response Rates and Break-Offs
A total of 3,896 individuals participated in the study. Table 2 shows that the overall response rate (RR1) was 24.9% (American Association for Public Opinion Research [AAPOR], 2009). There were significant differences in aggregate response rates across the campus subpopulations—the highest response rate was for staff (42.8%), followed by faculty (38.0%), and then students (20.2%) (χ2(2, n = 15,652) = 630.85, p = .000).
American Association for Public Opinion Research (AAPOR) Minimum Response Rates (RR1) for Survey Populations
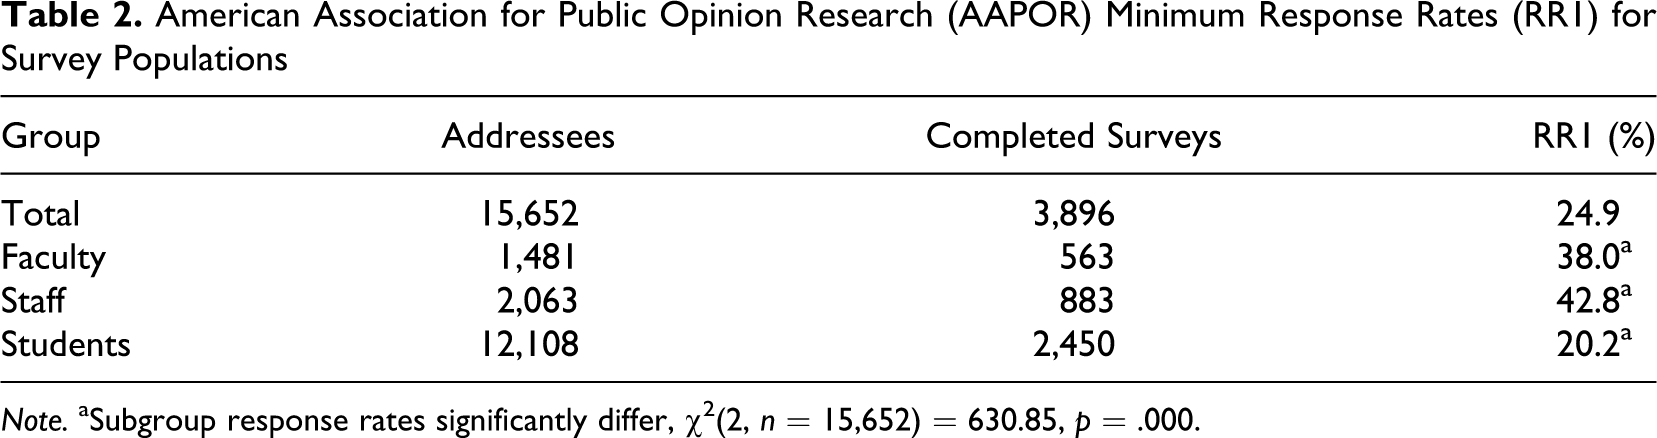
Note. aSubgroup response rates significantly differ, χ2(2, n = 15,652) = 630.85, p = .000.
An examination of the completion rate of subjects that started the web survey revealed that less than 1% of respondents who consented to participate in the survey broke off (i.e., did not complete key survey and demographic questions). There were no differences in the rates of break-offs among student, staff, and faculty respondents (Fischer’s exact test (n = 3,922) = 2.790, p = .240).
Response Rate Effects of Design Elements
Mode
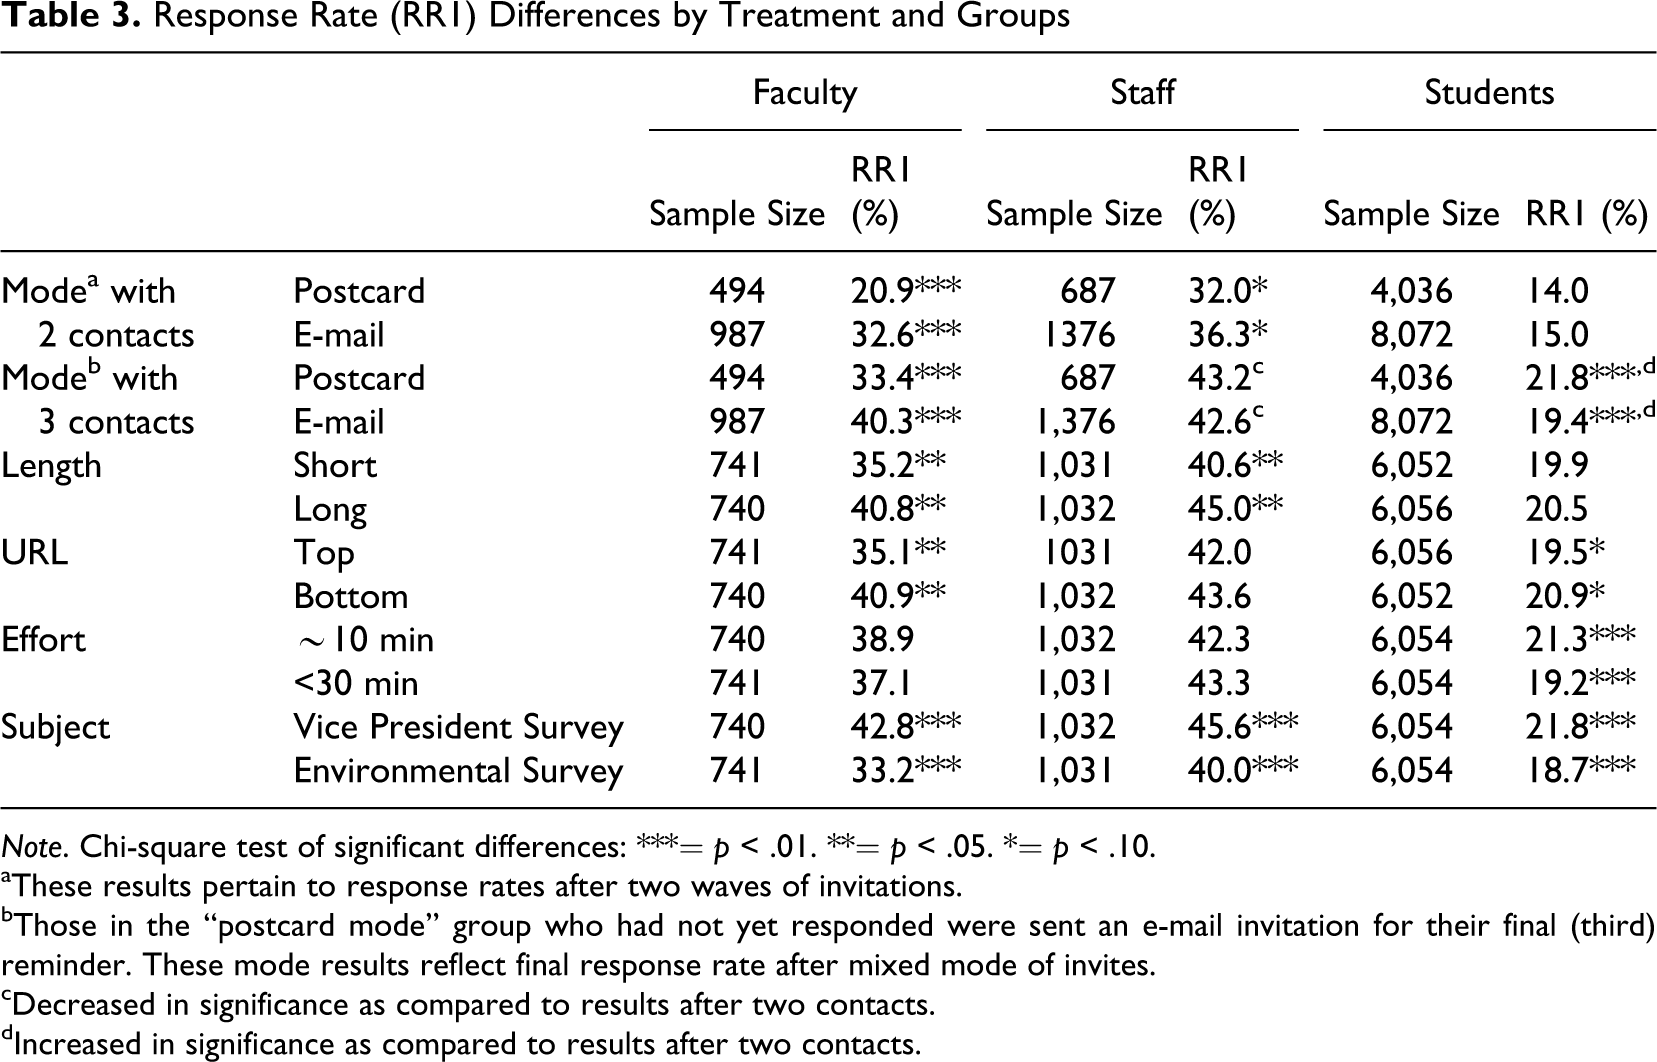
As mentioned previously, the third invitation mode changed for the postcard group. Therefore, Table 3 reports response rate results for invitation mode before the final invitations were sent (Wave 2) and 2 weeks after final invitations were sent (Wave 3). Wave 2 results show that e-mail invitations (as compared to postcard invitations) yielded significantly higher response from faculty (11.7% more, p < .01) and staff (4.3% more, p < .10). Students did not respond statistically differently to postcard and e-mail survey invitations after Wave 2. The aggregate response rates increased across the board as a result of the third contact. While the mode difference observed for staff after two waves of contacts disappears after they receive a third contact, a mode effect now emerges for students with the postcard/e-mail combination—a significantly higher response rate than the e-mail only group. These results indicate the relative attractiveness of using multiple contacts and using mixed invitation modes (in our case postcards and e-mail).
Response Rate (RR1) Differences by Treatment and Groups
Note. Chi-square test of significant differences:
***= p < .01.
**= p < .05.
*= p < .10.
aThese results pertain to response rates after two waves of invitations.
bThose in the “postcard mode” group who had not yet responded were sent an e-mail invitation for their final (third) reminder. These mode results reflect final response rate after mixed mode of invites.
cDecreased in significance as compared to results after two contacts.
dIncreased in significance as compared to results after two contacts.
Invitation text length
As Table 3 indicates, the invitations with longer text have significant and positive effects on response rates as compared to the shorter text invites for faculty (5.6% more, p < .05) and staff (4.4% more, p < .05). The length of invitation text had no significant effect on the response rates for students. We expected that the effect of the invitation length may be greater for e-mail invitations than postcards invitations, given the literature on reading electronic text.
URL location
The results show that the survey link (URL) location does affect survey response rates, but in a direction contrary to expectation. As Table 3 illustrates, more faculty responded to the e-mail invitations with the URL at the bottom (5.8%, p < .05) and more students responded to e-mail invitations with the URL at the bottom (1.4%, p < .10). There was no significant difference in the response of staff to the invitation’s URL placement.
Survey effort estimate
The different effort estimates in the invitations did not result in significantly different response rates from faculty and staff. However, students who received invitations to the web survey with the short estimate (“about 10 min”) had 2.1% higher response rate (p < .01) as compared to students receiving invites with the long estimate (“less than 30 min”). Unlike faculty and staff who might decide to (not) participate in a survey for reasons other than survey effort and/or may discount/dismiss survey effort estimates, the students appear to be influenced by the survey effort (time) estimates in the invitations.
Subject line
The “authoritative” subject line in our web survey invitations significantly increases web survey response. Referencing a request from the institution’s VP in the subject line significantly increased response from faculty (9.6%, p < .01), staff (5.6%, p < .01), and students (3.1%, p < .01) relative to the subject line emphasizing the survey topic.
Discussion
The results show that invitation mode, all else equal, results in different relative response rates for students, staff, and faculty. E-mail invitations appear to yield higher rates of response than postcard invitations for faculty while postcard invitations resulted in comparable rates to e-mail invitations for the others after three waves of contacts. These results, in line with Porter and Whitcomb (2007), reveal that a three-contact mixed-method invitation (use of both postcard and e-mail invitations) worked better than three e-mail invitations. This may be due, in part, to the possibility that conventional mail is more novel or stands out to students.
The response rate effects of the other invitation design elements also differed across the three populations. Staff did not respond to the URL invitation design elements like the faculty or the students. The URL placement at the bottom of the invitations is associated with higher response rates for students and faculty. One post hoc explanation may be that placing the URL at the bottom of the invitation encourages recipients to read the entire message, which may increase the legitimacy of the request and motivation for participating. Placing the URL at the top of the invitation is clearly not better for any of our three groups. These results provide support for designing web survey invitations that place survey links in easy to identify locations further down or at the bottom of the message. Of course, the experiment is not an exhaustive test of how and where to place the URL.
While conventional wisdom and some research evidence suggests that mentioning shorter survey time estimates in invitations is better, this did not prove to be the case in our experiment for faculty and staff. Only students receiving invitations with the “about 10 minutes” estimate actually responded at a significantly greater rate to the survey invitations (2.1%, p < .001). It may also suggest that the difference between “about 10 minutes” and “less than 30 minutes” is not as salient for some populations (e.g., faculty and staff) as it may be for others (e.g., students).
Our results indicate that the longer invitation text appears to increase survey response more than the shorter invitations for faculty and staff. The length of invitation text appears to make no difference in student response rates. Invitation text length makes a difference and shorter invitation messages are not necessarily better than longer versions for promoting increased response to web survey invitations. The longer text may convey a more authoritative tone than the shorter text, and/or the longer invitation text may help potential participants understand the elements of the invitation. That is, there may be a “seriousness” or “importance” signal that the longer text conveys to subjects that accounts for their increased response even if the shorter text touches on those same elements.
The results also support the notion that an authoritative subject line increases response rates to web survey invitations. All three sample populations evidenced significantly greater response rates to invitations that used the authoritative subject line. It may also be that the “authoritative” subject line may have increased response because of feelings of affinity with the sender (Guéguen & Jacob, 2002b; Guéguen, Jacob, & Morineau, 2010).
While the postcard invitations yielded significantly lower response rates for faculty and staff, the rates were not dramatically lower than e-mail invitations for staff, and the difference for students was not significant. This suggests that, despite the inconvenience to recipients of having to type the URL into a web browser, postcard invitations may work for some situations, especially when e-mail addresses are not available. This suggests that more research is needed on mailed versus e-mailed invitations to web surveys. The results also confirm the conventional wisdom that more contacts (more invitations to participate) increase response rates.
Conclusion
The design of web survey invitations affects response rates, with effects that differ across subpopulations. The longer invitation text significantly increased response rates for faculty and staff and had no significant impact on student response. Placing the URL survey link at the bottom of the invitations also increased response rates. Likewise, use of an authoritative subject line rather than one seeking participation in a survey also increased survey response rates. The use of the mixed postcard/e-mail invitation approach appeared beneficial for student response. Nevertheless, the results demonstrate that using postcards to invite participation in a web survey can work fairly well.
Some practical implications of this study include: Use multiple contacts and mixed modes to invite web survey participation. Invitations should not be “too short” at the expense of completeness and persuasiveness. Longer invitations can have significant and positive effects on response rates for some groups of respondents. Place survey URL near the bottom of web survey invites. Do not overestimate effort/time to take the survey. Provide accurate time/effort estimates. Use of an authoritative, perhaps, familiar sender/subject line can improve response.
The differential effects of the experimental treatments across the three relatively limited populations we studied suggest caution in generalizing the results of this study—or others conducted in specific populations—to other populations or groups, survey topics, or settings. Nonetheless, this study represents an earnest attempt at testing several of the hypotheses relating to the design of survey invitations. Our results suggest that this is a fruitful line of inquiry into methods to improve response rates to web surveys.
Footnotes
Acknowledgments
The authors wish to thank the Michigan State University (MSU) Vice President of Finance and Operations (VPFO) Fred Poston and assistant VPFO Kathryn Lindahl, for their support and the opportunity to integrate undergraduate, graduate, and faculty research into a campus-wide planning and environmental stewardship effort. The authors would also like to thank Chelsea McMellen, Lauren Olson, Diana Oppenheim, Aimee Wilson, Sibbir Norman, Felix Yeboah, and David Gebben for their research assistance. All opinions, errors, and omissions are those of the authors.
Declaration of Conflicting Interests
The authors declared no potential conflicts of interest with respect to the research, authorship, and/or publication of this article.
Funding
The authors disclosed receipt of the following financial support for the research, authorship, and/or publication of this article : The authors received financial support for the research from the Michigan State University (MSU) Office of the Vice President for Finance and Operations (VPFO).